
On-line Measurement for Ohmic Resistance in Direct Methanol Fuel Cell by Current Interruption Method*
2010-02-14 08:25LIUMin刘敏WANGJinhai王金海WANGShubo王树博XIEXiaofeng谢晓峰ZHOUTao周涛andMathur
LIU Min (刘敏), WANG Jinhai (王金海), WANG Shubo (王树博), XIE Xiaofeng (谢晓峰),**,ZHOU Tao (周涛)** and V. K. Mathur
1 College of Chemistry and Chemical Engineering, Central South University, Changsha 410083, China
2 Institute of Nuclear and New Energy Technology, Tsinghua University, Beijing 100084, China
3 Department of Chemical Engineering, University of New Hampshire, NH 03824, USA
1 INTRODUCTION
Direct methanol fuel cell (DMFC) is receiving more and more attention due to its advantages of high power density, convenient fuel storage and mild operating conditions. It is becoming an ideal candidate for portable power source such as in personal digital assistant devices, cellular phones and notebook computers [1-3].
In DMFC, the ohmic resistance is a key factor affecting the cell performance. The three sources of ohmic resistance are: (a) resistance to ion migration in the electrolyte, (b) resistance to electron transport in the cell components (electrodes, gas diffusion layers,and flow field/current collectors), and (c) contact resistances [4]. Among them, the resistance to ion migration in the electrolyte,i.e. the membrane resistance,is the main component of ohmic resistance. Therefore,to some extent the ohmic resistance represents the performance of a proton exchange membrane. Furthermore, the proton exchange membrane is the heart of a fuel cell and the cell performance is greatly affected by the membrane. The study on the ohmic resistance under different operating conditions is of great importance for improving the cell performance and accelerating its commercialization.
Electrochemical impedance spectroscopy (EIS)has been widely used in fuel cell impedance analysis.An alternating current (AC) perturbation over a broad range of frequencies is imposed to the cell and the resulting variations in the cell voltage and current are monitored. With the equivalent circuit modeling, the parameters including ohmic resistance can be estimated[5-7]. However, the testing time is long, the data analysis is complicated, and errors are produced in the use of equivalent circuits.
As a time-domain technique, current interruption method can obtain accurate data, which includes the current and voltage before and after each interruption.This method is widely used to evaluate the ohmic resistance of electrochemical systems [8, 9]. In a H2/O2proton exchange membrane fuel cell (PEMFC), the current interruption method has been used [8, 10, 11].However, the study on current interruption method used in DMFC is rather limited. The basic principle of the current interruption method is shown in Fig. 1.The current is interrupted and the voltage transient is observed. The voltage drop caused by ohmic resistance vanishes almost immediately, while the relaxation of electrochemical over-potentials takes place at a considerably slower rate. Therefore, the ohmic loss ΔVcan be measured from the differences between the voltages before and after the current interruption[11, 12]. The ohmic resistance of the cell is the quotient of the ohmic loss ΔVand the cell current densityijust prior to the interruption,RΩ=ΔV/i.
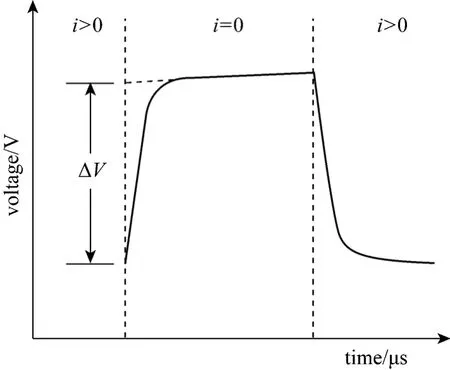
Figure 1 Idealized voltage waveform during current interruption event [5]
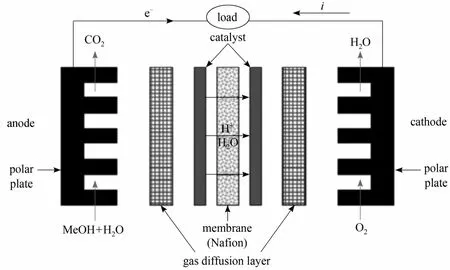
Figure 2 Detailed structure for direct methanol fuel cell
In this paper, the current interruption method is employed to investigate the ohmic resistance in a DMFC at different temperatures and current densities[13, 14]. The EIS is also used to measure the ohmic resistance [6, 15, 16] for demonstrating the reliability and effectiveness of current interruption method.
2 EXPERIMENTAL
2.1 Preparation of membrane electrode assembly and single cell
The membrane electrode assembly (MEA) consists of a polymer membrane, cathode and anode catalyst layers and two gas diffusion layers (GDLs). Commercial Nafion 115 (DuPont) was used as the polymer membrane. By a catalyst coated membrane (CCM)technique, the cathode and anode catalysts were coated directly on either side of the membrane. The cathode and anode catalysts were 60% (mass) Pt/C (Johnson Matthey) and PtRu (1∶1 atomic ratio, Johnson Matthey),respectively, and the catalyst loading was 5 mg⋅cm-2on each side [17]. A hydrophobic carbon paper coated with a mixture of PTFE and carbon powder was used as GDLs. The active area of MEA was 100 cm2. The MEA was sandwiched between graphite polar plates, and then installed into a pair of copper current collectors. The detailed structure for DMFC is shown in Fig. 2.
2.2 Current interruption measurement
A KIKUSUI fuel cell test station equipped with KFM2150 FC impedance meter was used to carry out tests. The instruments parameters were set as follows:pulse width: 0.1 ms, pulse depth: 100%, and transition time: 0.01 ms.
During the tests, methanol solution (1 mol·L-1,30 ml⋅min-1) was supplied to the anode channel while air (2 L⋅min-1) was fed to the cathode channel at room temperature.
2.3 Electrochemical impedance spectrum (EIS)measurement
The instrument for EIS measurement was the same as which used for current interruption measurement. Equivalent circuit modelL1R1[QR2(L2R3)], shown in Fig. 3, was used to simulate all parts of the cell [3].The tests on the full cell were conducted at constant current density (100 mA⋅cm-2) with frequency ranging from 20 kHz to 10 mHz. The AC current amplitude was 5% of the DC current. The anode was supplied with methanol solution (1 mol·L-1, 30 ml⋅min-1) while air (2 L⋅min-1) was fed to the cathode channel at room temperature.
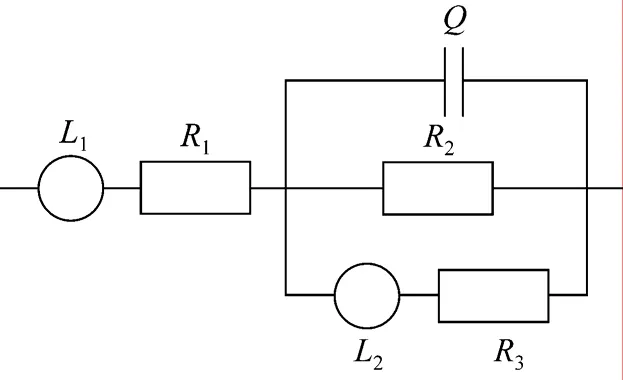
Figure 3 Equivalent circuit L1R1[QR2(L2R3)] as the model for simulating the impedance spectrum of DMFC
3 RESULTS AND DISCUSSION
3.1 Current interruption
Figure 1 shows an idealized voltage waveform during current interruption event. The actual voltage waveform is different. Fig. 4 presents the current and voltage waveform during current interruption event under the cell conditions of temperature 40 °C and current 14 A. After current interruption, a voltage overshoot takes place, and then, an oscillation follows.The same effects are also observed in reverse when the current is switched on again. These effects result from the inductance of the cell.
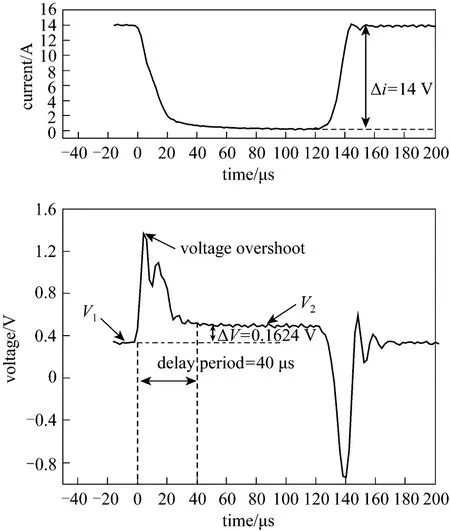
Figure 4 Current and voltage waveform during current interruption event (40 °C, current 14 A)
Because of the inductance effects, a delay period is needed before the ohmic voltage drop (ΔV). The delay period determines the ohmic resistance, so the choice of delay period is critical. If the delay time is too short, the ohmic rising voltageV2(Fig. 4) is not stable due to the influence of overshoot and oscillations; if the delay time is too long, the ohmic rising voltage is higher than the true value, as some relaxation of the electrochemical over-potentials has already taken place. Therefore, the rule to choose a proper delay period is: the delay period should be as short as possible to minimize the voltage change associated with discharging of the double-layer capacitance of the electrodes but long enough for the post-interrupt voltage measurement to occur after the inductive ringing decays completely [8]. In this measurement,according to the cell performance and the accuracy of the instrument, we select 40 μs for the delay period.As shown in Fig. 3, after the current interruption for 40 μs, the inductive ringing disappears, and the voltage appears like a horizontal line. The ohmic rising voltageV2(0.4972 V) is obtained by averaging the horizontal voltages. The ohmic voltage drop ΔV(0.1624 V) is the ohmic rising voltageV2(0.4972 V)minus voltageV1before the current interruption(0.3348 V). The ohmic resistance is obtained by formulaRohm=ΔV/i.
The cell ohmic resistance is affected by operating temperature and current density. Therefore, we measured the ohmic resistance at different temperatures (25,40, 60, and 80 °C) and current densities (30, 60, 100,and 140 mA⋅cm-2). The test results and errors are listed in Table 1. The formula used for estimating errors in current interruption is ±(0.3%+0.2%/ΔV) [15].The ohmic resistancesvs. current density at various temperatures are also presented in Fig. 5.
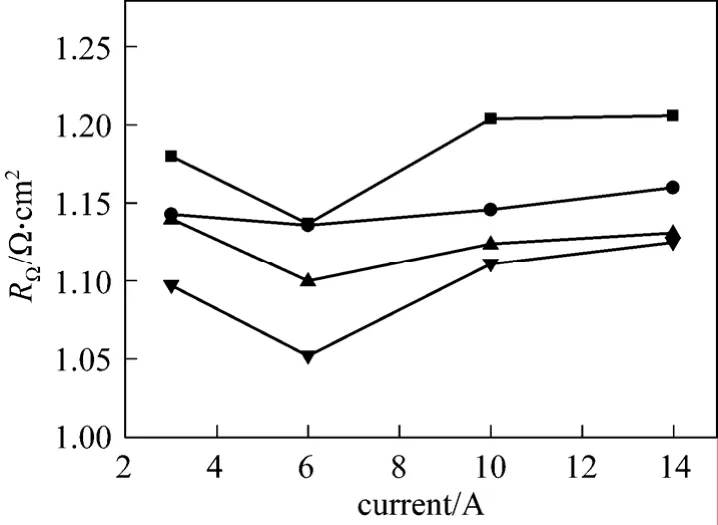
Figure 5 The ohmic resistance measured by current interruption method■ 25 °C; ● 40 °C; ▲ 60 °C; ▼ 80 °C
At a given current density, the ohmic resistance decreases initially when temperature increases. When the operating temperature increases further, the conduction rate of proton in electrolyte membrane is accelerated, increasing the electrical conductivity of membrane and reducing the internal resistance. The conduction rate of electrons in electrodes, current collectors and other components of DMFC are also increased. As a result, the total ohmic resistance decreases.
At a given temperature, when the current densityincreases, the cell ohmic resistance decreases first and then increases. However, in H2/O2proton exchange membrane fuel cell (PEMFC), the ohmic resistance increases steadily with increasing current density [7, 18].This is mainly due to the differences in anode fuels. In DMFC, the anode is supplied with aqueous methanol solution so that the membrane on the anode-side of the cell is never dehydrated. At low current density,enough water is produced at the cathode side of the membrane for hydration. The increase in membrane conductivity leads to a decrease in cell ohmic resistance. Above 60 mA⋅cm-2, higher current density generates more water at the cell cathode, increasing the contact resistances, so that the ohmic resistance increases. At large current density the cell cathode may even be flooded [19] and CO2bubbles may aggregate on the cell anode [20, 21].
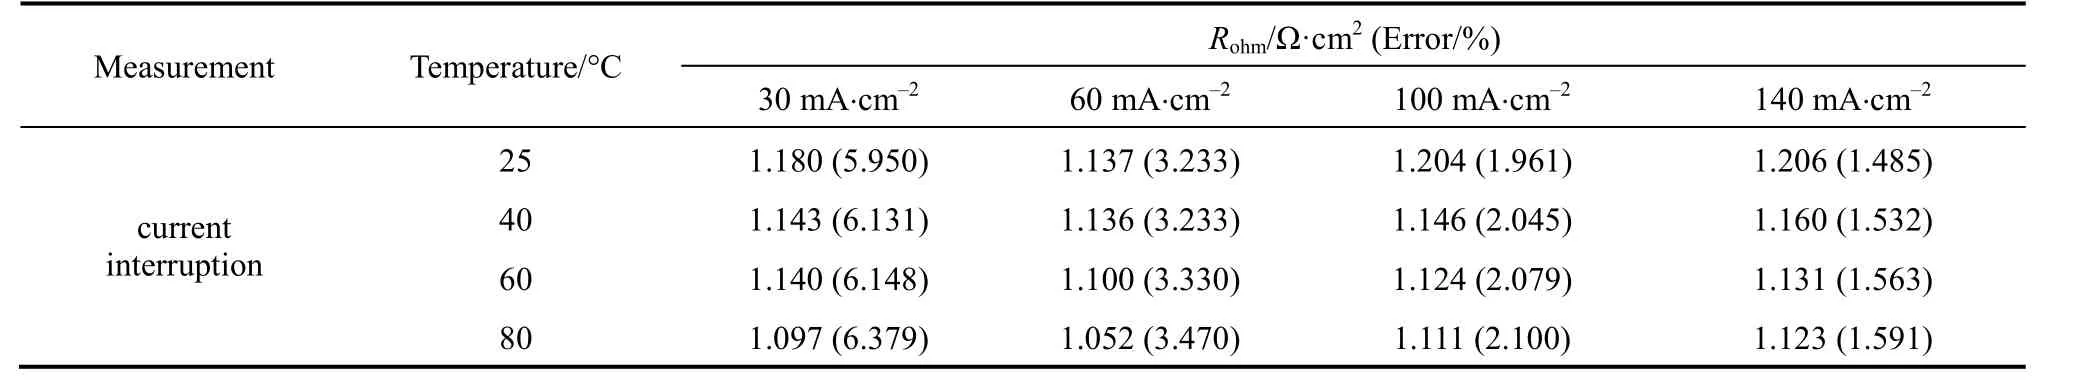
Table 1 Ohmic resistance measured at different temperatures and current densities with current interruption method
3.2 Electrochemical impedance spectroscopy (EIS)
In order to obtain accurate ohmic resistanceRΩ,equivalent circuit modelingL1R1[QR2(L2R3)] (Fig. 3)is adopted to simulate all parts of the cell [4, 22]. Fig. 6 presents the results of EIS test and equivalent circuit simulation of DMFC at 40 °C and current 14 A. The measured and simulated data coincide very well. The parameters of equivalent circuit and simulation errors are list in Table 2. All the simulation errors are within 10%, showing that the equivalent circuit model is appropriate for the cell. The ohmic resistance is given by the parameterR1in the equivalent circuit model.
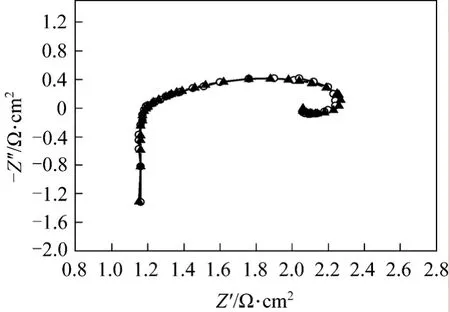
Figure 6 Modeling of faradaic impedance○ Z (Msd); ▲ Z (Calc)
Figure 7 presents the cell ohmic resistances at different temperatures (25, 40, 60, and 80 °C) and currentdensities (30, 60, 100, and 140 mA⋅cm-2) measured by EIS. Table 3 shows the data including estimated errors by the formula ±(3.5%+fitting error) [8]. At a given current density, the ohmic resistance decreases when the temperature increases. At a given temperature,when the current density increases, the cell ohmic resistance decreases to 6 A and then increases with current. The EIS measurements show the same behavior as seen from the current interruption data.
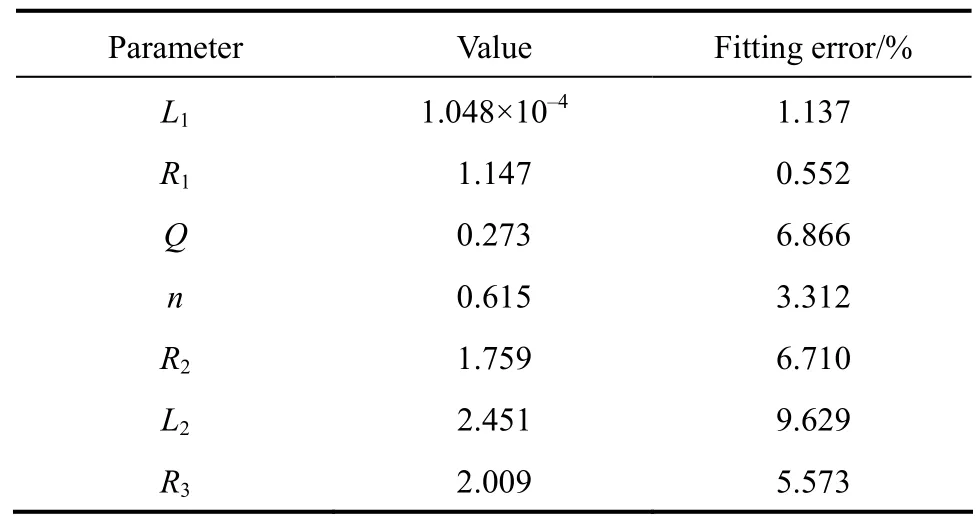
Table 2 Parameters and errors of the equivalent circuit
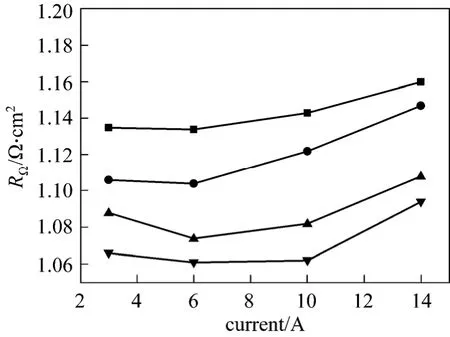
Figure 7 Ohmic resistance measured by EIS■ 25 °C; ● 40 °C; ▲ 60 °C; ▼ 80 °C
3.3 Comparison of data with current interruption and EIS
As shown in Tables 1 and 3, ohmic resistances measured by both methods are in the order of 1 Ω·cm2.The errors are mainly from the instrument. The errors in the ohmic resistance measured by EIS are similar,about 4%. As seen from Table 1, the errors in the ohmic resistance at low current density are large, up to 6.379%; as current density increases, the error decreasesto a minimum of 1.485%. The current interruption method works better at higher current densities.
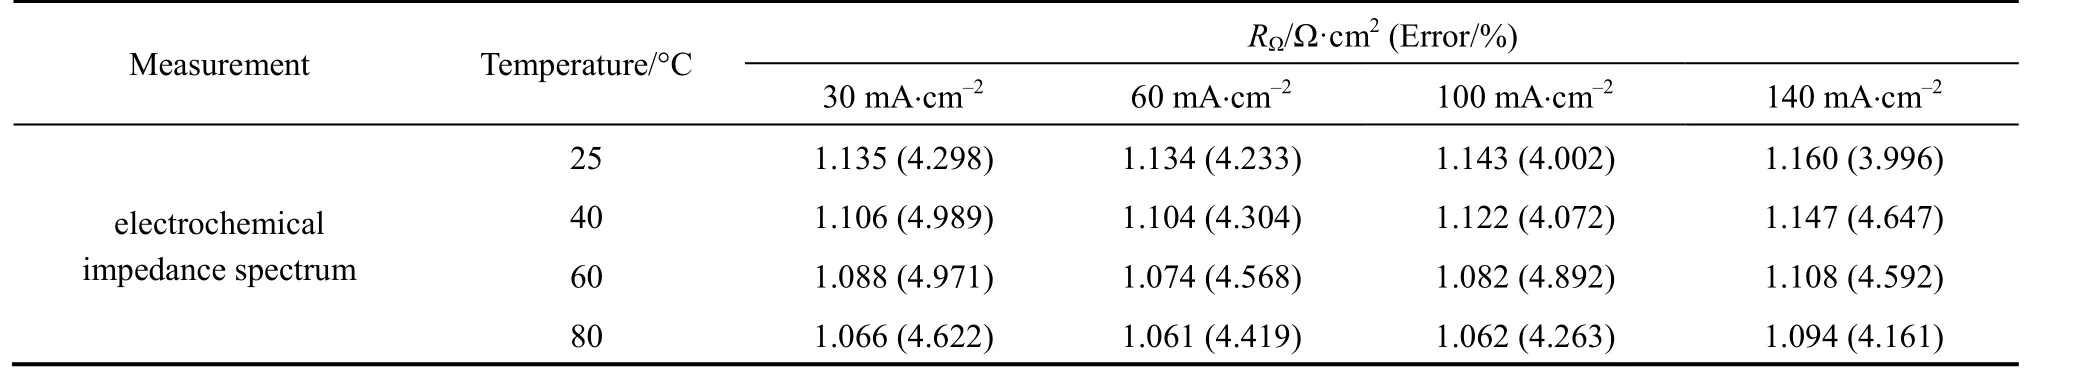
Table 3 Ohmic resistance measured at different temperatures and densities with EIS method
The formula (RiR-REIS)/REIS×100% is used to estimate the difference between the ohmic resistances obtained by current interruption and EIS techniques.The results are presented in Fig. 8. In most cases,RiR>REIS, but the differences between them are small,in the range from -0.848% to 5.337%.
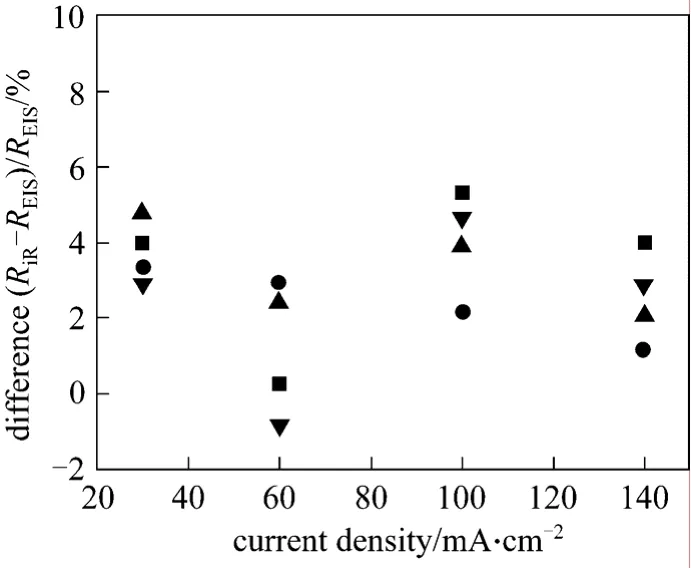
Figure 8 Normalized difference in DMFC ohmic resistance by current interruption and EIS methods■ 25 °C; ● 40 °C; ▲ 60 °C; ▼ 80 °C
4 CONCLUSIONS
The current interruption method was used to study the ohmic resistance of a DMFC. It was found that the value ofRΩdecreased with increasing temperature, andRΩdecreased and then increased with the increasing of current density. The errors inRΩmeasurements using the current interruption method were lower than those measured by the EIS technique at higher current densities. The advantages of current interruption method are short of testing time and ease of obtaining a single value without the use of an elaborate equivalent circuitry.
1 Xie, X.F., Fan, X.H., Fuel Cell Technology, Chemical Industry Press,Beijing, 1-5 (2004). (in Chinese).
2 Yi, B.L., Fuel Cells-Principle, Technology and Application, Chemical Industry Press, Beijing, 1-8 (2003). (in Chinese)
3 Rashidi, R., Dincer, I., Naterer, G.F., Berg, P., “Performance evaluation of direct methanol fuel cells for portable applications”,J.Power Sources, 187, 509-516 (2009).
4 Li, J.C., Xie, X.F., Guo, J.W., “Research of AC impedance of dynamic behavior of direct methanol fuel cell”,Chem.J.Chinese Universities, 29 (3), 564-568 (2008). (in Chinese)
5 Carmelo, B., Antonino, M., Giuseppe, T., “PEM fuel cell testing by electrochemical impedance spectroscopy”,Electric Power Systems Research, 79, 17-26 (2009).
6 Min, K.J., Jung, Y.W., Kwang, S., “Performance degradation study of a direct methanol fuel cell by electrochemical impedance spectroscopy”,Electrochimica Acta, 53, 447-452 (2007).
7 Lai, C.M., Lin, J.C., Hsueh, K.L., “On the electrochemical impedance spectroscopy of direct methanol fuel cell”,International Journal of Hydrogen Energy, 32, 4381-4388 (2007).
8 Cooper, K.R., Smith, M., “Electrical test methods for on-line fuel cell ohmic resistance measurement”,J.Power Sources, 160,1088-1095 (2006).
9 Buchi, F.N., Marek, A., Scherer, G.G., “In situmembrane resistance measurements in polymer electrolyte fuel cells by fast auxiliary current pulses”,J.Electrochem.Soc., 142 (6), 1895-1901 (1995).
10 Abe, T., Shima, H., Watanabe, K., “Study of PEFCs by AC impedance, current interrupt, and dew point measurements (I) Effect of humidity in oxygen gas”,J.Electrochem.Soc., 151 (1), A101-A105(2004).
11 Mennola, T., Mikkola, M., Noponen, M., Hottinen, T., Lund, P.,“Measurement of ohmic voltage losses in individual cells of a PEMFC stack”,J.PowerSources, 112, 261-272 (2002).
12 James, L., Fuel Cell Systems Explained, Science Press, Beijing,50-53 (2006). (in Chinese)
13 Renganathan, S., Guo, Q., Sethuraman, V.A., “Polymer electrolyte membrane resistance model”,J.Power Sources, 160, 386-397(2006).
14 Das, S.K., Berry, K.J., “Two-cell theory to measure membrane resistance based on proton flow: Theory development and experimental validation”,J.Power Sources, 173 (2), 909-916 (2007).
15 Mueller, J.T., Urban, P.M., “Characterization of direct methanol fuel cells by ac impedance spectroscopy”,J.PowerSources, 75, 139-143(1998).
16 Sugimoto, W., Aoyama, K., Kawaguchi, T., Murakami, Y., Takasu, Y.,“Kinetics of CH3OH oxidation on PtRu/C studied by impedance and CO stripping voltammetry”,J.Electroanalytical Chemistry, 576,215-221 (2005).
17 Liu, Y., Xie, X.F., Shang, Y.M., “Power characteristics and fluid transfer in 40 W direct methanol fuel cell stack”,J.PowerSources,164, 322-327 (2007).
18 Zhong, Z.Z., Chen, J.X., Peng, R.G., “Design and performance analysis of micro proton exchange membrane fuel cells”,Chin.J.Chem.Eng., 17 (2) 298-303 (2009).
19 Jung, G.B., Su, A., Tu, C.H., Lin, Y.T., Weng, F.B., Chan, S.H., “Effects of cathode flow fields on direct methanol fuel cell-simulation study”,J.Power Sources, 171, 212-217 (2007).
20 Liao, Q., Zhu, X., Zheng, X.Y., Ding, Y.D., “Visualization study on the dynamics of CO2bubbles in anode channels and performance of a DMFC”,J.Power Sources, 171, 644-651 (2007).
21 Yang, H., Zhao, T.S., Ye, Q., “In situvisualization study of CO2gas bubble behavior in DMFC anode flow fields”,J.Power Sources, 139,79-90 (2005).
22 Jin, B.D., Guo, J.W., Xie, X.F., “Effect of operating condition on cathodic EIS parameters in a DMFC”,Chem.J.Chinese Universities,29 (11), 2258-2261 (2008). (in Chinese)
猜你喜欢
长江蔬菜(2022年11期)2022-07-29
海外文摘·文学版(2022年4期)2022-04-14
抗癌之窗(2021年3期)2021-02-12
人物画报(2020年6期)2020-01-06
文学少年(原创儿童文学)(2019年2期)2019-05-23
中学生数理化·八年级数学人教版(2016年9期)2016-12-10
诗选刊(2015年4期)2015-10-26
小说月刊(2015年11期)2015-04-23
 Chinese Journal of Chemical Engineering2010年5期
- Chinese Journal of Chemical Engineering的其它文章
- Coupled Reaction/Distillation Process for Hydrolysis of Methyl Acetate*
- Caffeine Crystallization Induction Time Measurements Using Laser Scattering Technique and Correlation to Surface Tension in Water and Ethanol
- Synthesis of Petroleum Sulfonate Surfactant by Different Sulfonating Agent with Application of HIGEE Technology*