
The simulation of multiphase flow field in implantable blood pump and analysis of hemolytic capability*
2013-06-01 12:29LITieyan李铁岩YELiang叶亮
水动力学研究与进展 B辑 2013年4期
关键词:李铁
*LI Tie-yan (李铁岩), *YE Liang (叶亮)
Department of Cardiac Surgery, Shanghai East Hospital Affiliated to Tongji University, Shanghai 200120, China, E-mail: jolin.lty@163.com
HONG Fang-wen (洪方文), LIU Deng-cheng (刘登成)
China Ship Scientific Research Center, Wuxi 214082, China
FAN Hui-min (范慧敏), LIU Zhong-min (刘中民)
Department of Cardiac Surgery, Shanghai East Hospital Affiliated to Tongji University, Shanghai 200120, China
The simulation of multiphase flow field in implantable blood pump and analysis of hemolytic capability*
*LI Tie-yan (李铁岩), *YE Liang (叶亮)
Department of Cardiac Surgery, Shanghai East Hospital Affiliated to Tongji University, Shanghai 200120, China, E-mail: jolin.lty@163.com
HONG Fang-wen (洪方文), LIU Deng-cheng (刘登成)
China Ship Scientific Research Center, Wuxi 214082, China
FAN Hui-min (范慧敏), LIU Zhong-min (刘中民)
Department of Cardiac Surgery, Shanghai East Hospital Affiliated to Tongji University, Shanghai 200120, China
(Received May 6, 2013, Revised July 9, 2013)
The numerical simulation of the axial flow impeller blood pump NIVADIII is carried out by using a CFD multiphase flow model. The hydrodynamic performance of the pump and the flow field in the pump are analyzed, and the shear stress distribution is obtained. A hemolytic prediction model based on the shear stress is built based on the calculation results, and it can be used for quantitative predictions of the hemolytic behavior of a blood pump. Hemolysis tests in vitro were performed 6 times with fresh bovine blood. At each time, the flow of the pump NIVADIII is 5 L/min and the outflow tract pressure is 100 mmHg. According to the tests, the plasma free hemoglobin (FHB) content and the hematocrit (HCT) are measured after 0 s, 0.5 s, 1 s, 1.5 s, …4 s. At the end of each experiment Normal Index of Hemolysis (NIH) of NIVADIII is calculated. The average of NIH is 0.0055 g/100L, almost identical with that obtained from the hemolytic prediction model. This method can be applied in the selection stage of a blood pump.
blood pump, multiphase flow, numerical simulation, hemolytic
Introduction
Heart disease is currently one of the major diseases that endanger human life. About 1/5 of heart disease cases will eventually develop into the heart failure in the world each year[1]. The heart transplant operation has made a great progress, but the donor heart might be seriously deficient that restricts the applications of the technology in a large quantity. The ventricular assist device can effectively solve the problem[2]. It may partially or completely replace the natural heart to carry out the body blood circulation. Its core component is the blood pump[3]. More and more attention has been paid on the axial flow impeller pump, which has a small volume, a compact structure, and is suitable to work under large flow, low head conditions.
One of the main factors affecting the reliability of a heart pump is the blood pump hemolytic properties. Therefore, the evaluation of the hemolytic properties, especially, a quantitative evaluation, is of great significance to the design of heart pumps. The basic means to evaluate the heart pump hemolytic properties is by the hemolytic vitro test. The hemolytic properties of the blood pump are investigated by an extracorporeal blood circulating device[4]. The defects of a blood pump are determined by measuring the plasma free hemoglobin (FHB) and calculating the standard hemolytic index (Normalized Index of Hemolysis (NIH))[5]of the red blood cell hematocrit (HC)). The hemolytic test has a high reliability, butthe test cycle is long, involving repeated tests and a high cost. With the development of computer technology, Computational Fluid Dynamics (CFD) has been applied in the study of the cardiac pump, and the hydrodynamic performance and the internal flow field of a blood pump can be simulated[6]. The flow shear stress is an intrinsic factor related with the hemolytic properties, and it is shown that 100 Pa-150 Pa of the shear stress in the flow field can cause damages of red blood cells and then cause the hemolytic disease[7,8]. Therefore the quantitative assessment of the hemolytic properties can be performed by calculating the shear stress distribution.
The axial flow impeller blood pump NIVADIII has been developed and used in vitro hemolytic tests by Shanghai East Hospital Affiliated to Tongji University. The blood pump test and a single phase flow model were used by Fan and Hong to evaluate the hydrodynamic performance and its flow properties[9]. In this paper a criterion for hemolysis is built based on the shear stress extracted from the multi-phase flow simulation of the pump[10]. This method can be used to predict quantitatively the hemolytic potential of blood pumps and can be applied to the blood pump selection in its design stage.

Fig.1 2-D view of blood pump
1. Numerical simulation methods
1.1 Structure of blood pump
Figure 1 shows a schematic diagram of the blood pump, with a motor stator, a magnet motor, two impellers and outlet guide vane components. The small impeller marked by “5” has a small radius while the big impeller marked by “6” has a large radius. Rotating parts include the magnetic wheel (rotor), the small impeller and the big impeller. The magnet motor and the impeller are made into an integrative structure as a simple and compact structure. The gap between the magnet and the pump shell is 0.5 mm.
1.2 Calculation model
As shown in Fig.2, a working loop of the blood pump is constructed to simulate the flow field numerically[9]. The volume force is used to simulate the load to change the circuit characteristics and to reach various blood pump working points.
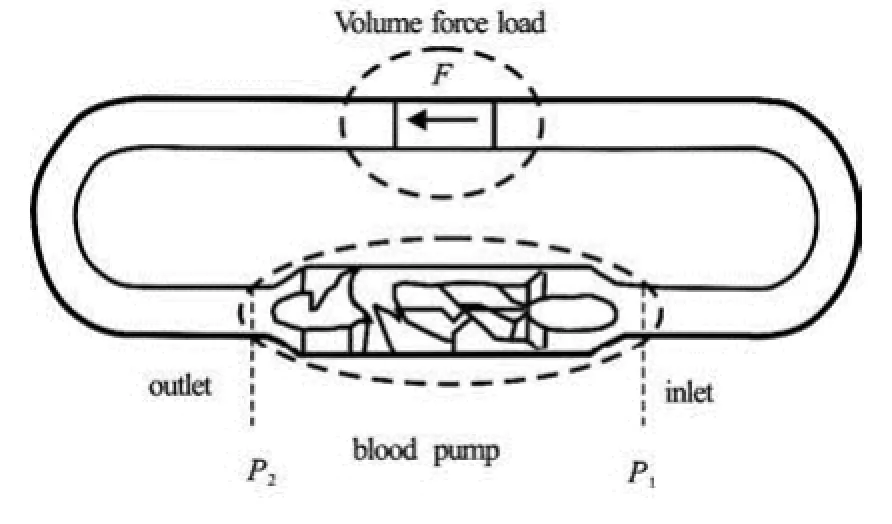
Fig.2 The blood pump model for numerical simulations
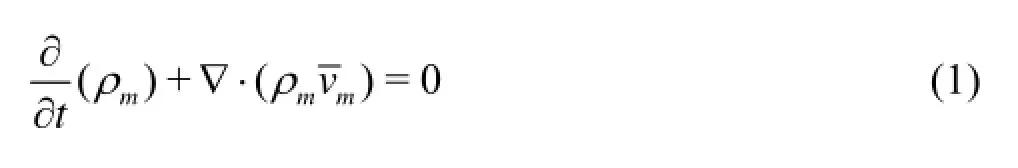
The plasma and the red blood cells are defined as two phases of fluid of different properties in a two phase flow model, and the main phase is the plasma. The mixture model is used to simulate this phenomenon. The continuity equation for the mixture is

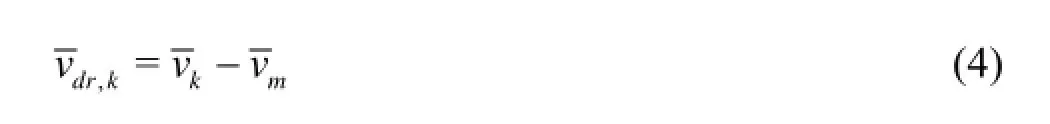
where ka is the volume fraction of phase k,kρ is the density of phase k,vkis the mass-averaged velocity of phase k.
The momentum equation for the mixture can be obtained by summing the individual momentum equations for all phases and be expressed as
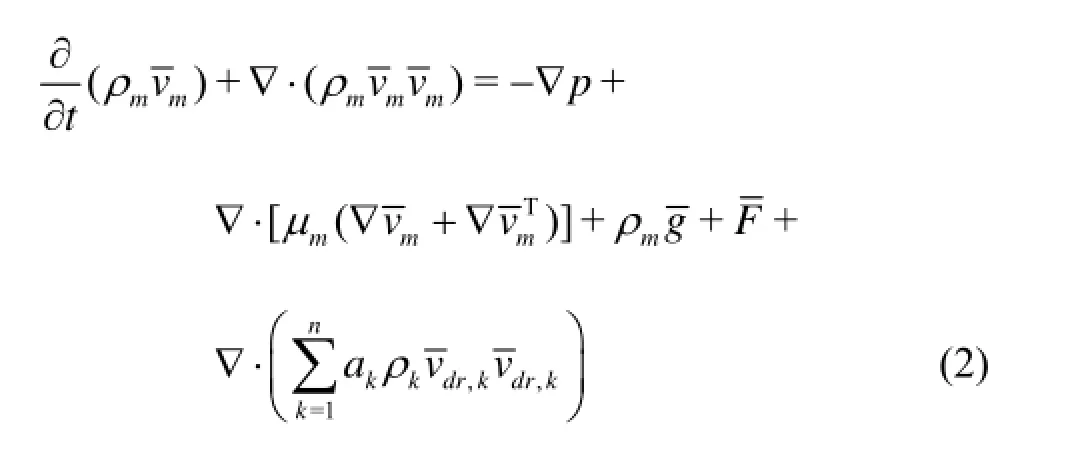
where n is the number of phases,F is a body force, andmμ is the viscosity of the mixture

The energy equation for the mixture takes the following form

whereeffk is the effective conductivitywheretk is the turbulent thermal conductivity, defined according to the turbulence model being used). The first term on the right-hand side of Eq.(5) represents the energy transfer due to conduction.ES includes any other volumetric heat sources.
In Eq.(5),
for a compressible phase, and Ek=hkfor an incomepressible phase, wherekh is the sensible enthalpy for phase k.
The block mesh technology is applied for the blood pump grid, the hexahedral mesh is used in the whole computational domain in order to obtain sufficient flow details to capture the shear stress in the regions of the blood pump guide vane and the wheel part. The Renolds-Average Navier-Stokes (RANS) equation is solved based on the finite volume method, with the SST kω- model as the turbulence model. Due to the closed loop flow field, the calculated region is defined without the inlet and outlet boundary conditions. The simulation of the runner part is carried out by a rotating coordinate system. By varying the volume force in the loop flow field, the blood pump operating points are reached.
2. Numerical simulation results and analyses
The plasma density is 1 030 kg/m3and the viscosity is 0.0016 kg/ms. For the red cells with a diameter of 7.7 μm, the density is 1 090 kg/m3, the viscosity is 0.008 kg/ms. The rotational speed of the rotating impeller is 8 000 r/min. Different working conditions for different plasma, load and red cell proportions are compared by using parallel computing. The results of the simulation are analyzed, in order to facilitate the representation of the results for the blood pump, with the axis of the blood pump as the -xaxis, positive in the flow direction in the same plane, and the plane of the blood pump circuit as the -xz plane.
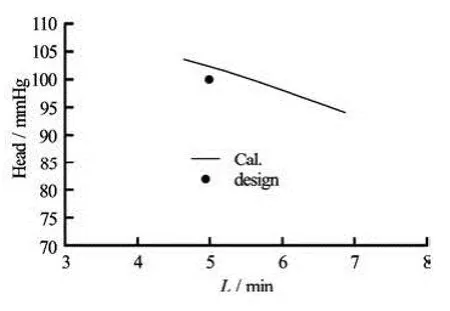
Fig.3 Hydrodynamic performance curve of the blood pump
2.1 Hydrodynamic performance
The different volume force loads in the blood pump circuit are simulated to obtain the blood pump hydrodynamic performance curve. The volume forces are 50 000 N/m3, 57 000 N/m3, 60 000 N/m3, the blood plasma accounts for 65% of the overall blood, and the red blood cells account for 35%. Figure 3 shows the calculated hydrodynamic performance curve, and also shows the design operating point (the flow rate is 5 L/min and the head is 100 mmHg). It can be seen from that figure that the calculated hydrodynamic performance of the blood pump basically meets the design conditions. It is shown that the flow rate is 5 L/min corresponding to the head of 102.24 mmHg based on the curve fitted results of the numerical simulation. The force load should be 58 700 N/m3according to the numerical simulation.
In order to analyze the relation between the blood pump performance and the blood components, the plasma with the overall proportion of 70%, 65% and 60% is assumed, respectively, for the volume force load of 58 700 N/m3, and the three calculated results of the blood pump hydrodynamic performance are listed in Table 1. It can be seen that the blood components affect the hydrodynamics performance of the blood pump very little.

Table 1 The blood pump hydrodynamic performance for
2.2 Flow field characteristics
According to the above results, the velocity distribution and the pressure distribution in the internal flow field of the blood pump can be analyzed under the conditions of the volume force load of 58 700 N/m3and the plasma ratio of 65%.

Fig.4 Velocity distribution in axial flow field
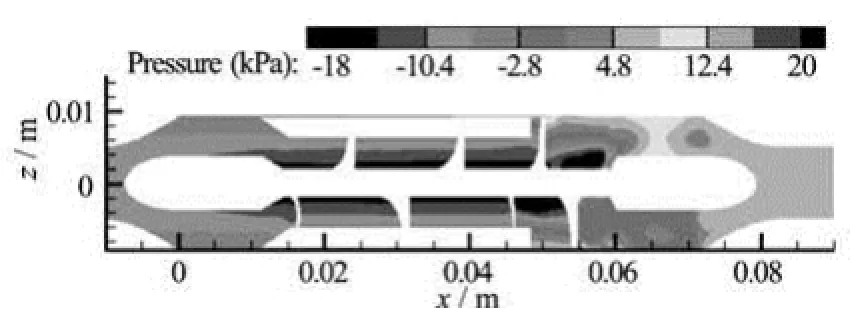
Fig.5 Pressure distribution in the axial surface of the flow field
Figures 4 and 5 show the flow velocity distribution and the pressure distribution in the axial plane of the blood pump. From these figures it can be seen that the velocity is stable in the part from the impeller inlet to the small wheel of the blood region and the pressure distribution is relatively regular. But the flow field shows some disordered features and the pressure distribution has relatively large variations in the large wheel region and the outlet guide vane area.
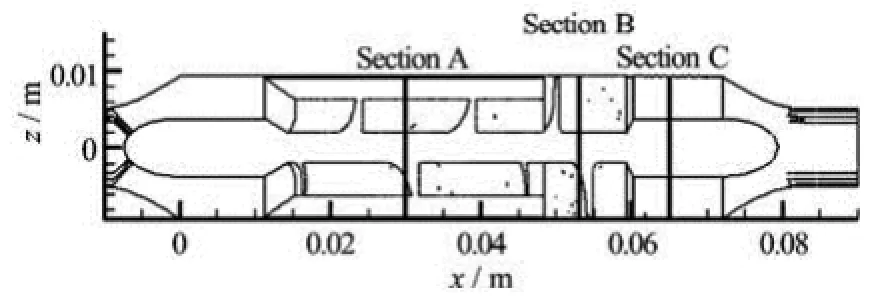
Fig.6 The cross section locations
The characteristics of the flow fields in the small impeller region, the big impeller region and the outlet guide vane area are analyzed by taking the cross-sectional views. Figure 6 shows the three cross section locations. Figures 7-9 show the axial velocity and pressure distributions in the cross sections in the small impeller region, the big impeller region and the outlet guide vane area, respectively. From Fig.7, it can be seen that the axial velocity varies little in the small impeller region, the pressure distribution in the circumferential direction varies relatively little, and the isobar is in an annular shape, with a radial variation. This kind of flow field means a poor performance with respect to the blood hemolysis. From Fig.7, it can be seen that the flow direction in the small narrow gap between the motor stator and the magnetic wheel is opposite to the mainstream direction in the pump. The scouring effect will help avoiding the adverse effect due to the flow stagnation of blood. The large flow field in the big impeller region sees more chaos, the velocity ranging from 5.5 m/s to 3 m/s, with a reflux in the blade root hub. The flow field in this region shows a poor quality and the variations of velocity and pressure are relatively large.

Fig.7 The flow field distribution on the cross section of the small impeller region
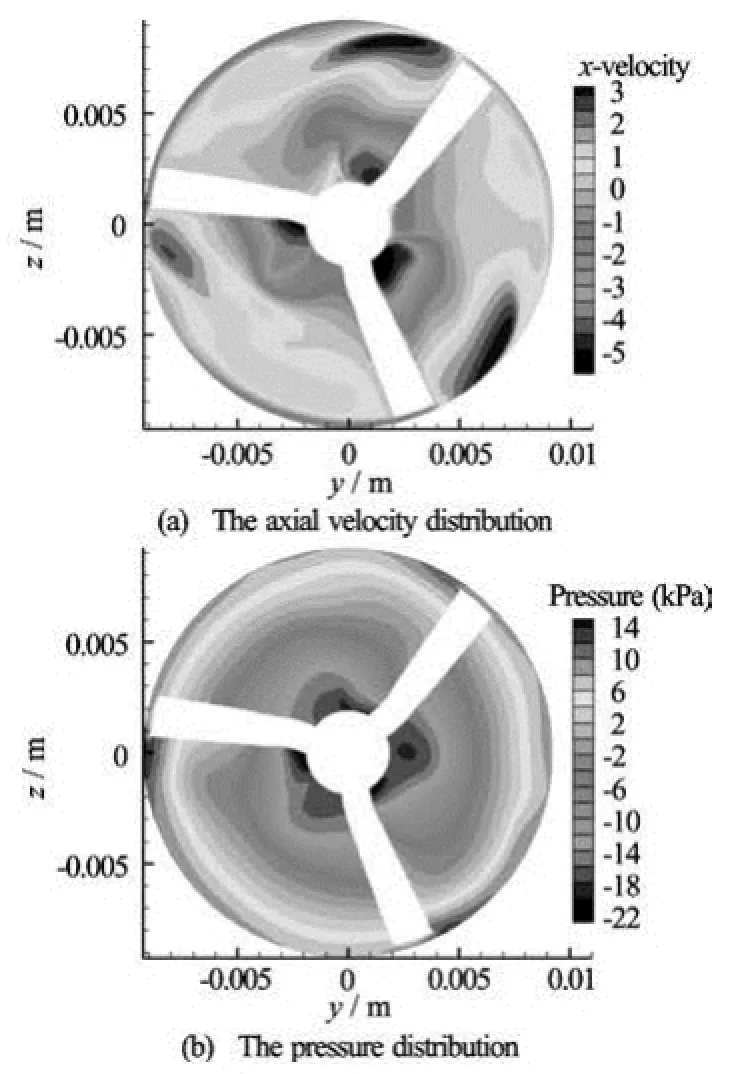
Fig.8 The flow field distribution on the cross section of the big impeller region
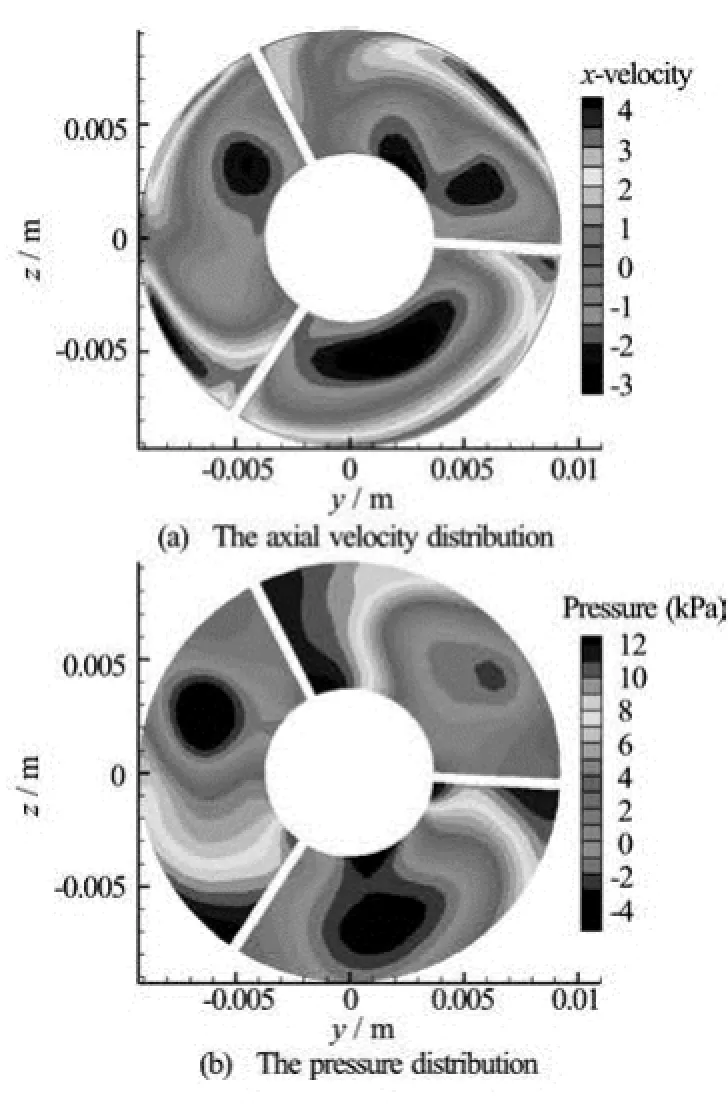
Fig.9 The flow field distribution on the cross section in the outlet guide vane region
2.3 Flow shear stress
The shear stress generated during the blood flow in the blood pump is the main source of hemolytic effects, which can damage red blood cells. The shear stress is induced by the physical viscosity and the turbulent flow. In the numerical simulations, the effect of the turbulence is expressed by the turbulent viscosity. Bludszuweit[11]proposed an equivalent stress method to express the flow shear stress, with the following expressions:

where,ijσ is the physical viscous stress,,ijs is the turbulent stress, μ is the fluid physical viscosity, ρ is the fluid density, k is the turbulent kinetic energy, tμ is the turbulent viscosity, andiu is the velocity component.
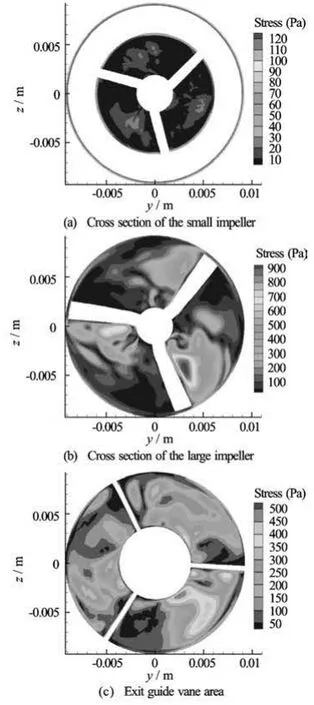
Fig.10 Shear stress distribution of the flow field in the cross section
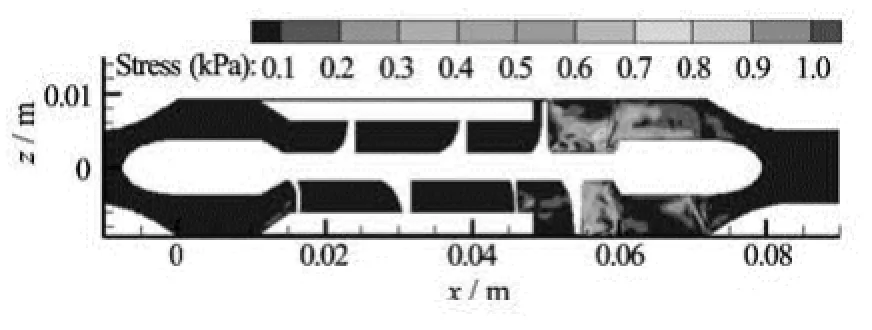
Fig.11 Shear stress distribution of the flow field in the axial plane
The rates of the derivatives of the turbulent viscosity and the turbulent kinetic energy and other related quantities are extracted from the calculation results. The flow shear stress is calculated with Eqs.(7)-(10). Figures 10 and 11 show the flow shear stress distribution nephograms obtained by using the calculated results in the cross section plane and the axial plane, re-spectively. From Fig.10, it can be seen that the maximum value of the flow shear stress is located near the central flow region of the foliage, where there is a large shear stress concentration. A large shear stress in the outlet guide vane is distributed in a broad region. The shear stress in the cross section of the small slit is large, but smaller than that in the large impeller region and the outlet guide vane area. From Fig.11, it can be seen clearly that the large shear stress appears in a large areas of the impeller region and the outlet guide vane area.
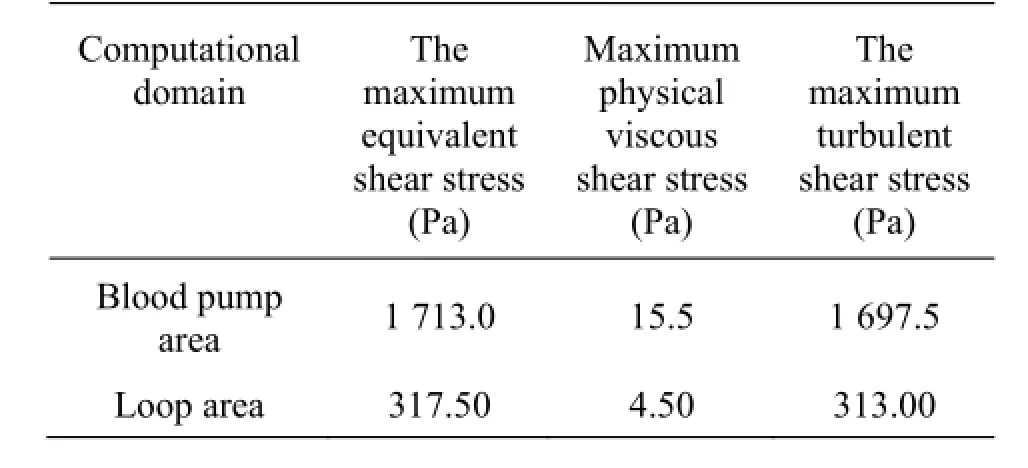
Table 2 The maximum shear stress
Table 2 lists the maximum equivalent shear stress, the maximum physical viscous shear stress and the maximum turbulent shear stress in the blood pump area and the loop regions. It can be seen that the maximum equivalent stress in the blood pump region reaches 1 713 Pa, the maximum equivalent stress in the loop region is small, only 317.5 Pa. The shear stress over 400 Pa in the blood pump area is analyzed in details. It is shown that the turbulent shear stress takes a portion of 95.7% and the viscous shear stress takes only 4.3% of portion, which indicates that the turbulence flow is the main source to generate the shear stress. That is why the maximum equivalent stress in the blood pump region is much greater than in the loop area. The flow field is complex and the turbulence is significant in the blood pump region due to the fact that the flow field is disturbed by the runner and the stator[12]. So during the design stage of the blood pump, attention should be paid to improve the flow quality, reduce the turbulence intensity, and improve the hemolytic properties of the blood pump[13].
3. An analysis of the hemolytic properties
The standard hemolytic index NIH is genera used to measure the hemolytic properties of a blo pump. It represents the increased FHB number of t blood hemoglobin after the standardized 100 L hem tocrit being pumped by the blood pump in a unit tim The calculation formula is as follows lly od he a-e.

where FHBΔ is the incremental value of FHB in the test time interval, Q is the volume flow rate of the blood pump, t is the test interval, V is the total volume of the circulating blood, and Hct is the press volume of the hematocrit.
In a physical test of the hemolysis, the NIH could be calculated through the above formula using the values of FHB and Hct measured in different time periods.
This paper proposes a numerical method of calculating NIH based on the CFD method, which could be used for the numerical prediction of the hemolytic performance of the blood pump.
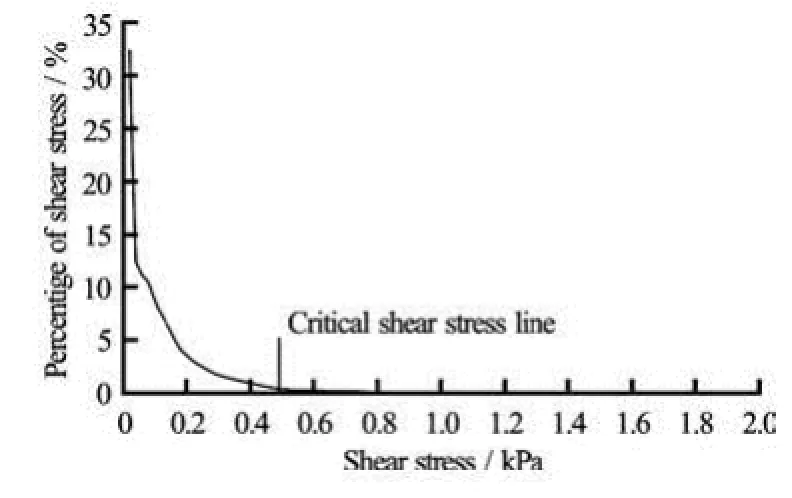
Fig.12 The shear stress distribution curve of the blood pump
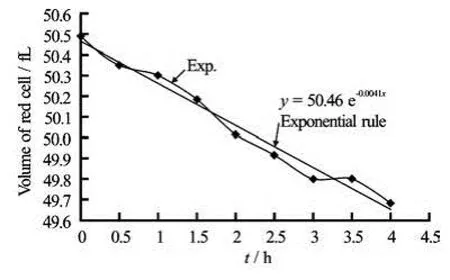
Fig.13 The variation curves of red cells
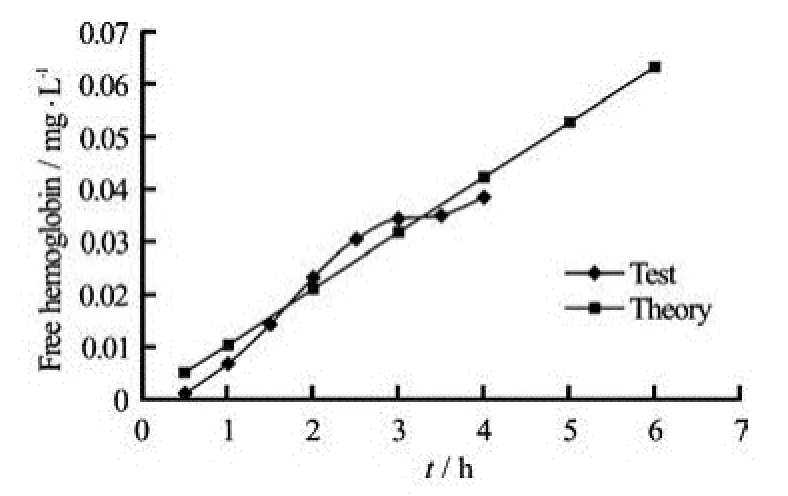
Fig.14 The variation curves of free hemoglobins
From the above analysis, the blood pump performance is not affected by different blood components. Thereby it can be assumed that the damage rate of the red blood cells due to the flow shear stress is constant. The red cell decay equation can be expressed as follows
Its integration gives:

where0V is the volume of the red blood cells at the initial time, and t is measured in hours. It is an exponential relationship.

Table 3 The predicted results of hemolysis
Figure 12 shows the distribution curve of the shear stress crτ in the blood pump region and the critical shear stresscrτ line. In Fig.12, the region surrounded by the shear distribution curve, the critical shear stress line and the coordinate axis is the region where the red cells can be destabilized.
The percent of the hemolytic volume of the damaged red cells during the blood pump running processes can be calculated by integrating the volume percentage. Usually,crτ is estimated as 480 Pa from our experements. The percentage of the hemolytic volume of the damaged red blood cells, obtained from the shear stress distribution curve of the blood pump, is 0.41%. Figure 13 shows a curve of the blood hemolysis of the red blood cells versus time in the vitro test, which is compared with the simulation results. A good agreement is seen.
It can be assumed that the hematocrit reduction rate and the red blood cell damage reduction speed are consistent, then HctΔ of the hematocrit variation can be expressed as follows
where 0Hct is the initial value of the hematocrit of the red cells.
Assume that the relation between the increased free hemoglobin and the hematocrit is linear, then the calculation formula of FHBΔ of the volume of the increased free hemoglobin can be expressed as
where Mch is the average hemoglobin concentration,
2 k is the ratio of the number of damaged red blood cells to that of the free hemoglobins obtained from the plasma.
Mch depends on the nature of the blood, with a value of 316.5 g/L. 2k is equal to 0.035 (depending on the result of the vitro hemolysis test). It can be obtained from the free hemoglobins in different periods by Eq.(15). Figure 14 shows the curve of the free hemoglobin, and it is indicated that the free hemoglobin predictive values are in good agreement with the experimental results.
For a given study objective, Q, T and V are known quantities. Hct is related to the blood nature, normally expressed in the average value. FHBΔ can be obtained by Eq.(15), as the normalized index of the hemolytic NIH according to Eq.(11).
The results of the normalized index of the hemolytic NIH predicted by the numerical simulation results of the blood pump are listed in Table 3.
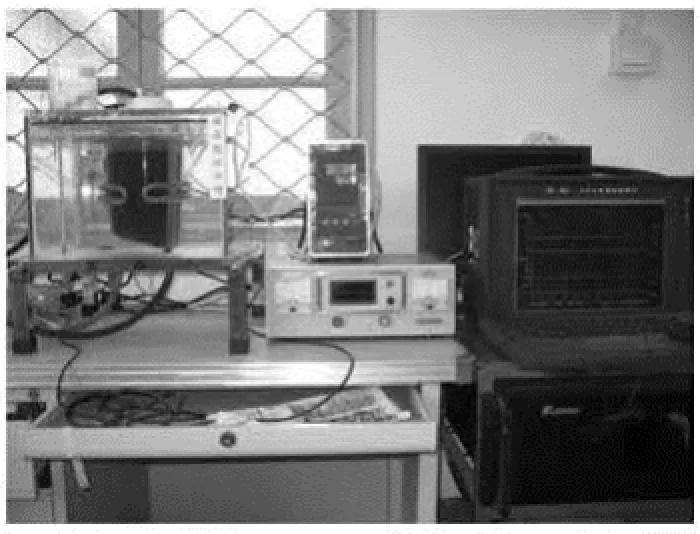
Fig.15 The experimental system of hemolysis in vitro
From the above discussions, it can be seen that the numerical simulation can be used to obtain the red cell decay rate, and the final accuracy of the calculation results depends on the accurate determination ofτ and2k. Therefore, the accumulation of experience
cr and data through large number of tests is required to establish the accurate prediction model of the hemolytic index.
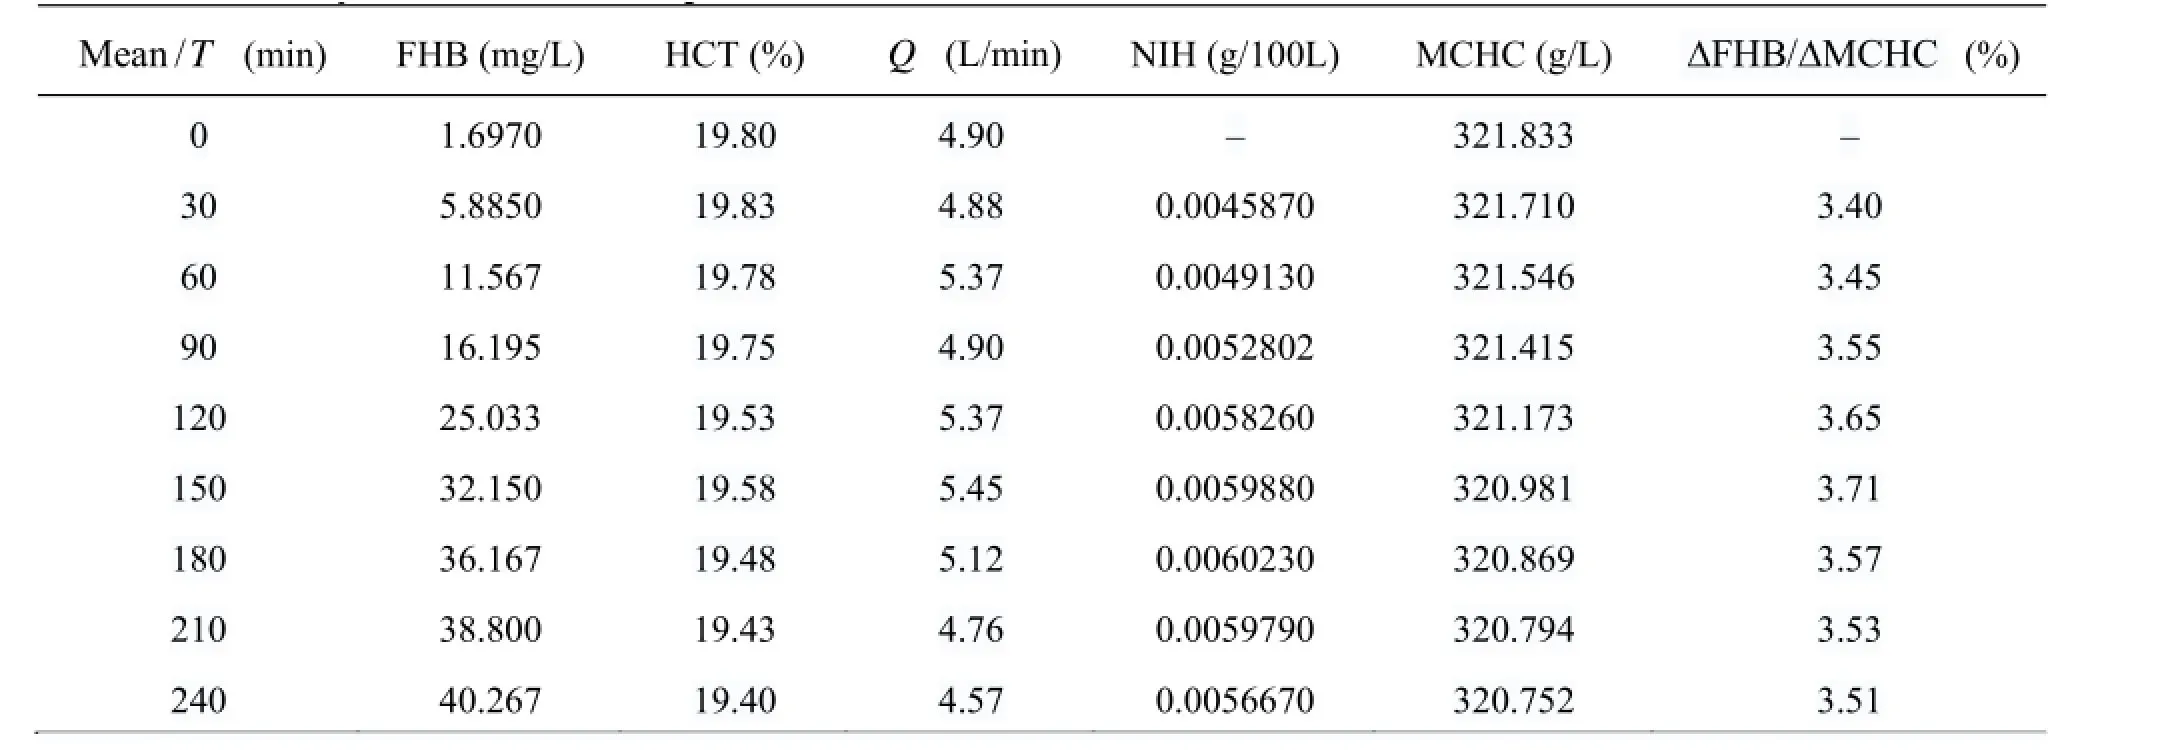
Table 4 The hemolysis results in vitro experiment
4. In vitro hemolysis experiments
4.1 Principle of experiment
The body’s blood circulation system is very complex, and in this experiment, the major factors, such as the compliance of the heart, the vascular resistance characteristics should be considered while other secondary factors are ignored. The circulatory system of the human body is reduced to a ventricular → arteries→ vein → atrial → ventricule model[14]. The hemolysis experiments in vitro mainly concern the damage of red blood cells by the shear stress of the blood pump, so the simplification of the model is reasonable. Moreover, with the use of the experimental method of the model, the blood flow and the pressure can be controlled, so that the experiment is easy to conduct.
4.2 Experiment device designed and produced by us[15], and shown in Fig.15.
The hemolysis experimental system in vitro is The blood storage is the medical 2000 ml blood storage (Fly FLR-2000K), circulating in the heated state with the outside water bath tank, with the medical silicone rubber tubes as the connecting pipes. An implantable ventricular assistance device NIVADIII, developed by our research group, is used, followed by an integrated detector for the flow and the pressure, connected by a damper valve to control the pressure in the outlet of the pump. The entrance surface temperature outside of the blood pump is measured by a portable surface thermometer (Drrcom JXB-178). NIVADIII is controlled by an artificial heart monitor of our independent development.
4.3 Method with the experimental system. In each experiment[15],
Six vitro hemolysis experiments were carried out the experimental system is first rinsed for 10 min-20 min with 0.9% saline wet, in ambient pressure and with the flow detectors being turned to their initial zero value. Then, the fresh bovine blood 2 000 ml, with 3.8% 1:9 sodium citrate anticoagulant, is loaded, the circulation circuit is connected and the air is exhausted to reduce the influence of the erythrocyte destruction and the bubble pressure flow detector due to the bubble generation and the pump operation. The temperature of the water bath is controlled at 37±1oC by the thermostat, the damping valve and the blood pump speed pump output are adjusted to a state that the flow is around 5L/min and the outflow tract pressure is 100 mmHg. Every time, samples are taken before and after the transfer pump. The plasma FHB content and the hematocrit (HCT) are measured after 0 h, 0.5 h, 1 h, 1.5 h, …, 4 h and, at the end of each experiment, the mean is calculated, leaving the same fresh bovine blood as a control group. When plasma samples are taken every time, dimethyl-benzidine (2 g/L), 1% H2O2and 10% Acetic acid are added. At the same time, one sample without plasma is taken as the blank sample. After these, the spectrophotometer at 530 nm wavelength is used to detect the absorbance of the samples relative to the blank sample, then FHB is calculated.
4.4 Results
The levels of the plasma FHB are obtained to reflect the destruction of red blood cells in 6 hemolysis tests. The standard index of hemolysis (NIH) is usedas the blood pump blood damage measure. It represents the value of FHB (g/100L) of the blood pump to pump out 100L of blood in a unit time, expressed as
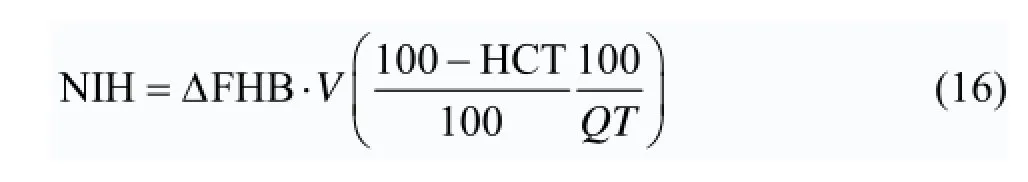
where FHBΔ is the test interval increment value, V, the total cycle amount, Hct, the hematocrit portion, Q, the pump flow, T, the test interval. The experimental results are listed in Table 4.
From the vitro hemolysis test results, one can see that the FHB is in increase and the MCHC goes down within the same time interval due to the damage of red blood cells in the blood pump. The average ratio of the FHB to the hemoglobin into plasma by damage of red blood cells can be deduced by 3.54% for the same interval according to the change of FHB/MCHC ΔΔ. Therefore,2k in Eq.(15) is taken as 0.035. The average NIH of the NIVADIII is 0.005533 g/100L from the NIH results. It is indicated that the NIVADIII hemolytic performance can meet basically the clinical requirements as compared with the third-generation blood pump, now in clinical applications. The Berlin Heart Incor NIH is 0.006 g/100L[16], and generally the hemolysis of an axial blood pump requires a NIH range of 0.001 g/100L -0.1 g/100L according to the related literature[17-20]. So the NIVADIII hemolysis value fulfils the requirement basically.
The results of in vitro hemolysis experiments as compared with the predicted hemolytic results by the CFD are shown in Fig.16.
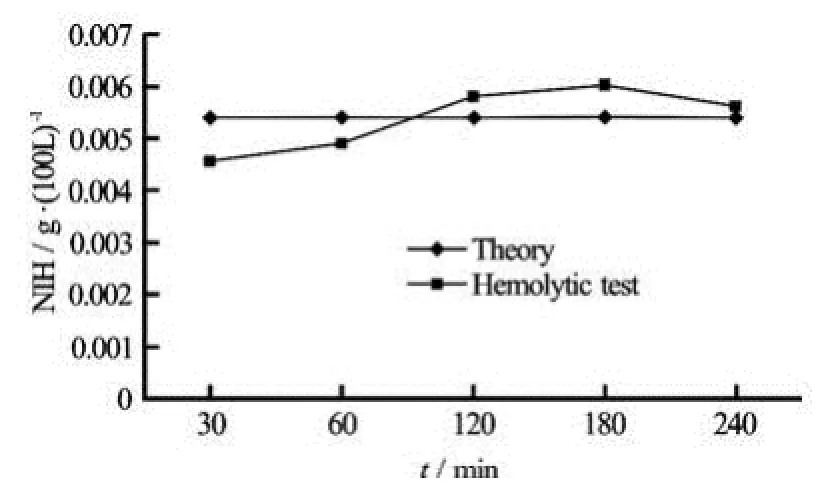
Fig.16 Comparison of calculated and experimental NIH results
From the figure, we can see that the flow field of the hemolytic numerical simulation by CFD agrees well with the experimental results. Therefore, the CFD simulation method can be applied to assess the hemolytic performance in the selection and design stages of the pump body to shorten the development cycle. The assessment of the hemolysis by CFD can improve its accuracy with the feedback and the experience accumulated by the experimental data.
4.5 Discussion: The role of the coefficients1k
In section 2.3 (flow shear stress), it is shown that the shear stress is the major factor in the destruction of red blood cells in a blood pump. The destruction of red blood cells in the blood pump decays in an exponential manner, ie., as expressed by Eq.(14). So this coefficient1k is a critical parameter, and a large1k means a quick blood hematocrit attenuation and a poor hemolytic performance. From Eqs.(14) through (16), the standard hemolysis index NIH value is directly related to the1k coefficient. A larger1k means a larger NIH value and a poorer hemolytic activity of the blood pump, on the other hand, a smaller k value means a smaller NIH value and a better he-
1 molysis performance of the blood pump. So the coefficient1k is an indicator to measure the performance of the blood pump hemolysis. The numerical prediction of the NIH is in good agreement with hemolysis test results in this paper. Based on Fig.13, the blood hematocrit attenuation factors1k predicted by CFD is relatively close to the blood hematocrit ratio coefficient 1k by decay exponential curve based on hemolysis tests. Therefore, data prediction accuracy of 1k can reflect the numerical forecast accuracy of NIH, equivalent to the prediction precision of hemolytic properties. On the other hand, if we can determine a critical value or range of NIH based on the hemolysis test, then it is easy to calculate the critical1k values from Eqs.(14), (15) and (16). In the preliminary design stage of the blood pump, we can calculate the corresponding1k of the blood pump and compare it with the critical value of1k. If the value of1k is less than the critical value of1k, the design of the blood pump hemolysis is valid. Conversely, if the1k is greater than the critical value of1k, the hemolytic properties of this design of the blood pump are not satisfactory, and the blood pump needs to be redesigned.
5. Conclusions
(1) The volume load can be used to predict the change of the blood pump hydrodynamic performance based on the CFD numerical simulation method. Numerical simulation results agree well with the theoretical results.
(2) The shear stress distribution in the blood pump is extracted from the blood pump flow by User Defined Function (UDF), which is used to evaluate the hemolytic properties. According to the distribution of the shear stress, an improved measurement procedure is proposed for the blood pump flow properties.
(3) A qualitative model is established to assess the blood pump hemolytic properties based on the CFD simulation results. This model can be applied to the blood pump selection and design stages if increased experiences are accumulated on the model.
(4) A simple method is proposed for the prediction and evaluation of the blood pump hemolysis performance based on the numerical prediction of attenuation coefficient1k using the two-phase flow CFD method and an exponential decay model of the blood volume ratio of a running blood pump in this paper.
Acknowledgement
The authors thank Prof. Zhou Lian-di of CSSRC for providing the comments.
[1] KWON M. H., MORIGUCHI J. D. and ARDEHALI A. et al. Use of ventricular assist device as a bridge to cardiac transplantation: Impact of age and other determinants on outcomes[J].. Texas Heart Institute Journal, 2009, 36(3): 214-219.
[2] HALLAS C., BANNER N. R. and WRAY J. A qualitative study of the psychological experience of patients during and after mechanical cardiac support[J]. Journal of Cardiovascular Nursing, 2009, 24(1): 31-39.
[3] ZHU X., ZHANG M. and ZHANG G. et al. Numerical investigation on hydrodynamics and biocompatibility of a magnetically suspended axial blood pump[J]. ASAIO Journal, 2006, 40(11): 1290-1294.
[4] WANG Yun-xuan, ZHANG Jie-min and SHI Chao et al. Hemolysis test about a self-made miniature implantable axial flow blood pump in vitro and in vivo[J]. Journal of Shanxi Medical University, 2010, 41(2): 133-136(in Chinese).
[5] CHOI H., PAIK S. H. and LEE K. H. et al. Durability improvement of polymer chamber of pulsatile extracorporeal life support system in terms of mechanical change[J]. Medical and Biological Engineering Computing, 2007, 45(11): 1127-1135.
[6] YANO T, SEKINE K. and MITOH A. et al. An estimation method of hemolysis within an axial flow blood pump by computational fluid dynamics[J]. Artifical Organs, 2003, 27(10): 920-925.
[7] PARFITT H. S., DAVIES S. V. and TIGHE P. et al. Red cell damage after pumping by two infusion control devices (Arcomed VP 7000 and IVAC 572)[J]. Transfusion Medicine, 2007, 20(4): 290-295.
[8] FRASER K. H., ZHANG T. and TASKIN M. E. et al. A quantitative comparison of mechanical blood damage parameters in rotary ventricular assist devices: Shear stress, exposure time and hemolysis index[J]. Journal of Biomechanical Engineering, 2012, 134(8): 081002.
[9] FAN Hui-min, HONG Fang-wen and ZHANG Guoping et al. Applications of CFD technique in the design and flow analysis of implantable axial flow blood pump[J]. Journal of Hydrodynamics, 2010, 22(4): 518-525.
[10] SONG X., THROCKMORTON A. L. and WOOD H. G. et al. Computational fluid dynamics prediction of blood damage in a centrifugal pump[J]. Artifical Organs, 2003, 27(10): 938-941.
[11] BLUDSZUWEIT C. Model for a general mechanical blood damage prediction[J]. Artifical Organs, 1995, 19(7): 583-589.
[12] TETSUYA Y., KAZUMITSU S. An estimation method of hemolysis within an axial flow blood pump by computational fluid dynamics analysis[J]. Artifical Organs, 2003, 27(10): 920-925.
[13] SOWEMIMO-COKER S. O. Red blood cell hemolysis during processing[J]. Transfusion Medicine Review, 2002, 16(1): 46-60.
[14] JAHANMIR S., HUNSBERGER A. Z. and HESHMAT H. et al. Performance characterization of a rotary centrifugal left ventricular assist device with magnetic suspe- nsion[J]. Artifical Organs, 2008, 32(5): 366-375.
[15] LI Tei-yan, YE Liang and ZHANG Zhi-guo et al. The hemolysis research of the national implantable ventricular assist device[J]. Journal of Tongji University (Me- dical Science), 2011, 32(2): 47-50(in Chinese).
[16] SONG X., THROCKMORTON A. L. and UNITAROIU A. et al. Axial flow blood pumps[J]. ASAIO Journal, 2003, 49(4): 355-364.
[17] HOSHI H., SHINSHI T. and TAKATANI S. Third generation blood pumps with mechanical non-contact magnetic bearing[J]. Artifical Organs, 2006, 30(5): 324-339.
[18] NOJIRI C., KIJIMA T. and MAEKAWA J. Development status of Terumo implantable left ventricular assist system[J]. Artifical Organs, 2001, 25(5): 411-413.
[19] ASAMA J., SHINSHI T. and HOSHI H. et al. A compact highly efficient and low hemolytic centrifugal blood pump with a magnetically levitated impeller[J]. Artifical Organs, 2006, 30(3): 160-167.
[20] ZHANG J., GELLMAN B. and KOERT A. et al. Computational and experimental evaluation of the fluid dynamics and hemocompatibility of the CentriMag blood pump[J]. Artifical Organs, 2006, 30(3): 168-177.
10.1016/S1001-6058(11)60402-3
* Project supported by the National High Technology Research and Development Program of China (863 Program, Grant No. 2007AA02Z439), The Key Disciplines Group Construction Project of Pudong Health Bureau of Shanghai (Grant No. PKzxkq2010-01) and the Outstanding Leaders Training Program of Pudong Health Bureau of Shanghai (Grant No. PKR2011-01).
* These authors contributed equally to this work.
Biography: LI Tie-yan (1984-), Ph. D., M. D.
LIU Zhong-min, E-mail: Liu.zhongmin@tongji.edu.cn
猜你喜欢
音乐天地(音乐创作版)(2022年5期)2022-10-14
民间故事选刊(2022年11期)2022-07-27
民间故事选刊·上(2022年6期)2022-06-14
汽车实用技术(2022年4期)2022-03-07
作物学报(2022年3期)2022-01-22
女子世界(2017年5期)2017-05-12
喜剧世界(2016年14期)2016-11-26
今古传奇·故事版(2016年18期)2016-10-26
意林·少年版(2014年3期)2014-03-17
足球周刊(2014年2期)2014-03-03

- 水动力学研究与进展 B辑的其它文章
- Ship bow waves*
- Progress in numerical simulation of cavitating water jets*
- Three-dimensional large eddy simulation and vorticity analysis of unsteady cavitating flow around a twisted hydrofoil*
- Numerical simulation of shallow-water flooding using a two-dimensional finite volume model*
- Dynamical analysis of high-pressure supercritical carbon dioxide jet in well drilling*
- Micropaticle transport and deposition from electrokinetic microflow in a 90obend*