群落水平食物网能流季节演替特征
2013-12-08 07:43温周瑞
生态学报 2013年15期
徐 军,周 琼,温周瑞,谢 平
(1.中国科学院水生生物研究所,武汉 430072; 2.华中农业大学水产学院, 武汉 430070;3. 湖北省水产科学研究所, 武汉 430071)
群落水平食物网能流季节演替特征
徐 军1,*,周 琼2,温周瑞3,谢 平1
(1.中国科学院水生生物研究所,武汉 430072; 2.华中农业大学水产学院, 武汉 430070;3. 湖北省水产科学研究所, 武汉 430071)
稳定碳、氮同位素比值分析技术是研究生态系统中物质循环与能量流动的有效技术。δ13C可以用来判断食物网中不同生物的能量来源;δ15N主要用于确定生物在食物网中所处的营养位置。通常用δ13C—δ15N图来表征某一特定时间或空间的食物网结构,但是这种方法在比较不同时间和空间食物网结构中功效较差。同时这种定性描述食物网结构也无法满足食物网复杂变化下的假说验证。应用环形统计方法,以太湖梅梁湾鱼类群落为例,定量评价了群落水平食物网能流季节演替特征。结果表明太湖梅梁湾鱼类营养生态位移动的季节特征明显。进一步物种水平分析结果表明,各种鱼类角度和幅度随季节均有变化。Rayleigh检验结果表明,群落中不同种类在秋冬、冬春和夏秋均有显著的一致的方向变化;而春夏期间不显著。Watson-William检验结果表明,群落水平的鱼类营养生态位移动在秋冬和冬春季节转换中有显著差异。引起鱼类群落水平营养生态位在食物网空间中季节性移动的主要因素为可利用资源稳定同位素的季节变化和不同鱼类种群自身的食性季节性转变。同时,由于梅梁湾食物网鱼类群落杂食性水平高,季节性浮游初级生产力成为食物网能量流动的重要驱动作用。因此,在富营养化生态系统中,食物网群落水平营养生态位季节波动也暗示了系统稳定性的下降。定量评价食物网变化有助于认识和理解食物网结构与功能在生态学和生态系统管理等方面的重要。
群落水平;食物网;营养生态位;摄食策略;稳定同位素;富营养化水域
水域生态系统中的物质循环和能量流动过程一直是生态学研究中的热点问题[1- 3]。在自然群落中,食物网研究主要用于描述消费者之间,及其与初级消费者的营养关系[1]。但是,消费者之间的营养关系常因一些因素的影响而变得错综复杂,例如资源可利用性[2]、种内与种间竞争[3],以及生境改变[4]等。因此,研究食物网结构与功能,能够揭示群落内部生物之间的竞争关系,可以评估和预测消费者、资源和食物网结构的生态效应[1]。
生物体内天然存在的碳(δ13C)、氮(δ15N)稳定同位素比值变化可反映生物长期消化吸收的食物来源、营养位置和食物网结构[5]。许多研究表明,δ13C在食性相同或者相近的物种间差异小于1‰[6- 7]。因此,δ13C可以用来判断食物网中不同生物的能量来源。δ15N的富集普遍存在于动物中,包括脊椎动物和无脊椎动物;每增加一个营养级,δ15N的值相应增加3‰—4‰。因此,δ15N主要用于确定生物在食物网中所处的营养位置[6- 7]。因此,稳定同位素分析技术可以定量研究如生物杂食性、外源物质输入、物种入侵、人类活动导致的污染物排放等问题对食物网结构与功能的影响[8- 11]。
随着稳定同位素技术在生态领域的广泛应用,其它的一些研究方法也与稳定同位素技术结合起来探讨和分析淡水生态系统中的一系列问题。稳定同位素分析与肠含物分析结合揭示水体食物网中消费者的食物源与营养关系[12];与C / N比、脂肪酸分析[13- 14]结合解决水生生态系统中有机物的来源以及能量的流动;与混合模型[15- 16]结合解决水体消费者的各种食物源对消费者的贡献以及不同来源的有机物对食物网的能量贡献。此外,也有学者探讨了利用稳定同位素研究群落水平生态位宽幅的可行性,提出了δ15N区间、δ13C区间、生态位总面积等一系列概念[17- 18]。
目前,国内有关研究大多是针对单个物种,且采用的多是传统的肠含物分析方法,缺少对群落水平食物网能流季节演替特征的比较研究。本研究利用碳、氮稳定同位素技术,结合Schmidt等人提出的环形统计分析方法[19],以太湖梅梁湾鱼类群落为研究对象,探讨群落水平食物网能流季节演替特征,为从生态系统水平解释食物网物质循环与能量流动提供理论与方法支撑。
1 研究地点与方法
1.1 研究区概况
太湖位于经济发达的长江三角洲上,是我国的三大淡水湖泊,跨江苏无锡苏州和浙江湖州等城市(30°56′—31°56′ N, 119°54′—120°36′ E),面积为2338 km2,平均深度1.89 m,最大水深不超过3 m。梅梁湾(31°31′—325′N, 120°09′—340′E)位于太湖的北部。近10年以来,由于该湖湾周边地区工农业的发展和城市人口的剧增,导致湖湾每年5—9月份蓝藻水华的频繁暴发,该湖湾已成为太湖污染最严重的水域之一[20]。
1.2 鱼类样品采集与测定概述
本研究所用数据中鱼类消费者为2004年到2005年秋、冬、春、夏的周年采集样品。用于稳定同位素分析的肌肉组织取自鱼类背部,因为背部肌肉可代表整个鱼类个体的稳定同位素值[20]。肌肉组织样品于烘箱中60℃条件下烘至恒重,并研磨至均匀细粉。分析所用的仪器为中国科学院水生生物研究所Carlo Erba EA- 1110元素分析仪与Delta Plus Finnigan同位素比率质谱连用仪;样品分析精度为0.3‰[20]。
1.3 同位素数据的环形统计
依据角度数据计算[21],本研究计算了季节变化过程中,鱼类群落稳定同位素比值在食物网空间中变化的幅度与方向。由于生物地球化学循环过程,会影响稳定同位素对生物营养生态位的指示作用,因此许多研究采用了稳定同位素基准校正消费者稳定同位素[22- 25]。太湖梅梁湾系统富营养化严重,因此同位素基准季节性变异大。但由于本研究中没有各季节统一的基准生物,因此本研究在环形统计中,未对鱼类群落直接进行校正;而是在讨论对其潜在影响进行分析。本研究计算了碳氮两种稳定同位素属性季节变化的方向(角度)和幅度。对鱼类群落水平的平均变化特征,本研究计算了所有种类变化的平均特征。角度变化的标准差用于反映相关特征的离散程度。上述统计指标主要用于反映种类或群落在营养生态位空间中的季节变化。
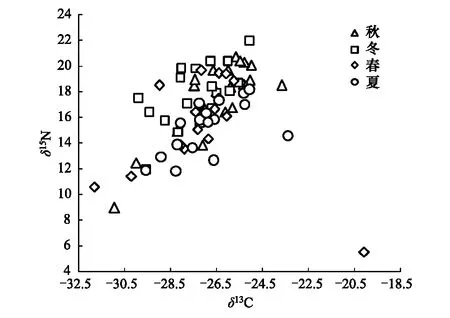
图1 太湖梅梁湾鱼类群落稳定同位素食物网特征(数据来源[20])Fig.1 Stable isotope food web diagram for all seasonal types of the fish community in Meiliang Bay, Lake Taihu 图中各点位为不同季节鱼类碳氮稳定同位素均值;便于直观,各数据点标准差未在图中标注
在群落水平上,用直观的箭头图评价了角度和幅度的季节变化。箭头图显示了太湖梅梁湾鱼类营养生态位移动的角度和幅度。Rayleigh检验用于评价角度分布的均一性,其零假设为分布均一。生态学意义为群落中各消费者营养生态位移动的角度在所有方向上相同,也就是说没有特定的变化。如果检验结果为显著水平,则说明群落水平的营养生态位移动不是随机的,而是在食物网生态位空间里有方向性的。Watson-William双样本检验用于评价不同时间(如季节)或空间(如栖息地)角度变化的差异。该检验的零假设为两组样本角度无差异。本研究中,Watson-William双样本检验可以用于说明群落水平的营养生态位在食物网生态位空间里的移动在季节是否有显著变化。本研究与环形统计有关的计算、做图和统计检验均在R软件中完成(Package ‘circular’)[26]。
2 结果
本研究共涉及到太湖梅梁湾沿岸带收集的18种鱼类的稳定同位素。研究区间包括4个季节:2004年到2005年秋、冬、春、夏。秋季鱼类δ13C与δ15N值主要集中在(-27.5±0.6)‰—(-25.0±0.5)‰(δ13C)和(13.8±0.9)‰—(20.7±1.3)‰(δ15N)区间。冬季鱼类稳定同位素主要集中在(-28.8±1.3)‰—(-25.3±0.4)‰(δ13C)和14.9‰—(20.4±0.8)‰(δ15N)的区间变化。春季鱼类消费者稳定同位素主要在-28.1‰—(-25.8±1.4)‰(δ13C)和(13.5±1.9)‰—(19.7±0.9)‰(δ15N)区间变化。夏季鱼类消费者稳定同位素主要在(-28.3±0.3)‰—(-25.1±0.9)‰(δ13C)和(11.8±2.2)‰—(18.2±0.9)‰(δ15N)的区间变化(图1),详细描述参见Zhou等[20]。
在群落水平上,我们用直观的箭头图评价了角度和幅度的季节变化(图 2)。与δ13C—δ15N图(图1)的模糊特征相比,箭头图清晰显示了太湖梅梁湾鱼类营养生态位移动的角度和幅度。结果表明太湖梅梁湾鱼类营养生态位移动的季节特征明显。进一步物种水平分析结果表明,各种鱼类角度和幅度随季节均有变化(表1)。Rayleigh检验结果表明,群落中不同种类在秋冬、冬春和夏秋均有显著的一致的方向变化;而春夏期间不显著(表2)。Watson-William检验结果表明,群落水平的鱼类营养生态位秋冬动在秋冬和春冬季节转换中有显著差异(表2)。

图2 鱼类稳定同位素角度季节变化特征Fig.2 Arrow diagrams for angle of change for fishes along a gradient of seasons箭头方向指示物种在营养生态位空间上的移动方向;箭头大小指示物种移动幅度;同心环指示幅度的大小;图中直线指示群落水平的移动方向,而外缘弧线指示群落移动角度的95%置信区间

种类Species秋冬Autumntowinter角度Angle幅度Magnitude冬春Wintertospring角度Angle幅度Magnitude春夏Springtosummer角度Angle幅度Magnitude夏秋Summertoautumn角度Angle幅度Magnitude红鳍原鲌Cultrichthyserythrop-terus357.301.91203.1855.46163.1972.1518.5052.164翘嘴鲌Culterdabryi199.3595.4925.7725.819黄颡Pelteobagrusfulvidraco240.011.42200.4932.114刀鲚Coilianasus249.652.56214.2741.634113.3052.83112.0953.436大银鱼Protosalanxhyalocra-nius206.053.01银鱼Salangichthystankahkeii239.932.85182.7176.117餐条Hemiculterleucisculus265.400.87201.3293.382125.0221.55111.4174.193鳑鲏Rhodeusocellatus277.791.92190.2292.70325.562.29576.6451.429
续表
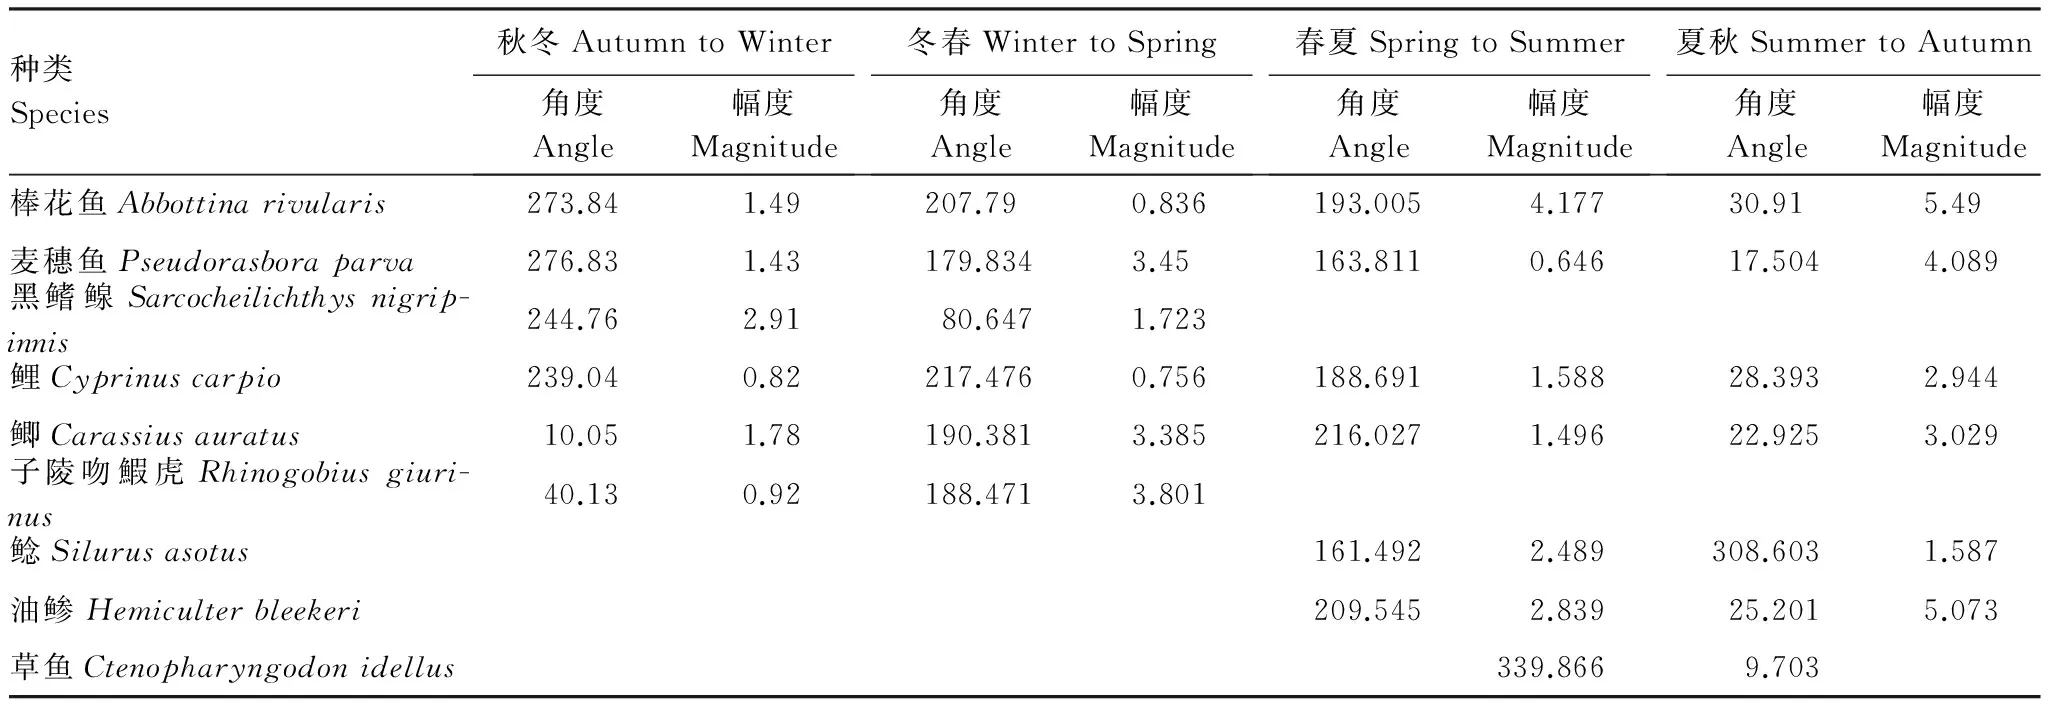
种类Species秋冬AutumntoWinter角度Angle幅度Magnitude冬春WintertoSpring角度Angle幅度Magnitude春夏SpringtoSummer角度Angle幅度Magnitude夏秋SummertoAutumn角度Angle幅度Magnitude棒花鱼Abbottinarivularis273.841.49207.790.836193.0054.17730.915.49麦穗鱼Pseudorasboraparva276.831.43179.8343.45163.8110.64617.5044.089黑鳍鳈Sarcocheilichthysnigrip-innis244.762.9180.6471.723鲤Cyprinuscarpio239.040.82217.4760.756188.6911.58828.3932.944鲫Carassiusauratus10.051.78190.3813.385216.0271.49622.9253.029子陵吻鰕虎Rhinogobiusgiuri-nus40.130.92188.4713.801鲶Silurusasotus161.4922.489308.6031.587油鲹Hemiculterbleekeri209.5452.83925.2015.073草鱼Ctenopharyngodonidellus339.8669.703
表2太湖梅梁湾鱼类群落在同位素生态位空间中方向季节变化特征的统计结果
Table2DirectionalstatisticsquantifyingchangeinisotopenichespaceforfishcommunitiesinMeiliangBay,LakeTaihu,overseasons;Pvaluesinboldfacetypearesignificantattheα=0.05level

时间Time种类数No.species平均值Meanvector方向Direction长度Length标准差CircularSDRayleigh'stestZPWatson-William'stestFP秋冬Autumntowinter14265.0990.63854.3035.7020.00216.679<0.001冬春Wintertospring13192.2020.87229.9739.880<0.00010.2460.625春夏Springtosummer13172.0160.45771.6792.7180.0630.5120.481夏秋Summertoautumn1220.4880.89826.5789.677<0.0001
3 讨论
3.1 群落水平食物网能流季节演替
已有研究多关注食物资源和消费者稳定同位素值特征;然而,消费者营养生态位变化,尤其是高营养级消费者的变化在维持水生态系统的稳定性中扮演重要角色,决定了食物链长度和物质能量传递效率[27]。太湖富营养化问题严重,生态健康状况逐年退化,关注太湖鱼类消费者种群与群落水平的食物网动力学特征具有重要意义[20, 28- 29]。
太湖初级生产者(例如悬浮颗粒有机物和附着藻类)稳定同位素有显著季节变化[20, 28- 29];而本研究结果也表明消费者稳定同位素特征也随季节波动,这说明食物网中可利用资源的稳定同位素值时间变化会通过食物链传递到高营养级消费者[8- 9, 30]。此外鱼类在生活史过程中食性转变现象普遍[23, 31]。在太湖梅梁湾,肠含物分析表明,许多鱼类为泛食性消费者(例如红鳍原鲌、湖鲚和餐条),其食物来源随着时间而发生改变[32]。因此,引起鱼类群落水平营养生态位在食物网空间中季节性移动的主要因素为可利用资源的季节变化和不同鱼类种群自身的食性季节性转变。结合基准校正的稳定同位素混合模型结果也表明太湖梅梁湾食物网底层可利用资源(例如颗粒有机物)和初级消费者(如浮游动物)的稳定同位素的季节变化显著,且鱼类底栖与浮游能量来源比例季节变化显著[20]。
本研究表明,群落中不同种类在秋冬、冬春和夏秋均有显著的一致的方向变化。与附着藻类与水生植物相比,浮游初级生产者是梅梁湾食物网重要可利用资源。碳同位素特征也表明悬浮颗粒有机物在支持梅梁湾食物网碳源驱动中的重要性[20]。同时,由于梅梁湾食物网鱼类群落杂食性水平高,因此鱼类群落水平的营养生态位移动的一致性可以归因于季节性浮游初级生产力对食物网能量流动的驱动作用。此外,梅梁湾春末、夏季、秋季浮游植物快速繁殖与生长是季节性驱动食物网能量流动的另一个特征。因此,群落水平的鱼类营养生态位移动仅在秋冬和冬春季节转换中有显著差异也在一定程度上进一步支持了本结论。富营养化生态系统中,食物网群落水平营养生态位季节波动也暗示了系统稳定性的下降[20]。
3.2 环形统计效果评价
在群落水平上,本研究用直观的箭头图评价了角度和幅度的季节变化(图2)。与δ13C—δ15N图(图1)的模糊特征相比,箭头图清晰显示了太湖梅梁湾鱼类营养生态位移动的角度和幅度。应用稳定同位素研究群落水平的营养关系是近年来一个关注的焦点,因此应用定量评价技术手段分析群落同位素数据显得尤为重要[33- 35]。Schmidt等应用环形统计分析手段定量评价了两个生态系统中节肢动物群落空间梯度和鱼类群落时间梯度下的食物网能流特征,并对解释数据的生态学意义进一步提升[19]。本研究结果也表明环形统计在分析富营养湖泊鱼类群落相对复杂的季节性食物网变化特征方面有很大优势。与δ13C—δ15N图的趋势特征相比[20],环形统计给出了定量评价季节性食物网能流变化的结果;这也为进一步探究生态系统稳定性、抗干扰能力和恢复力提供了定量判别手段。
不同时空中生物与非生物因子均会影响生态系统生物地球化学循环特征,进而生物的稳定同位素比值。因此,近年来同位素生态学研究中,通常根据所研究的生态系统自身特征,选择基准生物来评价食物网[6]。基于以下两个因素,本研究未对鱼类群落的稳定同位素进行基准校正。第一,由于梅梁湾食物网鱼类群落杂食性水平高,许多种类食物来源在两个营养级以上,评价鱼类群落水平的营养生态位移动不能简单确定唯一同位素营养级富集指数[1]。第二,由于梅梁湾富营养化严重,同位素生物地球化学循环季节变化剧烈;在缺乏不同季节同一物种作为基准的情况下,也不便于用不同同位素周转特征的食物网底层生物作为校正基准[37]。综上,为进一步提升食物网定量统计分析的精度,仍需进行基准校正下的食物网营养生态位定量研究。
[1] Post D M. Using stable isotopes to estimate trophic position: models, methods, and assumptions. Ecology, 2002, 83: 703- 718.
[2] Zimmerman M S, Schmidt S N, Krueger C C, Vander Zanden M J, Eshenroder R L. Ontogenetic niche shifts and resource partitioning of lake trout morphotypes. Canadian Journal of Fisheries and Aquatic Sciences, 2009, 66: 1007- 1018.
[3] López-Bao J, Palomares F, Rodríguez A, Ferreras P. Intraspecific interference influences the use of prey hotspots. Oikos, 2011, 120: 1489- 1496.
[4] Schindler D E, Scheuerell M D. Habitat coupling in lake ecosystems. Oikos, 2002, 98: 177- 189.
[5] Xu J. Ecological studies on the food web structures and trophic relationships of freshwater lakes in China using stable carbon and nitrogen isotopes. PhD thesis. Institute of Hydrobiology,Chinese Academy of Sciences.2005.
[6] Xu J, Zhang M, Xie P. Variability of stable isotopic baselines and its consequence for trophic modeling. Journal of Lake Sciences, 2010, 22: 10- 23.
[7] Xu J, Zhou Q, Zeng Q, Zhang M, Zhang L, Wen Z, Wang, Y. Stable carbon and nitrogen isotopes in aquatic ecology: Theories and applications//Duan, C. (ed.) Advances in Ecological Sciences. Higher Education Press, 2010: 35- 80.
[8] Xu J, Xie P, Zhang M, Yang H. Variation in stable isotope signatures of seston and a zooplanktivorous fish in a eutrophic Chinese lake. Hydrobiologia, 2005, 541: 215- 220.
[9] Xu J, Xie P, Zhang M, Zhou Q, Zhang L, Wen Z, Cao T. Icefish (Salangidae) as an indicator of anthropogenic pollution in freshwater systems using nitrogen isotope analysis. Bulletin of Environmental Contamination and Toxicology, 2007, 79: 323- 326.
[10] Xu J, Zhang M, Xie P. Stable carbon isotope variations in surface bloom scum and subsurface seston among shallow eutrophic lakes. Harmful Algae, 2007, 6: 679- 685.
[11] Xu J, Zhang M, Xie P. Primary consumers as bioindicator of nitrogen pollution in lake planktonic and benthic food webs. Ecological Indicators, 2011, 14: 189- 196.
[12] Rudnick D, Resh V. Stable isotopes, mesocosms and gut content analysis demonstrate trophic differences in two invasive decapod crustacea. Freshwater Biology, 2005, 50: 1323- 1336.
[13] Logan J, Jardine T, Miller T, Bunn S, Cunjak R, Lutcavage M. Lipid corrections in carbon and nitrogen stable isotope analyses: comparison of chemical extraction and modelling methods. Journal of Animal Ecology, 2008, 77: 838- 846.
[14] Van den Meersche K, Van Rijswijk P, Soetaert K, Middelburg J J. Autochthonous and allochthonous contributions to mesozooplankton diet in a tidal river and estuary: Integrating carbon isotope and fatty acid constraints. Limnology and Oceanography, 2009, 54: 62- 74.
[15] Phillips D L, Gregg J W. Uncertainty in source partitioning using stable isotopes. Oecologia, 2001, 127: 171- 179.
[16] Parnell A C, Inger R, Bearhop S, Jackson A L. Source partitioning using stable isotopes: coping with too much variation. PLoS One, 2010, 5: e9672.
[17] Newsome S D, Martinez del Rio C, Bearhop S, Phillips D L. A niche for isotopic ecology. Frontiers in Ecology and the Environment, 2007, 5: 429- 436.
[18] Layman C A, Arrington D A, Montaa C G, Post D M. Can stable isotope ratios provide for community-wide measures of trophic structure?. Ecology, 2007, 88: 42- 48.
[19] Schmidt S N, Olden J D, Solomon C T, Vander Zanden M J. Quantitative approaches to the analysis of stable isotope food web data. Ecology, 2007, 88: 2793- 2802.
[20] Zhou Q, Xie P, Xu J, Liang X, Qin J, Cao T, Chen F. Seasonal trophic shift of littoral consumers in eutrophic Lake Taihu (China) revealed by a two-Source mixing model. The Scientific World Journal, 2011, DOI 10.1100/tsw.2011.134.
[21] Batschelet E. Circular statistics in biology. New York, USA: Academic Press New York, 1981.
[22] Vander Zanden M J, Vadeboncoeur Y. Fishes as integrators of benthic and pelagic food webs in lakes. Ecology, 2002, 83: 2152- 2161.
[23] Xu J, Zhang M, Xie P. Size-related shifts in reliance on benthic and pelagic food webs by lake anchovy. Ecoscience, 2007, 14: 170- 177.
[24] Xu J, Zhang M, Xie P. Stable isotope changes in freshwater shrimps (ExopalaemonmodestusandMacrobrachiumnipponensis): trophic pattern implications. Hydrobiologia, 2008, 605: 45- 54.
[25] Xu J, Zhang M, Xie P. Sympatric variability of isotopic baselines influences modeling of fish trophic patterns. Limnology, 2011, 12: 107- 115.
[26] R Development Core Team.R:ALanguageandEnvironmentforStatisticalComputing. R Foundation for Statistical Computing, Vienna, Austria. 2009, http://www.R-project.org.
[27] Vander Zanden M J, Fetzer W W. Global patterns of aquatic food chain length. Oikos, 2007, 116: 1378- 1388.
[28] Zhou Q, Xie P, Xu J, Ke Z, Guo L. Growth and food availability of silver and bighead carps: evidence from stable isotope and gut content analysis. Aquaculture Research, 2009, 40: 1616- 1625.
[29] Zhou Q, Xie P, Xu J, Ke Z, Guo L, Cao T. Seasonal variations in stable isotope ratios of two biomanipulation fishes and seston in a large pen culture in hypereutrophic Meiliang Bay, Lake Taihu. Ecological Engineering, 2009, 35: 1603- 1609.
[30] Zhang L, Xu J, Xie P, Zang X, Qiu G, Zeng J. Stable isotope variations in particulate organic matter and a planktivorous fish in the Yangtze River. Journal of Freshwater Ecology, 2007, 22: 383- 386.
[31] Wang Y, Yu X, Xu J. Decreased trophic position as a function of increasing body size of a benthic omnivorous fish from the largest freshwater lake in China. Environmental Biology of Fishes, 2011, 91: 505- 512.
[32] Jialin Ye. Community assembly and feeding ecology of littroral fish in Meilang Bay, Lake Taihu. Master thesis. Huazhong Agricultural University,2006.
[33] Schmidt S N, Vander Zanden M J, Kitchell J F. Long-term food web change in Lake Superior. Canadian Journal of Fisheries and Aquatic Sciences, 2009, 66: 2118- 2129.
[34] Vander Zanden M J, Chandra S, Allen B C, Reuter J E, Goldman C R. Historical food web structure and restoration of native aquatic communities in the Lake Tahoe (California-Nevada) basin. Ecosystems, 2003, 6: 274- 288.
[35] Solomon C T, Carpenter S R, Rusak J A, Vander Zanden M J. Long-term variation in isotopic baselines and implications for estimating consumer trophic niches. Canadian Journal of Fisheries and Aquatic Sciences, 2008, 65: 2191- 2200.
[37] Xu J, Zhang M, Xie P. Sympatric variability of isotopic baselines influences modeling of fish trophic patterns. Limnology, 2011, 12: 107- 115.
参考文献:
[5] 徐军. 应用碳、氮稳定性同位素探讨淡水湖泊的食物网结构和营养级关系. 2005. 中国科学院水生生物研究所.
[6] 徐军, 张敏, 谢平. 氮稳定同位素基准的变异性及对营养级评价的影响. 湖泊科学, 2010, 22: 10- 23.
[7] 徐军, 周琼, 曾庆飞, 张敏, 张亮, 温周瑞, 王玉玉. 碳、氮稳定同位素技术及其在水域生态学研究中的应用. 生态科学进展第五卷. 北京: 高等教育出版社, 2010: 35- 80.
[32] 叶佳林. 太湖梅梁湾沿岸带鱼类组成和摄食生态研究. 华中农业大学硕士论文, 2006.
Seasonaldynamicsoffoodwebenergypathwaysatthecommunity-level
XU Jun1,*, ZHOU Qiong2, WEN Zhourui3, XIE Ping1
1InstituteofHydrobiology,ChineseAcademyofSciences,Wuhan430072,China2CollegeofFisheries,HuazhongAgriculturalUniversity,Wuhan430070,China3HubeiFisheryScienceInstitute,Wuhan430071,China
Stable isotopes analysis, especially carbon and nitrogen, are now commonly used to study material circulation and energy flow within ecosystems. Carbon isotope ratios (δ13C) are used to trace food sources of consumers, while nitrogen isotope ratios (δ15N) are mainly used to quantify trophic levels of organisms. Traditionally,δ13C vs.δ15N bi-plots have been used to describe food web structure for a single time period or ecosystem, but this method show less power in comparisons of food webs across time and space. Meanwhile, simple qualitative descriptions of food webs cannot test hypotheses regarding food web complex changes. Here we present statistical methodologies for quantitatively comparing stable isotope food web data. We demonstrate the utility of circular statistics and hypothesis tests for quantifying directional food web differences using a case study, a freshwater fish community from Meiliang Bay, Lake Taihu, over seasons. We used arrow diagrams for angle of change for fishes along a gradient of seasons, in which each arrow represents a single species and the direction in trophic niche space the species moved. The length of the arrow represents the magnitude of change for that particular species. Concentric circles correspond to magnitude of change. The straight line is the mean vector of change among all species; the curved line on the rim indicates the 95% confidence interval around the mean vector of change. Directional change (magnitude and angle) and statistics quantifying change in isotope niche space for fish communities were also calculated. Based on these results, we found that most species from the freshwater fish community showed statistically significant shift in the same direction in food web space toward more pelagic-based production except summer to autumn seasons. In support of these patterns, the Rayleigh′s test indicated significant pattern of consistent change among species in autumn to winter, winter to spring and spring to summer seasons. The Watson-William′s test for comparison of the community in different time indicated that significant difference between the directional change in the fish community between autumn to winter and winter to spring seasons. Seasonal dynamics of food web energy pathways at the community-level in the current study was attributed to seasonal dynamics of stable isotope composition of available resources and foraging shifts of fish species. Meanwhile, because of the high omnivory in fish community in the current system, temporal variations in pelagic primary productivity strongly drive the energy flows in local food web. Therefore, seasonal dynamics of food web energy pathways at the community-level in eutrophic ecosystem may imply the decrease of food web stability in this eutrophic system with the dynamics of resource availability. As an understanding of food web structure and functioning is of growing importance in ecology theory and ecosystem management, our study demonstrate the quantifying food web differences from the standard stable isotope analysis.
community-level; food web; trophic niche; feeding strategy; stable isotope; eutrophic aquatic ecosystem
国家自然科学基金资助项目(31170439);国家科技重大专项资助项目(2012ZX07101-001-04)
2012- 05- 13;
2012- 10- 23
*通讯作者Corresponding author.E-mail: xujun@ihb.ac.cn
10.5846/stxb201205130700
徐军,周琼,温周瑞,谢平.群落水平食物网能流季节演替特征.生态学报,2013,33(15):4658- 4664.
Xu J, Zhou Q, Wen Z R, Xie P.Seasonal dynamics of food web energy pathways at the community-level.Acta Ecologica Sinica,2013,33(15):4658- 4664.
猜你喜欢
海洋信息技术与应用(2022年1期)2022-06-05
儿童时代·幸福宝宝(2020年9期)2020-09-08
玩具世界(2017年4期)2017-07-21
宝藏(2017年2期)2017-03-20
中亚信息(2016年3期)2016-12-01
金色少年(奇趣科普)(2016年8期)2016-09-21
电源技术(2015年7期)2015-08-22
金融经济(2015年16期)2015-08-21
同位素(2014年3期)2014-06-13
同位素(2014年2期)2014-04-16