
Improved Correlations for Prediction of Viscosity of Iranian Crude Oils
2014-07-24 15:40MajidTaghizadehandMehdiEftekhari
Majid Taghizadehand Mehdi Eftekhari
Chemical Engineering Department, Babol University of Technology, Babol 4714871167, Iran
Improved Correlations for Prediction of Viscosity of Iranian Crude Oils
Majid Taghizadeh*and Mehdi Eftekhari
Chemical Engineering Department, Babol University of Technology, Babol 4714871167, Iran
Empirical equations for predicting the viscosity of Iranian crude oils above, at and below the bubble-point pressure were developed based on pressure-volume-temperature (PVT) data of 57 bottom hole samples collected from central, southern and offshore oil fields of Iran. Both statistical and graphical techniques were employed to evaluate these equations compared with other empirical correlations. The results show that the developed correlations present better accuracy and performance for predicting the viscosity of Iranian crude oils than those correlations in literature.
viscosity correlations, pressure-volume-temperature (PVT) data, viscosity prediction, Iranian crude oils
1 INTRODUCTION
One of the most important physical properties of crude oils is viscosity, which controls the flow of oil through porous media and pipes. The oil viscosity is a strong function of temperature, pressure, oil specific gravity, gas solubility and composition of oil mixture [1-5]. Although oil viscosity is measured isothermally at reservoir temperature and different pressures, viscosity data are needed at temperatures other than reservoir temperature for designing process equipment and pipelines, particularly for planning thermal methods of enhanced oil recovery [6-8]. Therefore, crude oil viscosity correlations are used to predict viscosity when experimental data are not available at temperatures other than reservoir temperature.
Crude oil viscosity correlations are usually developed for three situations: at, above, and below the bubble-point pressure. Saturated oil viscosity is the viscosity of crude oil at the bubble-point pressure and reservoir temperature. Below the bubble-point pressure, dissolved gas in oil is released as pressure decreases. When the pressure reduces to atmospheric pressure, there is no gas left in the oil and such oil is called dead oil, whose viscosity is referred to as the dead oil viscosity. Oil viscosity above the bubble-point (under-saturated oil viscosity) is defined as the crude oil viscosity at pressures higher than the bubble-point pressure and reservoir temperature [1, 9]. Above the bubble-point pressure, oil is at single-phase state, no gas is dissolved into oil and pressure becomes the primary independent variable for predicting the viscosity of under-saturated oil. By increasing pressure above the bubble-point, oil density and oil viscosity will be increased. If the pressure falls below the bubble-point, gas will evolve from the liquid into the pore space and the oil composition changes continuously. The oil becomes heavier and more viscous, and two phases will flow in the reservoir. Thus oil viscosity has its minimum value at bubble-point [10, 11].
In many cases, the information available from pressure-volume-temperature (PVT) analyses of an oil sample is simple and determined readily by measurable parameters such as oil relative density and gas/oil ratio. Direct viscosity measurement or complete compositional analyses of crude oils are expensive, so empirical correlations, which are functions of these readily measurable PVT properties, are usually used to estimate oil viscosity [12, 13].
Viscosity data of saturated and under-saturated crudes at temperatures other than reservoir temperature are predicted from crude oil viscosity models. Most saturated oil viscosity models express saturated oil viscosity as a function of dead oil viscosity and solution gas/oil ratio (see Appendix A1). Beal [6], Beggs and Robinson [14], Kartoatmodjo and Schmidt [15], Vazquez and Beggs [16], Chew and Connally [17], and Elsharkawy and Alikhan [18] correlated oil viscosity with temperature, bubble-point pressure, oil American Petroleum Institute (API) gravity, dead oil viscosity and solution gas/oil ratio. Moreover, Khan et al. [10] used oil API gravity, specific gas gravity and reservoir temperature in addition to solution gas-oil ratio to predict the viscosity of saturated crudes at the bubble-point (see Appendix A1), while Labedi [19] used a direct function of dead-oil viscosity, API gravity, and bubble-point pressure.
The objective of this study is to develop a modified Khan et al.’s [10] empirical viscosity correlation, which incorporates reservoir pressure, temperature, and other parameters obtained readily from PVT analysis. We develop our correlations in three different regimes: at the bubble-point pressure, below the bubblepoint pressure, and above the bubble-point pressure.
2 PVT DATA ACQUISITION FOR IRANIAN CRUDE OILS
We develop our correlations with PVT data of 57 bottom hole samples collected from central, southernand offshore oil fields of Iran. These samples were separated by flash to obtain solution gas-oil ratio, gas relative density, and oil API gravity. Viscosity data were measured by rolling ball viscometry at various pressures and accessed with cooperation by Research Institute of Petroleum Industry of Iran (RIPI). Data include measurements of crude oil viscosity at reservoir temperature for 376 points below the bubble-point pressure and 287 points above the bubble-point pressure.
3 MODEL DEVELOPMENT
Most of published correlations correlate the saturated oil viscosity to dead oil viscosity obtained from other correlations [14-18]. Khan et al. (see Appendix A1) developed a saturated oil viscosity model independent of dead oil viscosity, using the variables such as temperature, bubble-point pressure, solution gas-oil ratio, specific oil or gas gravity [10]. We develop our models based on Khan’s correlations for predicting the viscosity of saturated crude oil, the viscosity below and above the bubble-point pressure (under-saturated oil viscosity). These correlations were obtained by nonlinear regression analysis using MATLAB software.
3.1 Viscosity model at bubble-point pressure
Most reservoir oils follow the general trend of oil viscosity as a function of pressure. In single phase, oil viscosity decreases with pressure reduction and this trend continues to bubble-point. Pressure reduction below the bubble-point pressure causes gas release, increasing oil density and oil viscosity. Thus oil viscosity has its minimum value at the bubble-point [18].
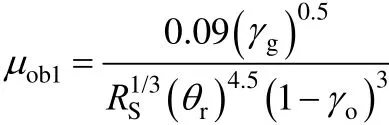
In this study saturated oil viscosities is predicted as a function of solution gas-oil ratio, temperature, and specific oil gravity. Best results are obtained by nonlinear multiple regression analysis from the following empirical model
whereobμ is saturated oil viscosity,SR is solution gas-oil ratio,rθ is relative temperature, andoγ is oil specific gravity.
Table 1 shows the source of crude oils and saturated crude oil viscosity from different models.
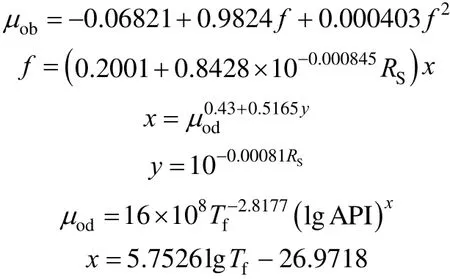
3.2 Viscosity model below the bubble-point pressure
In production, when the pressure drops below the bubble point, gas comes out of solution and the oil composition changes continuously. Most of researchers use the same correlation as saturated oil for prediction of crude oil viscosity below the bubble-point pressure. Khan et al. [10] and Labedi [19] proposed a function to predict the viscosity of saturated crudes below the bubble-point, which is different from that at the bubble-point. An independent correlation for predicting the oil viscosity below the bubble-point is developed in this study wherebμ is oil viscosity below the bubble point, P and Pbare pressure and bubble point pressure, respectively.

3.3 Under-saturated oil viscosity model
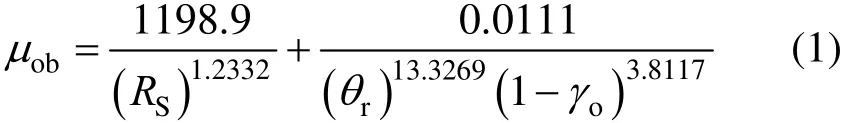
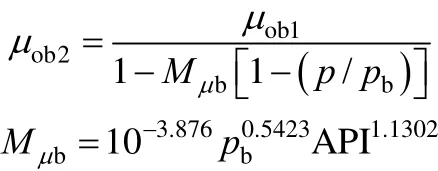
Above the bubble-point pressure, viscosity increases with pressure. The rate of viscosity increase of under-saturated oils is a function of pressure. As no gas is dissolved into oil above the bubble-point, pressure is an independent variable for predicting the viscosity of under-saturated oil (see Appendix A2). For under-saturated oil, viscosity correlation is presented as

whereoμ is under-saturated oil viscosity,obμ is saturated oil viscosity, P and Pbare pressure and bubble point pressure, respectively.
Table 2 shows the source of crude oils and data range for some under-saturated oil viscosity correlations.
As a typical example, the comparison between the measured and predicted viscosity from correlations developed in this study as a function of pressure for three oil samples is demonstrated in Fig. 1.
4 RESULTS AND DISCUSSION
In order to compare the performance of the empirical correlations, statistical error analysis was performed. The accuracy of different models is given inTables 3-5, showing the average percent relative error (Er), average absolute percent relative error (Ea), standard deviation (S), and the correlation coefficient (r) (see Appendix A3).

Table 1 Data from some correlations for saturated oil viscosity
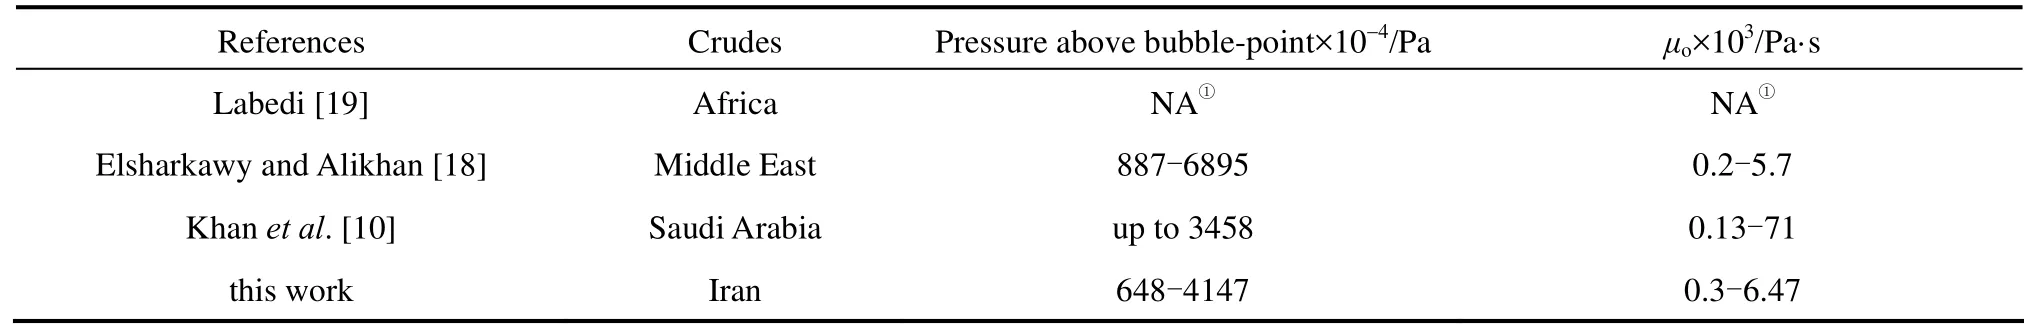
Table 2 Data range of some existing correlations for under-saturated oil viscosity

Table 3 Statistical accuracy of bubble-point oil correlations for estimating viscosity of Iranian crude oils
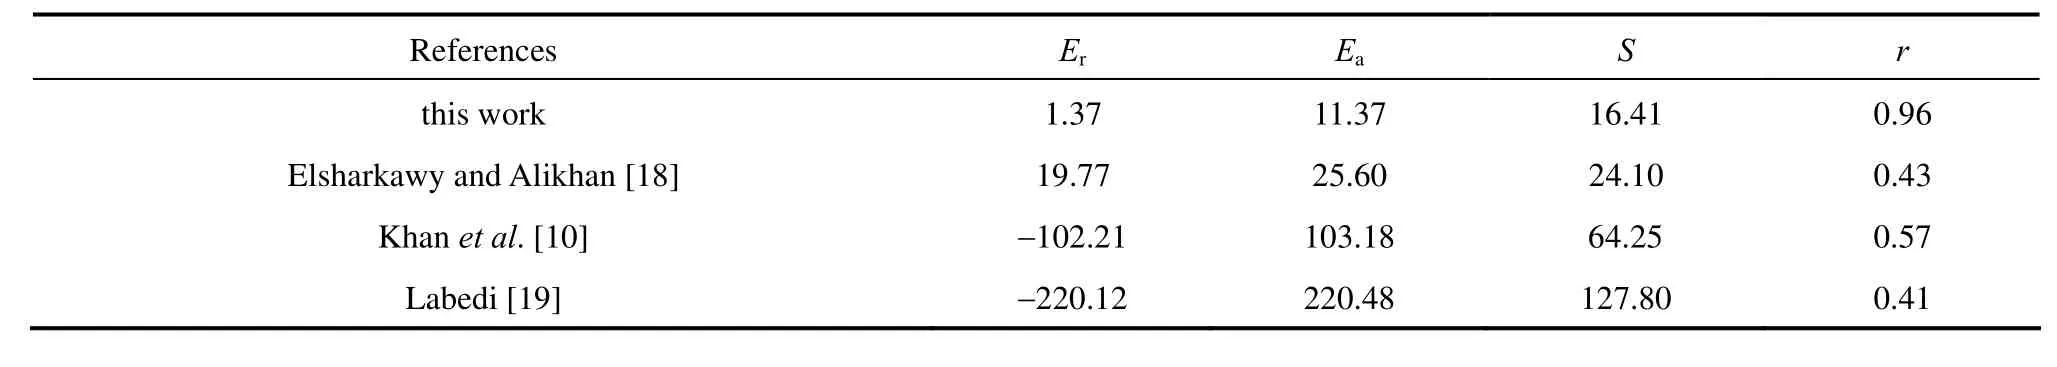
Table 4 Statistical accuracy of correlations for estimating viscosity of Iranian crude oils below the bubble-point pressure
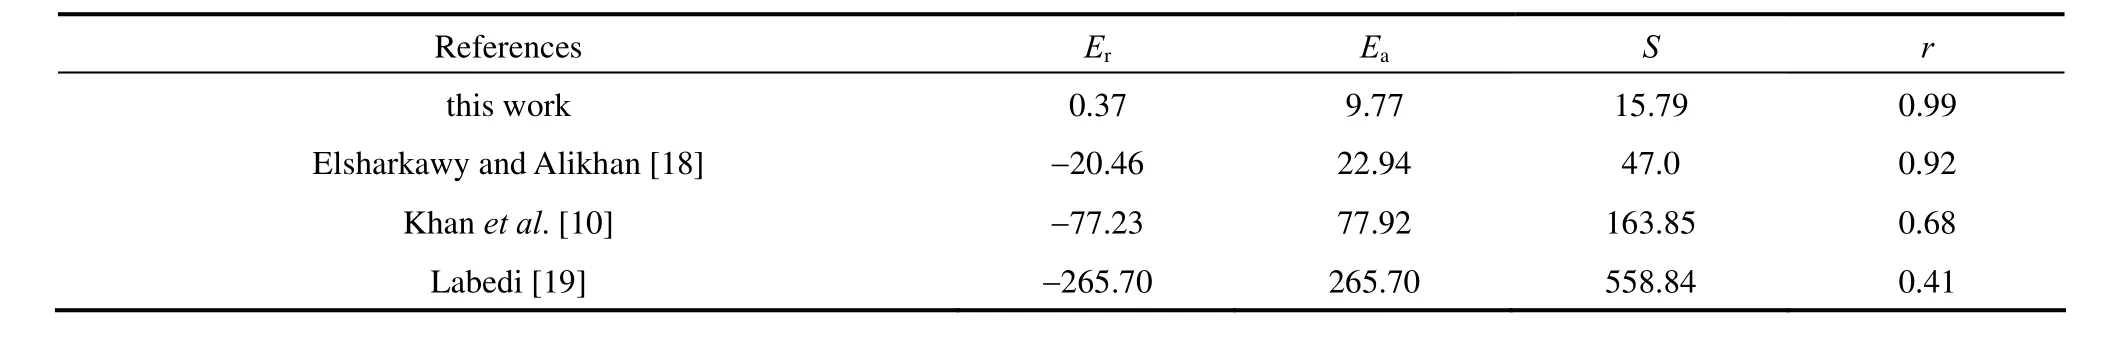
Table 5 Statistical accuracy of under-saturated oil correlations for estimating viscosity of Iranian crude oils

Figure 1 Comparison between the measured and predicted oil viscosity as a function of pressure for three oil samples
4.1 Saturated oil viscosity model
4.1.1 Viscosity model at bubble-point pressure
Table 3, Figs. 2 and 3 show that our correlation presents the smallest average relative error, absolute error, and standard deviations compared to other correlations for estimating bubble-point oil viscosity of Iranian crude oils. Compared to some correlations that underestimate viscosity [10, 19] and some correlations with irrational estimation (not shown here) [14, 15], the results of this work are in better agreement with experimental data.
4.1.2 Viscosity model below the bubble-point pressure
Table 4 gives the results of the correlations for prediction of Iranian oil viscosity below bubble-point pressures. Our correlation presents the lowest average relative error, average absolute relative error and standard deviations, followed by the model of Elsharkawy and Alikhan [18]. Figs. 4 and 5 show thatour model has the smallest error range and least scatter around the zero error line, while Labedi’s correlation [19] has the largest relative error for estimation of the viscosity for Iranian crude oils.
4.2 Under-saturated oil viscosity model
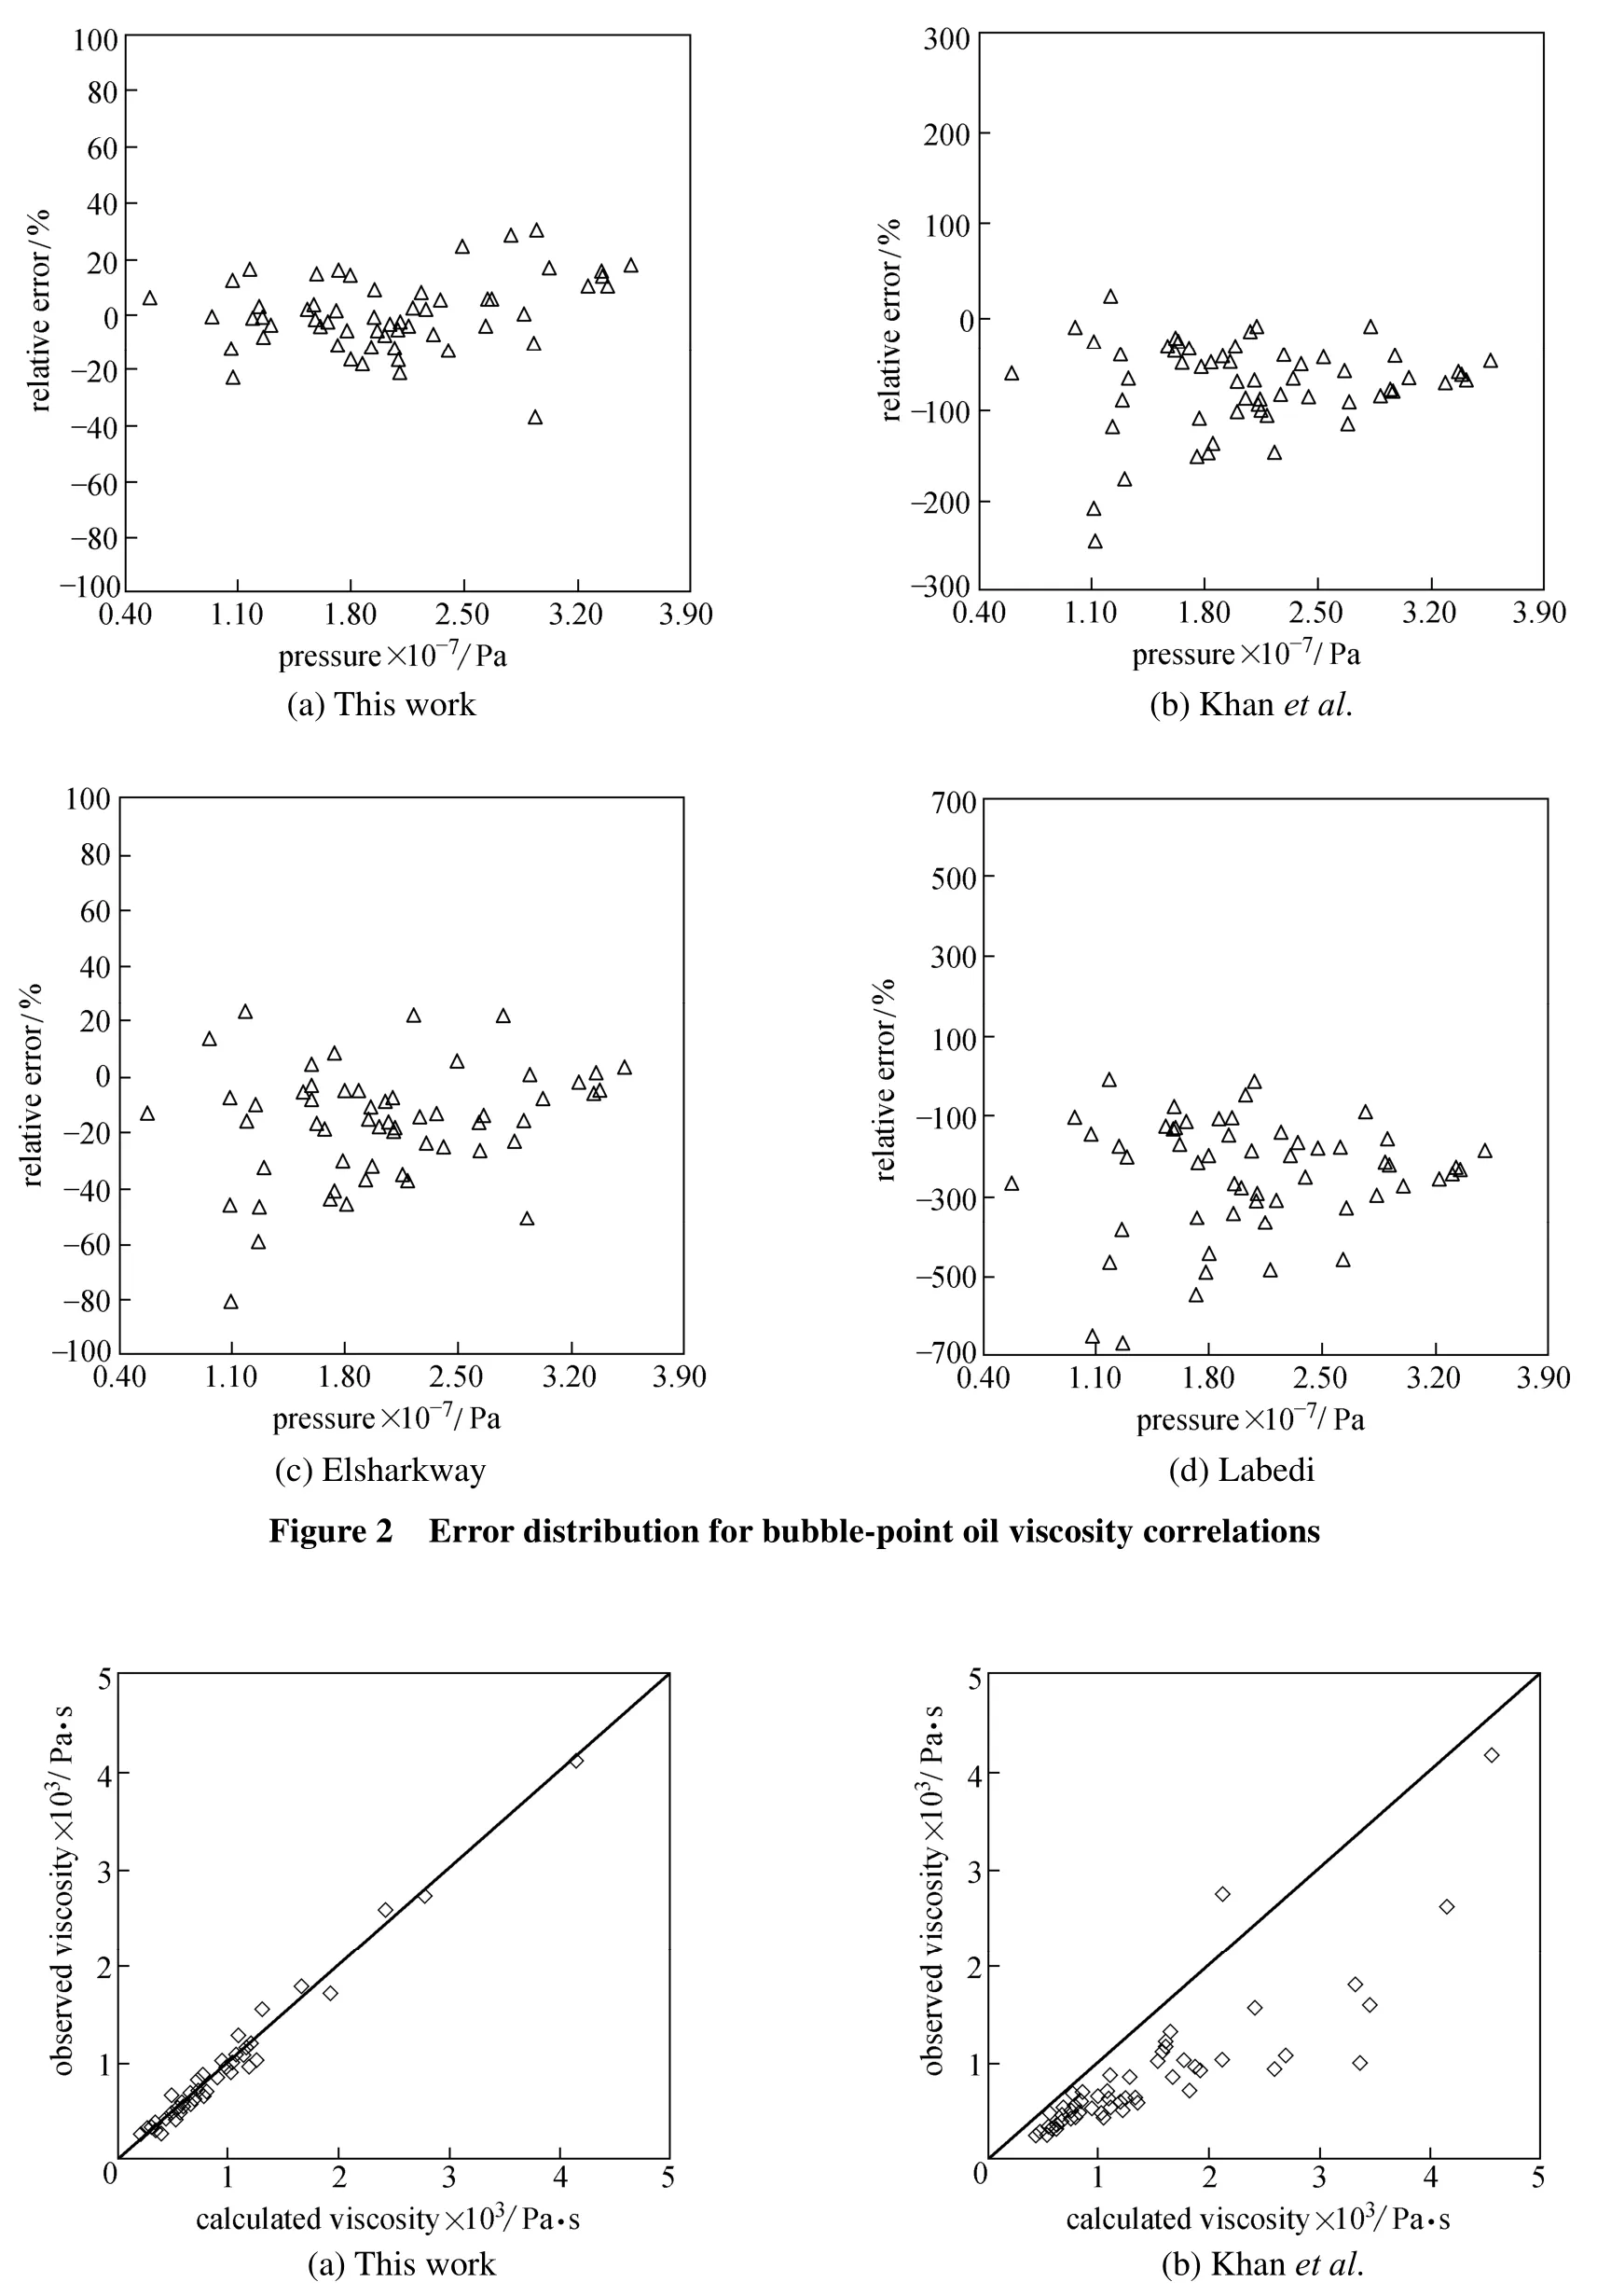
Figure 3 Performance plot for bubble-point oil viscosity correlations

Figure 3 Performance plot for bubble-point oil viscosity correlations
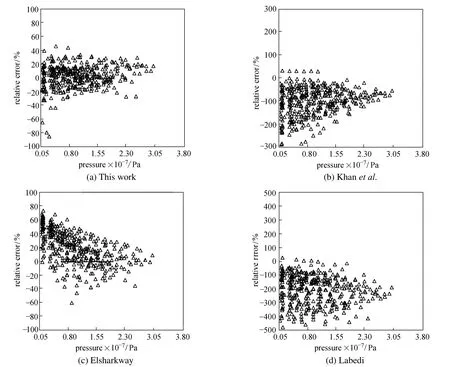
Figure 4 Error distribution for oil viscosity correlations below the bubble-point pressure
Table 5 shows that the correlation proposed in this work has the smallest errors and standard deviations for predicting Iranian under-saturated oil viscosity, followed by the model of Elsharkawy and Alikhan [18]. Figs. 6 and 7 show that Khan’s [10] and Labedi’s [19] correlations underestimate under-saturated oil viscosity for Iranian crudes. Our model is in better agreement with experimental data compared with the other predictions.
Our viscosity correlations based on Iranian field data do not require compositional information and can be used for black oil type fluids. The correlation can be tuned easily and provides better estimation for oil viscosity than previous correlations, most of which are based on specific regions/crude oils and have limited accuracy for the viscosity of Iranian crude oils. These results are expectable since the viscosity highly depends on oil nature and source [20, 21].
5 CONCLUSIONS
The modified Khan et al.’s [10] empirical viscosity correlations were assessed for the Iranian crudes using the viscosity data from the region. These correlations incorporate oil API gravity, saturation pressure, reservoir temperature and pressure, which are easily measured in oil fields. Our correlations were developed using 57 points for saturated oil viscosity, 376 points for viscosity below the bubble-point pressure, and 287 points for viscosity above the bubble-point pressure. The average relative errors for these equations were 0.1%, 1.37% and 0.37%. Several empirical models in literature for estimating the viscosity ofcrude oils were evaluated using the viscosity data of crude oils from Iran. The comparison shows that our correlations present better accuracy and performance for predicting the viscosity of Iranian oils.

Figure 5 Performance plot for oil viscosity correlations below the bubble-point pressure
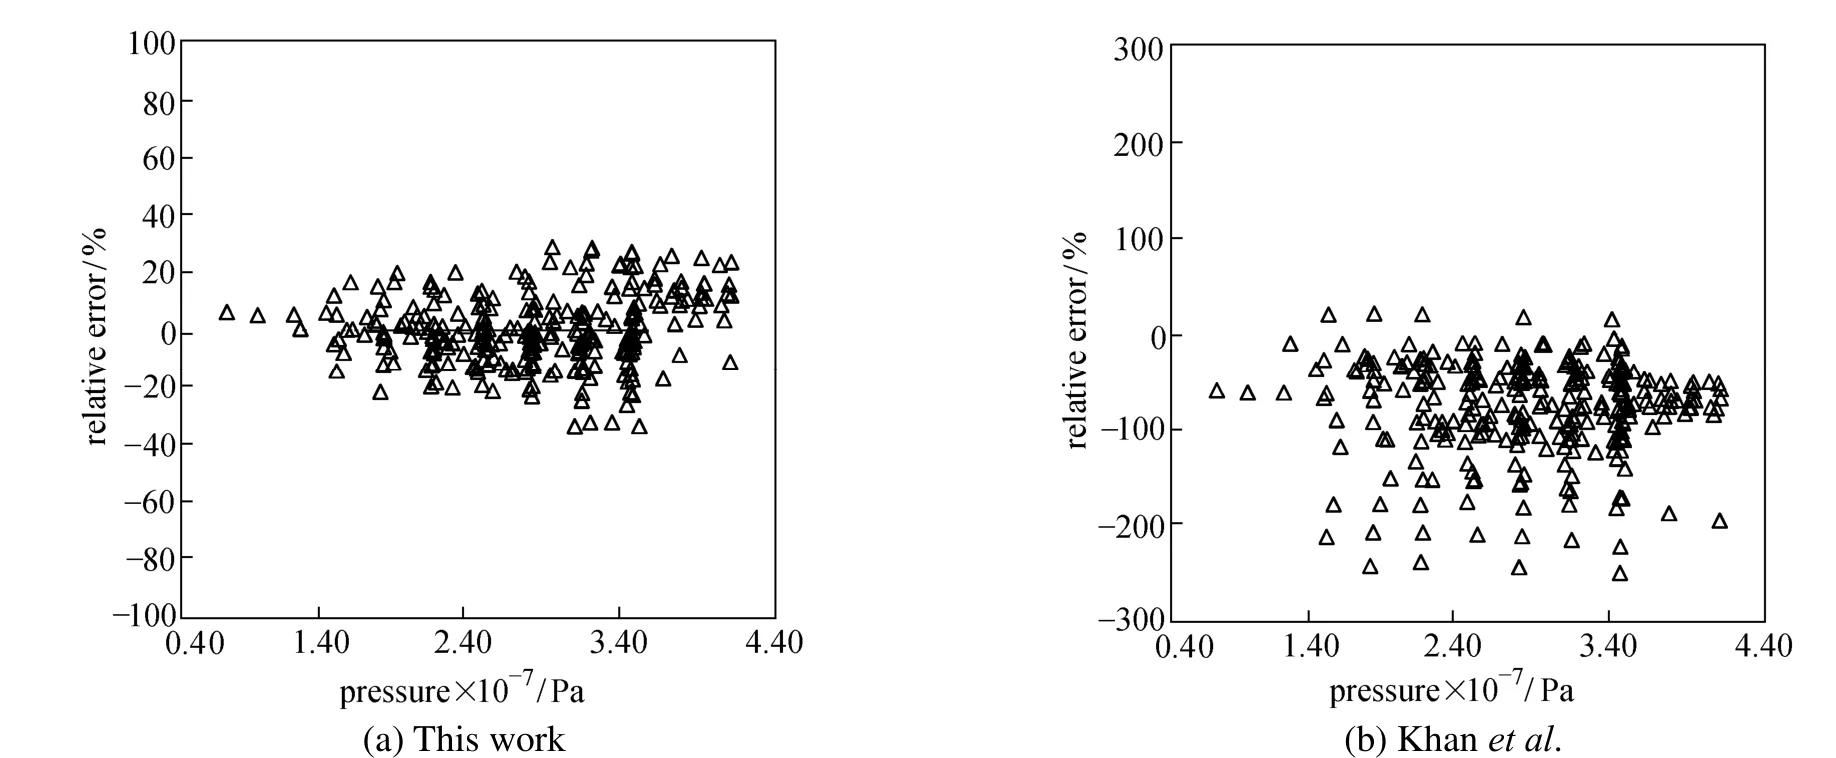
Figure 6 Error distribution for under-saturated oil viscosity correlations

Figure 6 Error distribution for under-saturated oil viscosity correlations
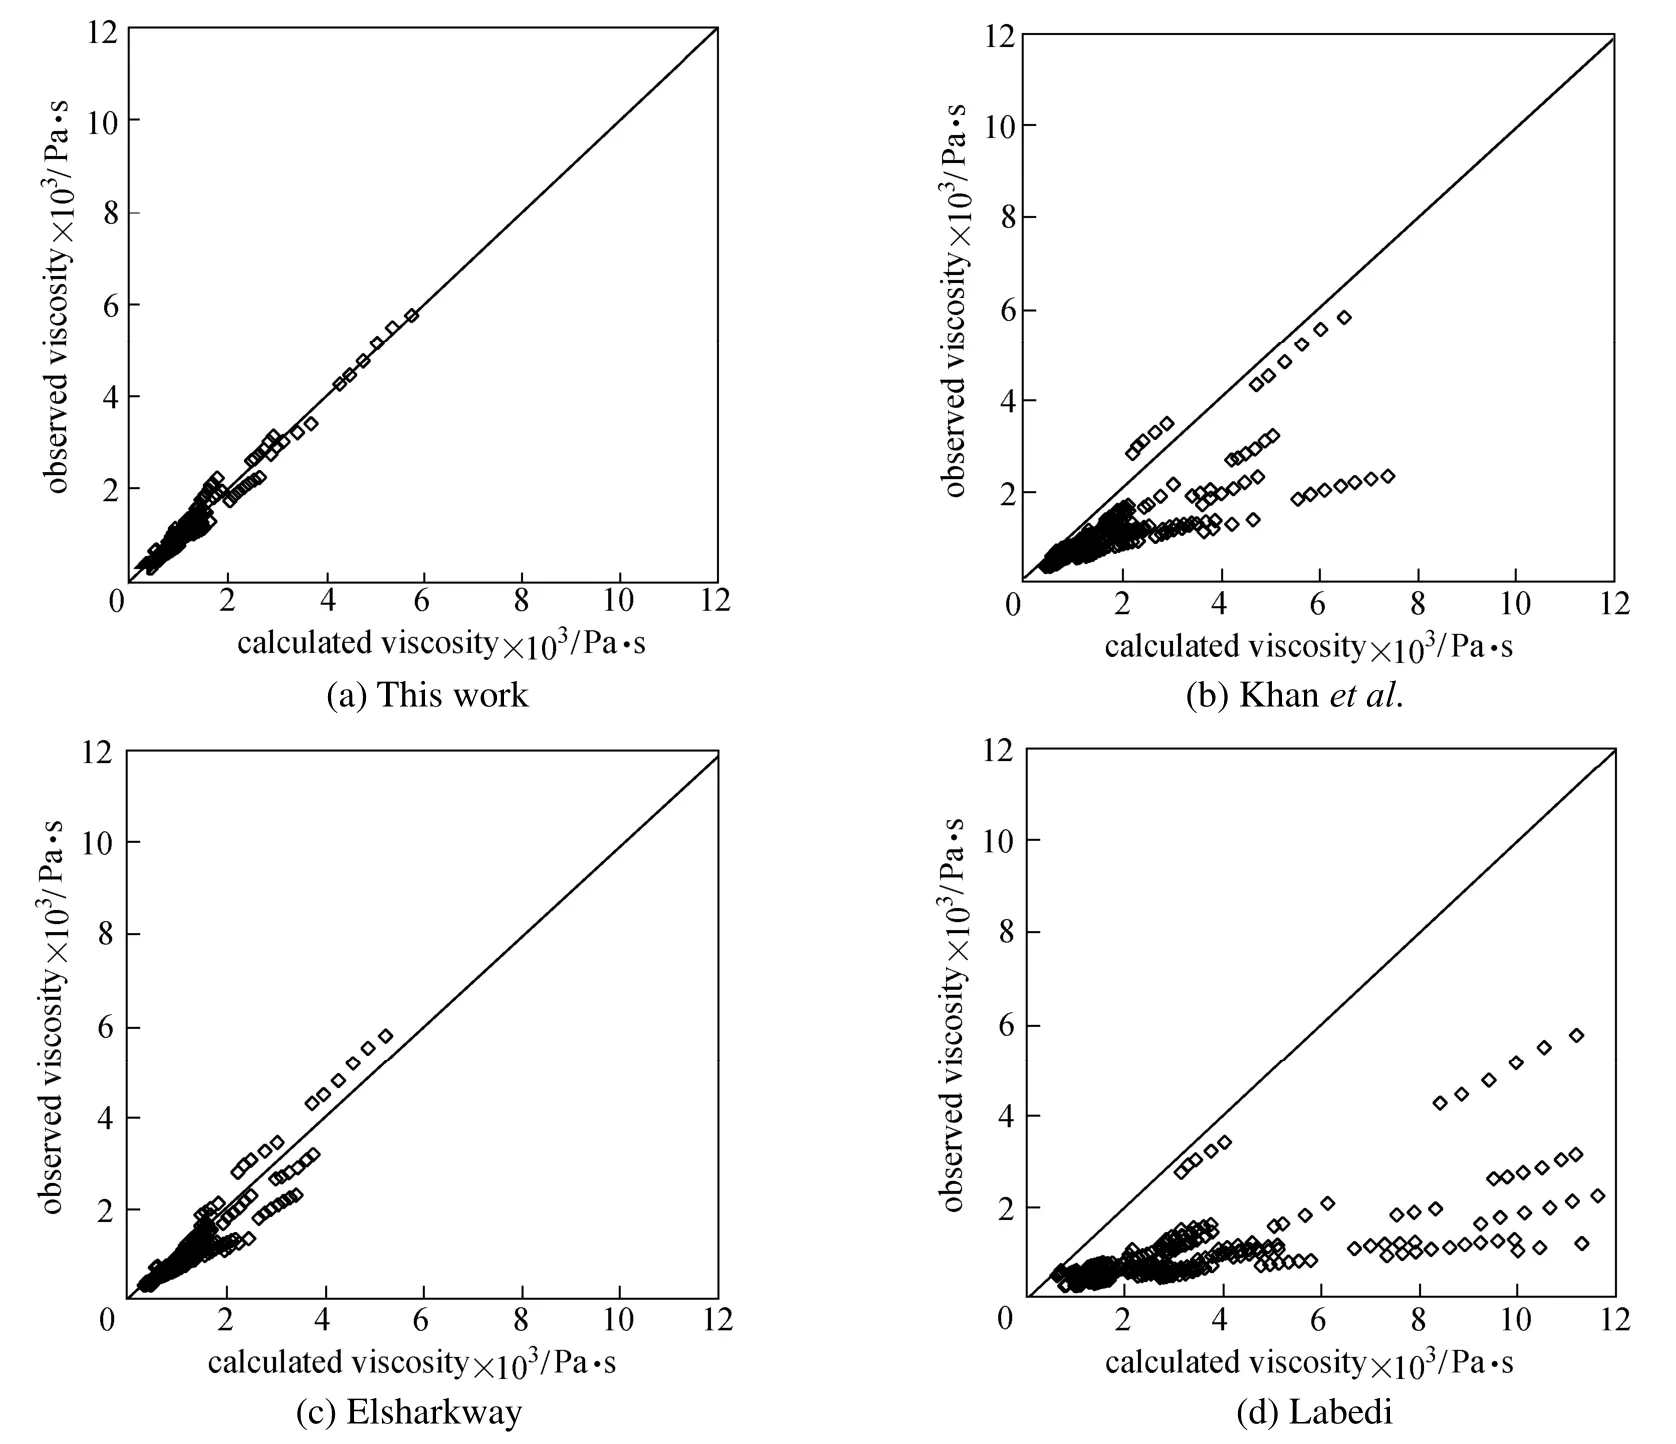
Figure 7 Performance plot for under-saturated oil viscosity correlations
NOMENCLATURE
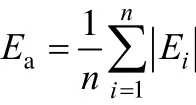
Eaaverage absolute percent relative error
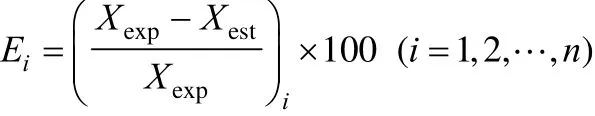
Eipercent relative error
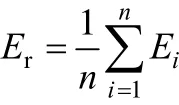
Eraverage percent relative error
i observation index
n number of data points
P pressure, Pa
Pbbubble point pressure, Pa
RSsolution gas-oil ratio
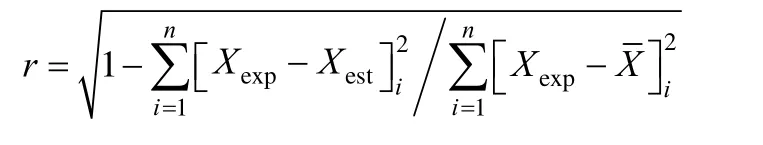
r correlation coefficient
S standard deviation
Tfreservoir temperature, °C
Xestestimated value for any fluid property
Xexpexperimental value for any fluid property
γggas specific gravity (air=1.0)
γooil specific gravity (water=1)
μboil viscosity below the bubble point, Pa·s
μounder-saturated oil viscosity, Pa·s
μobsaturated oil viscosity, Pa·s
μoddead oil viscosity, Pa·s
θr(Tf+ 459.67)/459.67=relative temperature
REFERENCES
1 Ahmed, T., Hydrocarbon Phase Behavior, Gulf Publishing Company, Houston, 424 (1989).
2 Egbogah, E.O., Ng, J.T., “An improved temperature-viscosity correlation for crude oil systems”, J. Pet. Sci. Eng., 4 (3), 197-200 (1990).
3 Burg, P., Selves, J.L., Colin, J.P., “Prediction of kinematic viscosity of crude oil from chromatographic data”, Fuel, 76 (11), 1005-1011 (1997).
4 Riazi, M.R., Al-Sahhaf, T.A., “Physical properties of heavy petroleum fractions and crude oils”, Fluid Phase Equilib., 117 (1-2), 217-224 (1996).
5 Martín-Alfonso, M.J., Martínez-Boza, F.J., Navarro, F.J., Fernández, M., Gallegos, C., “Pressure-temperature-viscosity relationship for heavy petroleum fractions”, Fuel, 86 (1-2), 227-233 (2007).
6 Beal, C., “The viscosity of air, water, natural gas, crude oil and its associated gases at oil field temperature and pressures”, Trans. AIME, 165 (11), 94-115 (1946).
7 Moharam, H.M., Al-Mehaideb, R.A., Fahim, M.A., “New correlation for predicting the viscosity of heavy petroleum fractions”, Fuel, 74 (12), 1776-1779 (1995).
8 Das, S. K., “Vapex: An efficient process for the recovery of heavy oil and bitumen”, SPE J., 3 (3), 232-237 (1998).
9 Bergman, D.F., Sutton, R.P., “Under saturated oil viscosity correlation for adverse conditions”, In: SPE Annual Technical Conference and Exhibition (SPE103144), San Antonio, 20 (2006).
10 Khan, S.A., Al-Marhoun, M.A., Duffuaa, S.O., Abu-Khamsin, S.A.,“Viscosity correlations for Saudi Arabian crude oils”, SPE Annual Technical Conference and Exhibition, (SPE 15720), Bahrain, 251-259 (1987).
11 Dexheimer, D., Jackson, C.M., Barrufet, M.A., “A modification of Pedersen’s model for saturated crude oil viscosities using standard black oil PVT data”, Fluid Phase Equilib., 183-184, 247-257 (2001).
12 Al-Marhoun, M.A., “Evaluation of empirically derived PVT properties for Middle East crude oils”, J. Pet. Sci. Eng., 42 (2-4), 209-221 (2004).
13 Jaubert, J.N., Avaullee, L., Souvay, J.F., “A crude oil data bank containing more than 5000 PVT and gas injection data”, J. Pet. Sci. Eng., 34 (1-4), 65-107 (2002).
14 Beggs, H.D., Robinson, J.R., “Estimating the viscosity of crude oil systems”, J. Pet. Technol., 27 (9), 1140-1141 (1975).
15 Kartoatmodjo, T., Schmidt, Z., “Large data bank improves crude physical property correlations”, Oil Gas J., 92 (27), 51-55 (1994).
16 Vazquez, M., Beggs, H.D., “Correlations for fluid physical property prediction”, J. Pet. Technol., 32 (6), 968-970 (1980).
17 Chew, J.N., Connally Jr., C.A., “A viscosity correlation for gas-saturated crude oils”, Pet. Trans. AIME, 216, 23-25 (1959).
18 Elsharkawy, A.M., Alikhan, A.A., “Models for predicting the viscosity of Middle East crude oils”, Fuel., 78 (8), 891-903 (1999).
19 Labedi, R., “Improved correlations for predicting the viscosity of light crudes”, J. Pet. Sci. Eng., 8 (3), 221-234 (1992).
20 Ikiensikimama, S.S., Ogboja, O., “Evaluation of empirically derived oil viscosity correlations for the Niger Delta crude”, J. Pet. Sci. Eng., 69 (3-4), 214-218 (2009).
21 Mahmood, M.A., Al-Marhoun, M.A., “Evaluation of empirically derived PVT properties for Pakistani crude oils”, J. Pet. Sci. Eng., 16 (4), 275-290 (1996).
APPENDIX
A1 Saturated oil viscosity models
A1.1 Beggs and Robinson [14]

A1.2 Labedi [19]
At the bubble-point,

Below the bubble-point,
A1.3 Kartoatmodjo and Schmidt [15]
A1.4 Khan et al. [10]
At the bubble-point, Below the bubble-point,

A1.5 Elsharkway [18]
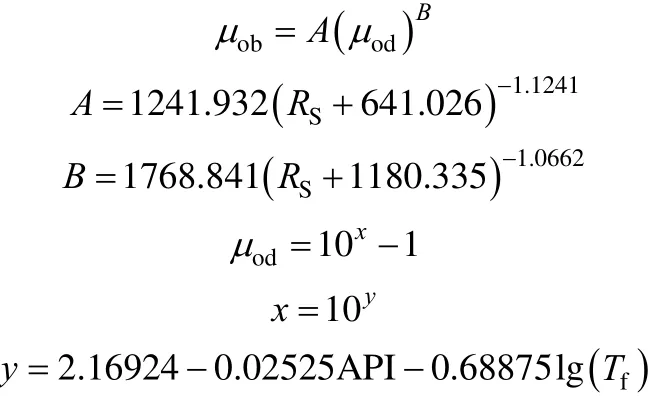
A2 Undersaturated oil viscosity models
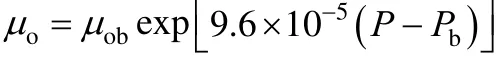
A2.1 Elsharkway [18]

A2.2 Khan et al. [9]
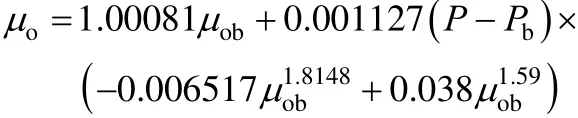
A2.3 Kartoatmodjo and Schmidt [15]
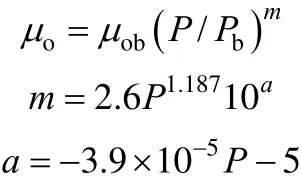
A2.4 Vazquez and Beggs [16]
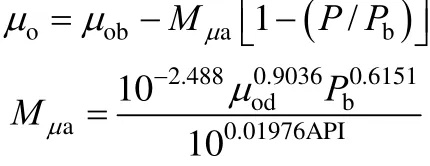
A2.5 Labedi [19]
A3 Statistical analysis
A3.1 Percent relative error
A3.2 Average percent relative error
A3.3 Average absolute percent relative error
A3.4 Standard deviation

A3.5 Correlation coefficient
where
CHEMICAL ENGINEERING THERMODYNAMICS
Chinese Journal of Chemical Engineering, 22(3) 346—354 (2014)
10.1016/S1004-9541(14)60017-3
2012-06-19, accepted 2013-01-15.
*To whom correspondence should be addressed. E-mail: m_taghizadehfr@yahoo.com
 Chinese Journal of Chemical Engineering2014年3期
- Chinese Journal of Chemical Engineering的其它文章
- A Bi-component Cu Catalyst for the Direct Synthesis of Methylchlorosilane from Silicon and Methyl Chloride
- Hydrodynamics and Mass Transfer of Oily Micro-emulsions in An External Loop Airlift Reactor
- Effects of Shape and Quantity of Helical Baffle on the Shell-side Heat Transfer and Flow Performance of Heat Exchangers*
- A Contraction-expansion Helical Mixer in the Laminar Regime*
- Preparation and Characterization of Sodium Sulfate/Silica Composite as a Shape-stabilized Phase Change Material by Sol-gel Method*
- Determination of Transport Properties of Dilute Binary Mixtures Containing Carbon Dioxide through Isotropic Pair Potential Energies