
表面增强拉曼光谱研究自组装单分子层在化学接触和纳米隔绝下的分子振动活性变化
2014-09-17 06:59李柏霖朱沛志卢晓林
物理化学学报 2014年4期
周 杰 李柏霖 朱沛志 卢晓林,,*
(1浙江理工大学化学系,教育部先进纺织材料与制备技术重点实验室,杭州310018;2东南大学生物科学与医学工程学院,生物电子学国家重点实验室,南京210096;3扬州大学化学化工学院,江苏扬州225009)
1 Introduction
The rapid development of the nanotechnology today is deeply rooted in its ability of integrating with other research areas within physics,chemistry,biology,and materials science,etc.One of the mostly studied nanoscale materials is the metal nanoparticle(MNP)due to its broad applications in catalysis,photovoltaics,microelectronics,biological diagnostics,and therapeutics,etc.1-4It is well recognized that MNPs can provide multiple functional properties related to optics,magnetics,and thermotics.For example,in order to serve as a biosenor,the surfaces of MNP need to be functionalized with specific molecular groups,such as fluorescence or vibrational chromophores.It is thus of great importance to characterize the spectroscopic activity or sensitivity of the corresponding molecular groups attached to the surfaces of MNPs.One of the commonly used characterization techniques is surface enhanced Raman scattering(SERS)which can provide the huge enhanced vibrational signals.5,6Excellent work has been done to illustrate this issue and successfully increase the detection resolution.7-9However,with respect to SERS itself,there still remains certain fundamental questions,one of which is,whether the high-order effect can contribute to the observed vibrational signals during a SERS process.10-15As discussed in previous literature,11,12the quadrupole polarizability may operate significantly comparable to the normal electric dipole polarizability which can make normal inactive vibrational modes to be active when a field gradient exists near the metal surface.In a SERS study on 1,4-benzenedithiol(BDT)adsorbed on silver colloids,13,14the appearance of some weak ungerade vibrations were attributed to either the quadrupole effect or the reduced symmetry associated with the flat adsorption geometry of BDT on the Ag surface.Given the assignment uncertainty of such vibrational modes,in this paper,we used 1,4-benzenedithiol as probe molecules and prepared samples of BDT in several distinct geometries.Via the SERS measurement for such BDT samples,we can easily recognize the origin of some usually ambiguous weak vibrational modes.In addition,our experimental method presented in this paper provides an easy framework which can be applied to study the metal-organic hybrid materials in the nanoscale.
2 Experimental
Basically we had nine BDT samples binding in different geometries and/or chemical states,six of which were sequentially bulk BDT(bBDT),BDT ditholate,BDT adsorbed onto the silver(Ag)nanoparticles(BDT-AgNP),oligomer BDT adsorbed onto the Ag nanoparticles(nBDT-AgNP)(n=5-7),self-assembled monolayer of BDT on the gold(Au)substrate(BDT-Au),Ag nanoparticles-capped self-assembled monolayer of BDT on the gold substrate(AgNP-BDT-Au),Ag nanoparticles-capped self-assembled monolayer of oligomer BDT on the gold substrate(AgNP-nBDT-Au).The remaining two samples were nearly the same as those of AgNP-BDT-Au and AgNP-nBDT-Au;the only difference was that we sandwiched a thin layer of polymethylmethacrylate(PMMA)between the Ag nanoparticles and the self-assembled monolayer of BDT or nBDT on Au to prevent the formation of Ag―S bonds(AgNP-PMMA-BDTAu and AgNP-PMMA-nBDT-Au).So the S―H bonds at the end BDT towards AgNP still existed.The simplified schematics of the nine samples for SERS measurement are shown in Fig.1.
Preparation of AgNP was following the reported method16with necessary modification.17 mg of silver nitrate(AgNO3)was dissolved in 100 mL of water and heated to boiling.2 mL of 1%(g·mL-1)sodium citrate-water solution was added with stirring.The mixture was kept on boiling for~30 min.The solution containing AgNP in greenish yellow was obtained and then stabilized for 2 h.The obtained AgNP was of a nearly spherical shape with an average diameter of 60 nm(there was a diameter distribution of the AgNP,mostly ranging from 40 to 80 nm)under the scanning electron microscope(JSM-5610,JEOL),as shown in Fig.2.BDT(99%,GC,Sigma-Aldrich)was dissolved in ethanol and then added into the AgNP solution to prepare a BDT-AgNP solution with a concentration of 0.4 mg·mL-1.BDT dithiolate solution was prepared by adding BDT-ethanol solution into 6 mol·L-1sodium hydroxide(NaOH)-water solution.Oligomer BDT(nBDT)was prepared by adding 1,3-dibromo-5,5-dimethylhydantoin(DBDMH)into the BDT-ethanol solution with stirring for more than 1.5 h.17nBDTAgNP was prepared in the same way as BDT-AgNP was prepared.The Au substrates were prepared by sputtering 100-nm layers of Au onto the clean glass slides using an ion sputter coater(JS-1600,Beijing Hetongchuangye Technology Co.,Ltd.).Before that,a 10-nm layer of nickel(Ni)was sputtered onto the glass slides to promote the adhesion between Au and glass slides.The Au substrates were immersed into the BDT and nBDT solutions respectively to form self-assembled monolayers(SAM)of BDT(BDT-Au)and nBDT on top.The AgNP solutions were then casting onto the SAM-capped Au substrates to makeAgNP-BDT-Au andAgNP-nBDT-Au samples.TheAg-NP-PMMA-BDT-Au and AgNP-PMMA-nBDT-Au samples were prepared by spin coating a thin layer of PMMA(2-4 nm thick measured by an EP3-SW ellipsometer,Nanofilm Technologie,GmbH)onto the SAM-capped Au substrates and then casting the AgNP solutions on top.The solid samples including AgNP-BDT-Au,AgNP-nBDT-Au,AgNP-PMMA-BDT-Au,and AgNP-PMMA-nBDT-Au were dried at 40°C under the vacuum oven for overnight.
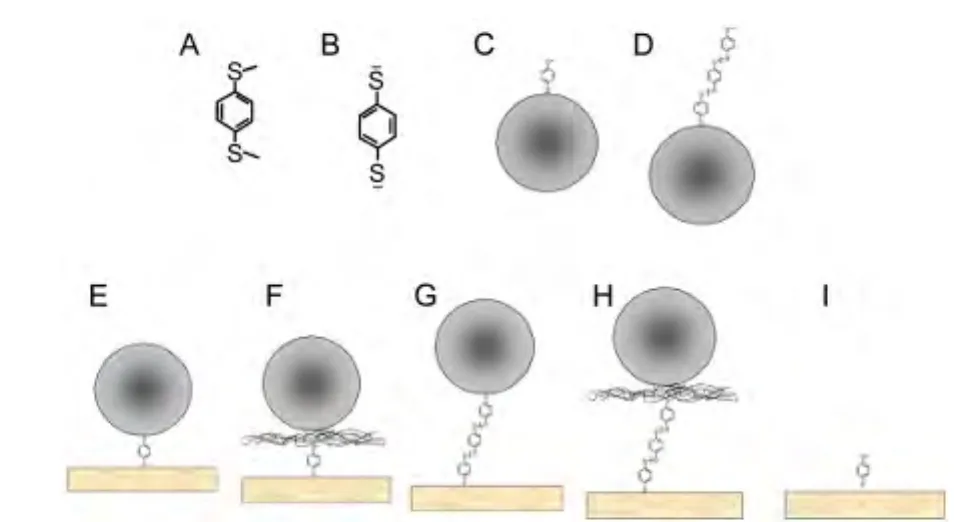
Fig.1 Schematics of the nine samples studied in this paper

Fig.2 SEM image of the as-preparedAgNP
3 Results and discussion
Fig.3 showed the Raman spectra of bBDT,BDT dithoilate,SERS spectra of BDT-Ag and nBDT-Ag in the range of 300 to 1600 cm-1where the fingerprint vibrational modes can serve as the characterization bands of the benzene ring.18,19Table 1 listed the assignment of the observed vibrational modes.14,15,18,19For bBDT,with considering the two S―H bonds,its symmetry becomes Csand thus all the vibrational modes should theoretically by be active(Fig.3(a)).For BDT dithiolate,its high symmetry of D2hmust make certain active bands under the Cssymmetry inactive.Indeed,in the Raman spectra of BDT dithiolate,the 16b,20a,6b,and 3 modes disappeared compared to that of bBDT,which is consistent with our anticipation(Fig.3(b)).Besides,the bandwidths of BDT dithiolate were broader than those of bBDT,indicating the inhomogeneity under ionization and solvation in the basic solution.In the SERS spectrum of BDT-AgNP(Fig.3(c)),similar to what has been reported,14,15several minor vibrational modes were observed including the 16b,20a,18a,and 19a modes.A flat adsorption geometry of BDT dianion on Ag which holds the C2vsymmetry has been proposed to be responsible for appearance of such minor vibrational modes.14,15In Table 1,we can see,if the BDT dianion was considered to belong to the C2vsymmetry rather than the D2hsymmetry,the vibrational modes of 16b,20a,18a,and 19a were Raman-active and this was consistent with the observed spectra in Fig.3.An alternative explanation was also given that the high-order effect related to the quadrupole polarizability could cause such vibrational modes when the field gradient was present in the vicinity of the Ag surface.11,12Since we prepared oligomer-BDT(nBDT with n=5-7),it could provide useful information when the S―H group in the vicinity of Ag surface was replaced by the S―S bond.Indeed,in the SERS spectrum of nBDT-AgNP(Fig.3(d)),the vibrational modes of 16b,20a,18a,and 19a modes did not appear.If the high-order effect did have the unnegligible contribution to the SERS process,such vibrational modes should be clearly observed not only in the SERS spectrum of BDT-AgNP but also in that of nBDT-AgNP since such modes are not involved in the S―H vibration.It is thus questionable to attribute such observed un-gerade vibrational modes of BDT-AgNP to the high-order effect or the flat geometry.The more authentic reason is still the symmetry difference between BDT dithiolate and BDT-AgNP.
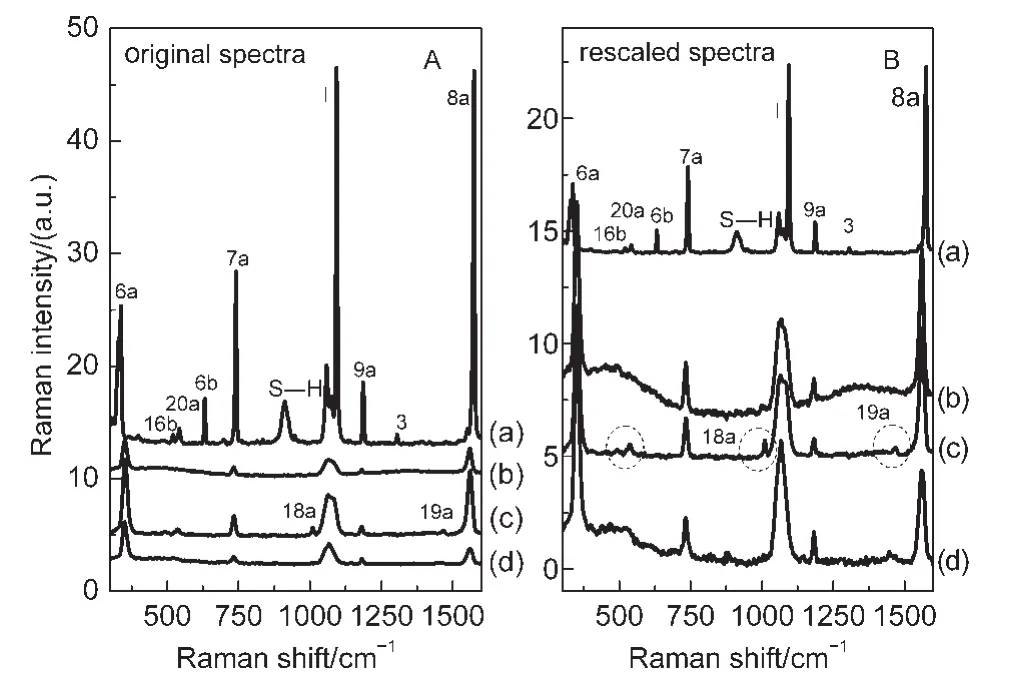
Fig.3 Raman spectra of(a)bBDT,(b)BDT dithiolate,(c)BDT-AgNP,and(d)nBDT-AgNP

Table 1 Assignment of vibrational modes of 1,4-benzenedithiol(BDT)14,15,18,19
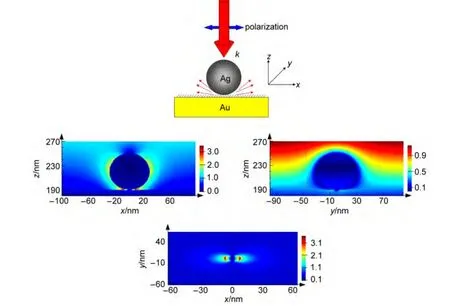
Fig.4 Images of FDTD calculation result
In order to gain the further evidence related to the origin of the observed ungerade vibrational modes,we prepared the geometrically sandwiched samples of AgNP-BDT-Au,AgNP-nBDT-Au,AgNP-PMMA-BDT-Au,and AgNP-PMMA-nBDTAu and collected their SERS spectra.As we know,for such samples,the SERS signals should come from the gap area between AgNP and Au where the coupling between the localized surface plasmon of AgNP and the surface polariton of the underneath Au were existing.20The finite-difference time-domain(FDTD)simulation result shown in Fig.4 suggested that the gap between AgNP and the Au substrate was the most intense area with respect to the distributed field.It is therefore that the vibrational modes in the SERS spectra shown in Fig.5 were all from the SAM of BDT at the gap area.As a comparison,the Raman spectrum of only a SAM of BDT on top of the Au substrate was also collected,as shown in Fig.5(a).Indeed,without the AgNP cap,there was no detectable vibrational signal at all,again suggesting the observed vibrational signals were coming from the gap area betweenAgNP and theAu substrate.
It is pretty clear from Fig.5 that when AgNP was directly deposited onto SAM of BDT,no ungerade vibrational modes were observed(AgNP-BDT-Au(Fig.5(b))and AgNP-nBDTAu(Fig.5(c)));when a blocked PMMA layer was placed between AgNP and SAM of BDT,the ungerade vibrational modes including 16b,20a,and 18a appeared again(AgNPPMMA-BDT-Au(Fig.5(d))and AgNP-PMMA-nBDT-Au(Fig.5(e))).Due to the relatively high noise-to-signal ratio,the 19a mode in SERS spectra of AgNP-PMMA-BDT-Au and Ag-NP-PMMA-nBDT-Au could hardly be identified.But this would not affect our judgment.Since in this case,the field gradient at the gap area(along the surface normal,from the AgNP to the Au substrate)was definitely not as significant as that in the vicinity of Ag surface(BDT-AgNP),the appearance of such vibrational modes can not be attributed to the quadrupole polarizability effect.Such vibrational modes can only arise from the reduced symmetry due to the protection of the PMMA layer to the end S―H bond of BDT and nBDT towardsAgNP.
4 Conclusions
In this paper,an experimental framework was worked out to illustrate the origin of certain ambiguous vibrational modes in the SERS spectra.Concerning the BDT molecules prepared in different geometries/states for the SERS measurement excited by the 1064 nm laser,no vibrational signals originated from the high-order effect were detected in the SERS spectra.The observed change of the vibrational signals was proved to be attributed to the symmetry change of the BDT molecules via chemical attachment and/or nano block.Although currently we can not make judgment whether the same conclusion can be drawn for the previous studies,our experimental framework can be feasibly transferred to study similar systems.We also believe that the experimental methodology provided in this paper can be generalized and applied to study other nanoscale hybrid materials,for instance microelectronic junctions,when using SERS as a characterization technique.
(1) Stratakis,M.;Garcia,H.Chem.Rev.2012,112(8),4469.doi:10.1021/cr3000785
(2) Cheon,J.;Lee,J.H.Accounts Chem.Res.2008,41(12),1630.doi:10.1021/ar800045c
(3) Zijlstra,P.;Orrit,M.Rep.Prog.Phys.2011,74(10),106401.doi:10.1088/0034-4885/74/10/106401
(4) Mahmoudi,M.;Azadmanesh,K.;Shokrgozar,M.A.;Journeay,W.S.;Laurent,S.Chem.Rev.2011,111(5),3407.doi:10.1021/cr1003166
(5) Fleischmann,M.;Hendra,P.J.;McQuillan,A.J.Chem.Phys.Lett.1974,26(4),163.
(6) Jeanmaire,D.L.;Van Duyne,R.P.J.Electroanal.Chem.Interfacial Electrochem.1977,84(1),1.doi:10.1016/S0022-0728(77)80224-6
(7) Nie,S.;Emory,S.R.Science 1997,275(5303),1102.doi:10.1126/science.275.5303.1102
(8) Kneipp,K.;Wang,Y.;Kneipp,H.;Perelman,L.T.;Itzkan,I.;Dasari,R.R.;Feld,M.S.Phys.Rev.Lett.1997,78(9),1667.doi:10.1103/PhysRevLett.78.1667
(9) Le Ru,E.C.;Etchegoin,P.G.Annu.Rev.Phys.Chem.2012,63(2012),65.
(10)Erdheim,G.R.;Birke,R.L.;Lombardi,J.R.Chem.Phys.Lett.1980,69(3),495.doi:10.1016/0009-2614(80)85112-8
(11) Sass,J.K.;Neff,H.;Moskovits,M.;Holloway,S.J.Phys.Chem.1981,85(6),621.doi:10.1021/j150606a002
(12) Moskovits,M.;DiLella,D.P.;Maynard,K.J.Langmuir 1988,4(1),67.doi:10.1021/la00079a012
(13) Polubotko,A.M.Phys.Lett.A 1990,146(1-2),81.doi:10.1016/0375-9601(90)90034-L
(14)Cho,S.H.;Han,H.S.;Jang,D.J.;Kim,K.;Kim,M.S.J.Phys.Chem.1995,99(26),10594.doi:10.1021/j100026a024
(15) Joo,S.W.;Han,S.W.;Kim,K.J.Colloid Interface Sci.2001,240(2),391.doi:10.1006/jcis.2001.7692
(16) Lee,P.C.;Meisel,D.J.Phys.Chem.1982,86(17),3391.doi:10.1021/j100214a025
(17) Khazaei,A.;Zolfigol,M.A.;Rostami,A.Synthesis 2004,2004(18),2959.
(18) Varsanyi,G.Vibrational Spectra of Benzene Derivatives;Academic Press:New York,1969.
(19) Varsanyi,G.Assignments for Vibrational Spectra of Seven Hundred Benzene Derivatives;Halsted Press:New York,1974;Vol.1.
(20) Kim,K.;Yoon,J.K.J.Phys.Chem.B 2005,109(44),20731.doi:10.1021/jp052829b
猜你喜欢
化工职业技术教育(2021年5期)2021-11-09
化工职业技术教育(2021年1期)2021-03-15
化工职业技术教育(2020年4期)2020-01-19
今日农业(2019年13期)2019-08-12
中国粮油学报(2018年12期)2018-03-19
价值工程(2017年2期)2017-02-06
化工学报(2016年3期)2016-03-14
创新科技(2015年3期)2015-12-24
亚太教育(2015年18期)2015-02-28
原子能科学技术(2014年3期)2014-02-28
