
Numerical Simulations of Local Circulation and Its Response to Land Cover Changes over the Yellow Mountains of China
2015-01-05 02:02WANGDie王蝶MIAOJunfeng苗峻峰andZHANGDaLin张大林
关键词:张大
WANG Die(王蝶),MIAO Junfeng∗(苗峻峰),and ZHANG Da-Lin(张大林)
1 Key Laboratory of Meteorological Disaster of Ministry of Education, Nanjing University of Information Science&Technology,Nanjing 210044,China
2 Department of Atmospheric and Oceanic Science,University of Maryland,College Park,Maryland 20742,USA
Numerical Simulations of Local Circulation and Its Response to Land Cover Changes over the Yellow Mountains of China
WANG Die1(王蝶),MIAO Junfeng1∗(苗峻峰),and ZHANG Da-Lin2(张大林)
1 Key Laboratory of Meteorological Disaster of Ministry of Education, Nanjing University of Information Science&Technology,Nanjing 210044,China
2 Department of Atmospheric and Oceanic Science,University of Maryland,College Park,Maryland 20742,USA
In this study,local circulations and their responses to land use and land cover(LULC)changes over the Yellow Mountains of China are examined by using Weather Research and Forecast(WRF)modelsimulations of a selected case under weak-gradient synoptic conditions.The results show that mountain-valley breezes over the region are characterized by an intense upslope flow lasting for about 11 h(0600-1700 LST)along the northern slope during daytime.A convergence zone occurs at the mountain ridge and moves northwestward with time.During nighttime,wind directions are reversed,starting first at higher elevations.Three sensitivity experiments are conducted,in which the current land covers are replaced by grassland,mixed forest,and bare soil,respectively,while keeping the other model conditions identical to a control run.These sensitivity simulations are designed to represent the changes of LULC over the Yellow Mountains area during the past decades.The results show that changes in land cover could affect substantially land-surface and atmosphere interactions,the evolution of local circulations,and characteristics of the planetary boundary layer(PBL).Significant differences are noted in horizontal winds,and sensible and latent heat fluxes.On the other hand,when the surface is covered by mixed forest,slight variations in local winds and surface variables are identified.The results appear to have important implications to urban planning and constructions as well as the transport of air pollutants over mountainous regions.
Yellow Mountains,local circulation,land cover change
1.Introduction
Thermally driven mountain-valley flows have been of considerable interest in observational and theoretical studies for more than a decade;see the bibliographies compiled by Atkinson(1981)for early studies in the 19th century.Some basic concepts of valley breezes were developed in the 1930s,based on detailed observations in Alpine Europe(Wagner,1932a, b,1938;Ekhart,1934).Subsequent studies examined various aspects of thermally driven up-and downvalley flows in many parts of the world,ranging from smallvalleys ofa few kilometers to the largest valley in the Himalayas(Atkinson,1981;Baji´c,1990;Mursch-Radlgruber,1995;Egger et al.,2000).
In essence,the thermally-induced pressure difference between different elevations in a valley is considered as the main driving force for valley breezes. Wagner(1932b)observed air-mass changes between mountainous areas and surrounding plains,and identified three mechanisms that are responsible for slope wind circulations,along-valley flows,and interaction between valley breezes and large-scale air masses, respectively.These thermally driven wind systems mainly develop under weak-gradient synoptic conditions.Whiteman and Doran(1993)produced a conceptual model of four idealized relations between synoptic-scale flows and valley breeze directions.Theyalso considered thermal forcing,descending momentum,and pressure-triggering to be the determining factors of the valley-wind directions in the Tennessee valley.Depending on the time of day,however,some other mechanisms could occur.For example,countercurrents ofthe valley winds could be occasionally generated,as found in the Upper Rhine valley by Wippermann and Groβ(1981).
Most of the previous modeling studies of mountain-valley breezes were performed with twodimensional(2D)hydrostatic models that allow for comprehension of basic characteristics involved.An important conclusion from these 2D models is that the cross-valley circulations play important roles in warming the heart of valleys,so the horizontal structures of the mountain-valley breezes can be clearly identified (Kondo et al.,1989;Egger,1990;Noppel and Fiedler, 2002).In addition,severalthree-dimensional(3D)numerical models with realistic topography have been conducted to study the 3D structures and evolution as the mechanisms whereby the associated local circulations are induced(Cairns and Corey,2003;Cai et al.,2007;Liu et al.,2009,2012;Horvath et al.,2012; Jim´enez and Dudhia,2012;Miao,2014).
The Yellow Mountains are located near Huangshan City in Anhui Province,East China.In the subtropical zone,the Yellow Mountains have a typical humid monsoon climate.Ever-changing weather is very usual in this mountainous area,and the complex terrain has a significant influence on the regional weather and climate.Most scholars,however,focused on the clouds and mesoscale rainstorms in the Yellow Mountains region under synoptic-scale conditions,using models with simple dynamic frameworks and physical parameterizations(Zhai et al.,1995;Wu et al., 2005;Chen and Zhao,2006).Few studies have paid close attention to the mountain-induced local circulations and PBL structures,especially using 3D numerical models.
Furthermore,land cover types in the Yellow Mountains area have been modified significantly since the 1980s.This region will be reshaped continuously by the exploitation of natural scenic spots and the process of urbanization in the near future.Land cover changes have far-reaching effects on the characteristics of the PBL and regional land-atmosphere interaction(Pielke,2001;Miao et al.,2003;Pielke et al., 2007;Mahmood et al.,2011).Various numerical models have been used to study the impacts of land cover changes on horizontal winds,temperature,soil temperature,soil moisture,atmospheric water vapor content,convective cloud,and precipitation(Shen,1998; Crawford et al.,2001;Narisma and Pitman,2003; Gero and Pitman,2006;Sen Roy et al.,2011;Ma and Zhang,2015).Nevertheless,the latest studies associated with the Yellow Mountains concentrate on orographic effects instead of land cover changes.Consequently,it is essential to understand the impacts of different land cover types on the generation of local weather systems.
The purposes of our study are to(1)examine the 3D structures and evolution of mountain-valley winds over the Yellow Mountains of China,and(2)investigate their structural changes with respect to elevation and land cover type.They are achieved through numerical simulations of a selected case with large-scale weak-gradient air flows that occurred during 12-14 September 2011,using a higher version of the Weather Research and Forecasting(WRF)model with realistic terrain and land cover data.In this study,we focus not only on the characteristics of upslope and downvalley flows,but also on the evolution of the sensible and latent heat fluxes in this region.In addition,we attempt to revealthe influences of vegetation types on the local circulations.
2.Model description
The ARW-WRF model(Skamarock et al.,2008) is a mesoscale numerical model designed for a wide range of weather research and forecast problems.It is composed of a fully compressible,non-hydrostatic dynamical Euler core,with a terrain-following coordinate.Version 3.5.1 of the model is used in this study,and a two-way interactive,quadruply nested grid is configured,similar to Miao et al.(2007,2008). The nested domains(D1-D4)have(x,y)dimensions of 150×150,196×196,184×184,and 124×124,withgrid sizes of 27,9,3,and 1 km,respectively(Fig.1). The area of the Yellow Mountains is about 1200 km2, so 1-km horizontal resolution is sufficient to resolve fine-scale horizontal flow in the domain of primary interest.All the domains are centered at the peak location of the Yellow Mountains(30.15°N,118.15°E).D1 covers centraland eastern China,and is responsible for simulating large-scale circulations and synoptic-scale weather systems.The two intermediate domains(D2 and D3)are set up to capture mesoscale and local weather situations,and the innermost domain(D4) is the area of our major concern(Fig.2a).The three inner grids are located far enough away from the outermost boundaries so the associated solutions should not be seriously affected by the values at the outer boundaries during a 48-h integration period.The vertical grids for all domains consist of 35 levels ranging from the ground to 100 hPa.There are 20 levels within the lowest 2 km,which allow the modelto capture the fine enough characteristics of the mountain PBL.Figure 3 shows the land cover in D4 derived from the Moderate Resolution Imaging Spectroradiometer(MODIS) dataset in 2001.
Table 1 lists the physical parameterizations used in this study.The Yonsei University(YSU)PBL scheme(Hong et al.,2006)is chosen.It is a first order nonlocal scheme,with a counter-gradient term in the eddy-diffusion equation,and is modified in WRF V3 from the Hong et al.(2006)formulation by increasing the critical bulk Richardson number from 0 to 0.25 over land,therefore,enhancing mixing in the stable boundary layer(Hong and Kim,2008).Note that cumulus parameterization is not used in D3 and D4 (Miao et al.,2009).The WRF model initial conditions and the outermost lateral boundary conditions are obtained from the NCEP 1°resolution final reanalysis(FNL)data,with the latter updated every 6 h throughout the 48-h integrations.
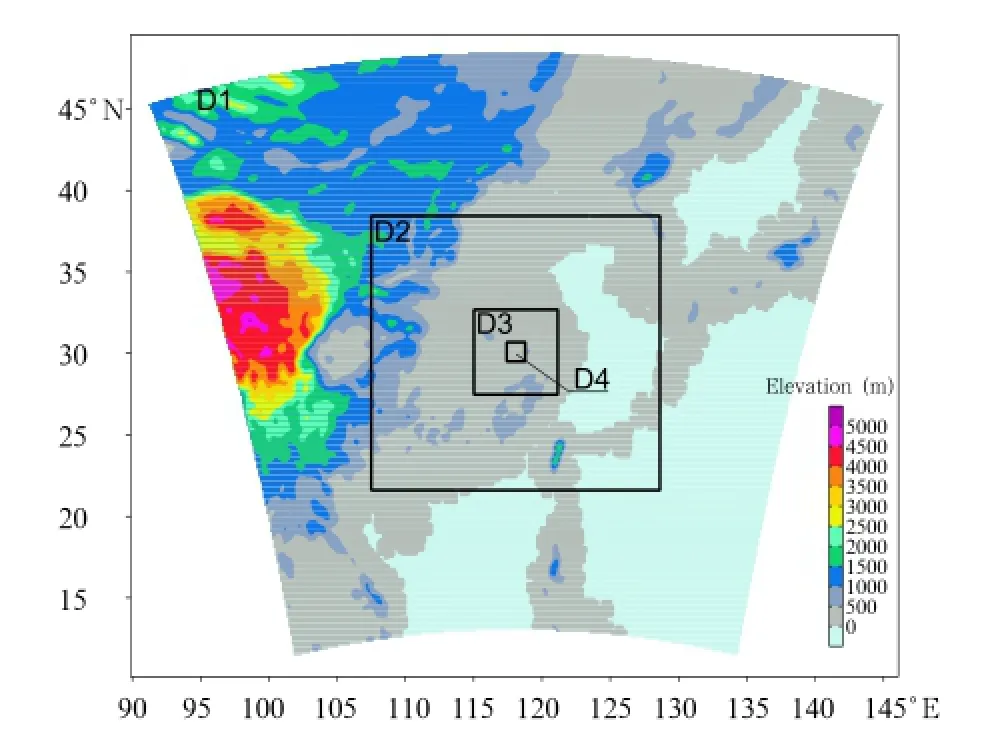
Fig.1.Model domains(D1,D2,D3,and D4)and topography(shaded).Bold solid lines(rectangle)denote the geographic locations of the nested grids.The central point is located at the mountain top(30.15°N,118.15°E).

Fig.2.(a)Topography of D4(color shaded at 200-m intervals).Line AB indicates the location of the vertical cross-section used in this study(along 118.15°E).Locations of four automated weather stations(AWSs)are marked by circle signs at Xiuning(XN),Zhaixi(ZX), Huangshan(HS),and Huangshanqu(HSQ).(b)Topography(terrain)height along line AB in(a)for convenience of later analysis.
3.Experimental design
The case of 12-14 September 2011 is selected forthis study because of the weak-gradient air flow and clear-sky conditions.During this period,southeastern China was dominated by an anticyclonic circulation, which would facilitate the isolation of mesoscale circulations associated with local topography and land cover changes.To demonstrate the important influences of modified surface land cover on mountainvalley breezes and the characteristics of the mountain PBL,a group of sensitivity tests are performed by denoting the simulation with the real topography and vegetation types as the control(CNTL)experiment. Following Miao et al.(2003)and Wang et al.(2013), three sensitivity runs are conducted,which are identical to the CNTL experiment except for the land cover types replaced by uniform grassland(GRASS),mixed forests(FOREST),and bare soil(DESERT),respectively(Table 2).The quadruply nested-grid model is integrated for 48 h(from 0000 UTC 12 to 0000 UTC 14 September 2011).The first 16-h integrations are discarded as part of the model spin-up.In order to perform the model experiment,sufficient spin-up time should be taken into account.Jankov et al.(2007) and Skamarock and Klemp(2008)found that to prevent the occurrence of instabilities in the mesoscale numerical weather prediction(NWP)model,a minimum of 12-h spin-up time should be used.So 16 h is expected to be sufficient for our case.
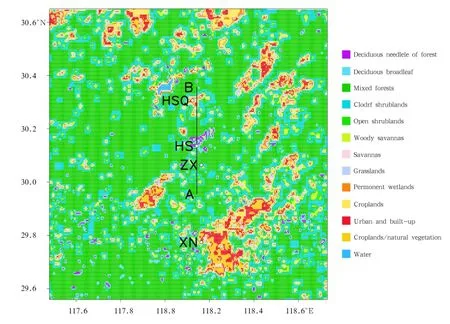
Fig.3.Land cover type of D4 with 30′′resolution data from the MODIS(2001)dataset.
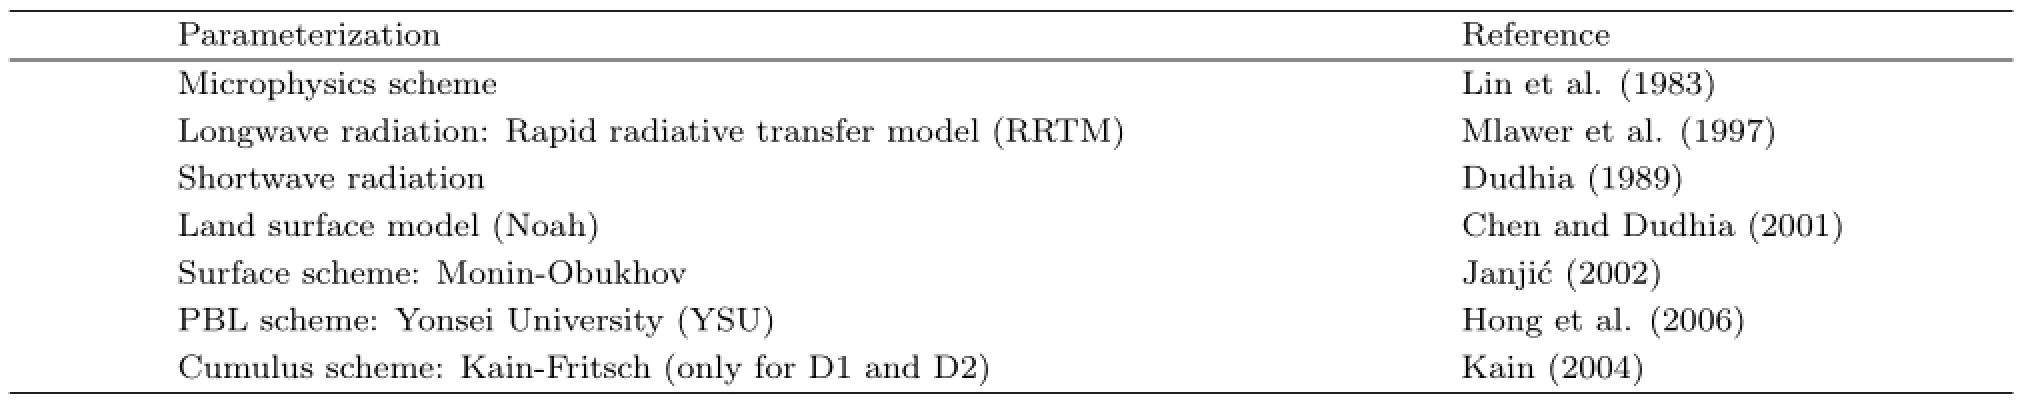
Table 1.WRF physical parameterizations
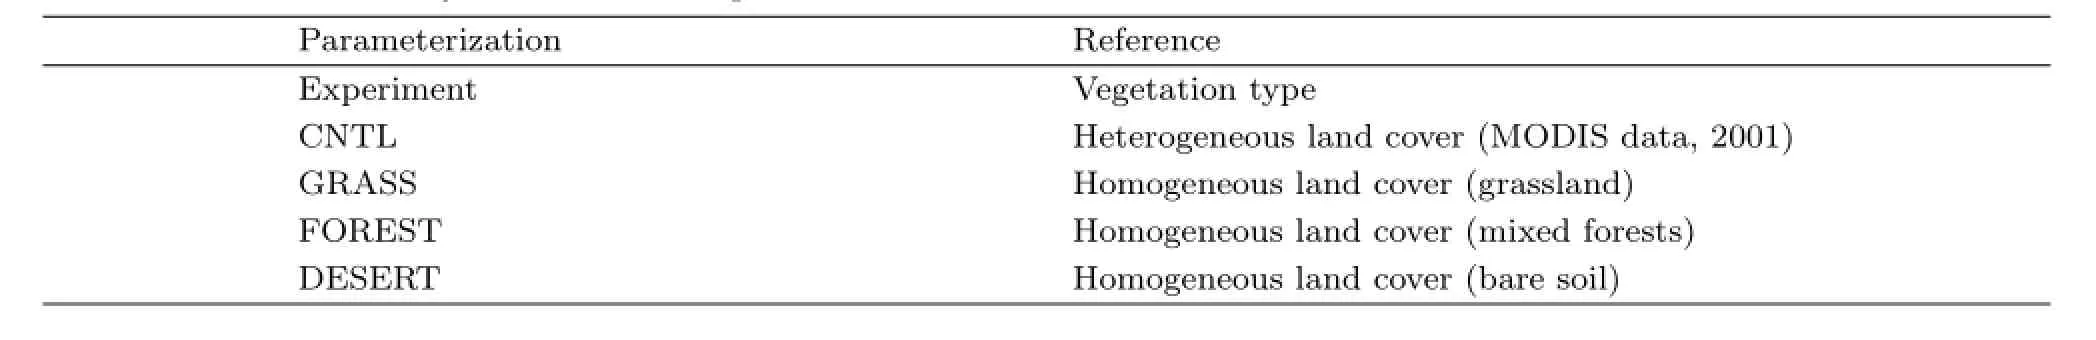
Table 2.Summary of numerical experiments
4.Results
4.1 Model verifications
It is highly desirable to evaluate the performance of the model simulation before it can be used to understand the 3D structures and evolution of mountainvalley winds over the Yellow Mountains.For this purpose,the 2-m surface temperatures and the 10-m surface winds from the simulation are compared with observations.The Zhaixi(ZX),Xiuning(XN), Huangshan(HS),and Huangshanqu(HSQ)automated weather stations(AWSs)are selected for the modelobservation comparisons and analysing the detailed characteristics of the mountain PBL(Fig.4).Because they are all located near 118.15°E at different elevations,and are covered by different land cover types, and hence different soil moistures.The four representative AWSs can,to some extent,provide a relatively meaningful diurnal cycle of the structures and evolution of local mountain-valley circulations.The observations used for this study are available at hourly intervals and provided by Huangshan Meteorological Bureau.The details of these AWSs are given in Table 3.
Figure 4 shows the diurnal variations of the simulated and observed 10-m wind speeds and 2-m temperatures at the four AWSs.As can be seen,the WRF model reproduces well the general evolutions of the two variables with slight deviations during almost a 24-h period.For example,at ZX,the daily maximum 2-m temperatures(at 1500 LST)reach 27℃in simulation and 32℃in observation.This could be attributed partly to the discrepancy between the real and model topography and land cover.
For 10-m wind speed,of interest to note is that surface winds at all AWSs remain less than 4 m s−1during the period of 1100-1800 LST when the turbulent mixed layer is developing.HS has a relatively stronger wind during this period due likely to the downward mixing of horizontal momentum at higher altitudes.However,HSQ experiences a significant growth in wind speed due likely to the presence of the larger-scale along-valley channeling flow during the evening hours.The wind is much steadier at XN. This is understandable because atmospheric flows over the mountain top tend to be influenced more by the larger-scale flow which is larger during nighttime.The discrepancies between the simulated and observed results may be attributed to the uncertainty ofthe atmospheric turbulence which makes the estimate of wind fields more difficult.
Despite the simulation errors and biases,the WRF simulation still captures reasonably well the dominant regional-scale features,and supplements the observations by providing more details in topographically induced local circulations.Thus,we may use the WRF-simulation fields in the next to study the structures and evolutions ofatmospheric flows over the complex terrain.
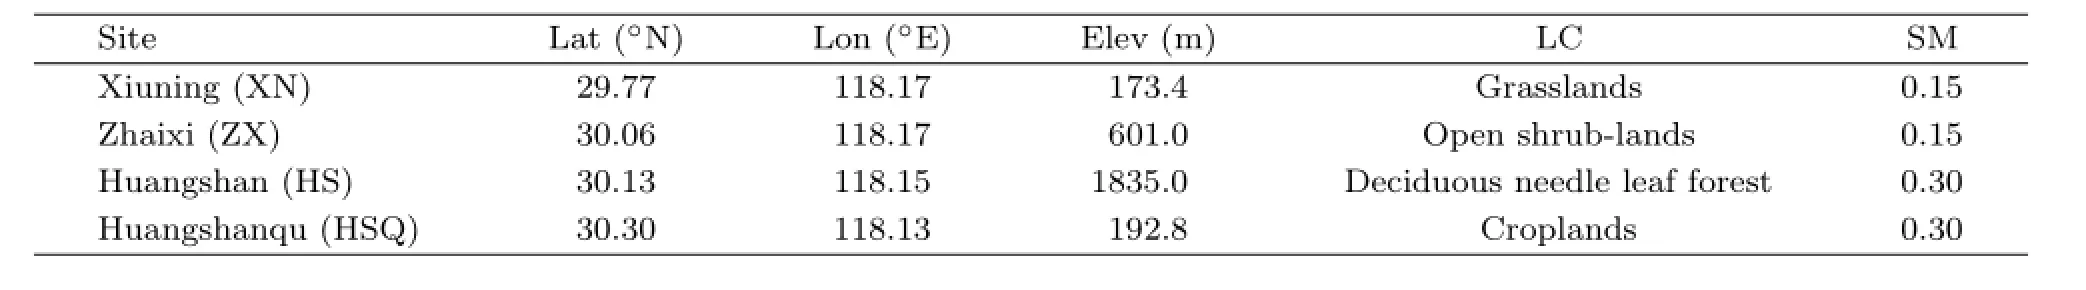
Table 3.Site,location,elevation,and other related information of the automated weather stations used in this study(Lat:latitude;Lon:longitude;Elev:elevation),as well as dominant land cover(LC)and soil moisture(SM) represented in D4 close to the AWSs

Fig.4.Diurnal variations of the observed and simulated(a1-a4)2-m temperatures and(b1-b4)10-m horizontal wind speeds at XN,HS,ZX,and HSQ AWSs on 13 September 2011.
4.2 Control experiment
4.2.1 Horizontalstructures of mountain-valley breezes
Figure 5 shows the time evolutions of surface winds along a meridional line across the Yellow Mountains’peak(also refer to Fig.2).There are weak katabatic(downslope)flows over the mountain slope (30.10°-30.25°N)after midnight(0000-0004 LST). The katabatic flows are mainly driven by outward longwave radiative cooling at the surface.Therefore, changes in wind direction occur shortly after sunrise, i.e.,when incoming shortwave radiative warming exceeds the radiative cooling.In addition,to a certain extent,weaker environmental flows intrude into the valleys,which generate an asymmetrical cross-valley circulation(Banta,1984,1985,1986).The asymmetry is characterized by different wind strengths,transition times,and locations of wind changes on the opposite sides ofthe Yellow Mountains.Specifically,the downslope flow turns into an upslope flow at 0600 LST on the north slope.The low-level winds are weak to begin with on the foot hills,but they increase gradually with time,as the mountain PBL grows in depth as a result of solar heating and the downward transport of stronger momentum aloft by turbulent eddies.The upslope flows converge at the mountain peak,where is a favorable location for convective development in the presence of potential instability.The life span of the upslope flow is roughly 11 h,covering most of the daytime period.After 1700 LST,due to the dominant larger-scale flow increases in the mountain peak’s altitude,an opposite flow regime(i.e.,downslope)appears as a result of the diminishing of the mountain PBL. Subsequently,the downward flow prevails and extendsfurther to the valley area;the maximum wind speed (up to 6.5 m s−1)appears after 2200 LST.Hence,there are two wind directionalchanges(i.e.,around 0600 and 1700 LST)on the mountain peak.
After subtracting the large-scale mean flows,Fig. 6 shows clearly that at 0200 LST downslope flows appear on the southern slope of the Yellow Mountains from the summit to the valley floor,but,on the northern valley,upslope flows appear.The flow pattern changes dramatically as the daytime begins.Figures 6c and 6d show the gradual development of upslope flows on the sloping mountains.A convergence line along the orientation of the mountain ridge extends from the north-east to south-west.After sunset near 1800 LST,the gradual growth in downslope winds is well captured,especially in the northern area,and they prevail over almost the entire Yellow Mountains area.
4.2.2 Vertical structures of mountain-valley breezes
Figure 7 shows the south-north vertical crosssections of in-plane flows across the mountain peak over D4.Under weak wind conditions,the thermal forcing tends to play more important roles than the mechanical forcing in determining the flow pattern over mountainous regions.During the early morning hours,free convection starts to develop because of enhanced solar radiation(Zhang and Anthes,1982),and upslope winds are observed over the sloping mountains(Figs.7a and 7b).At 1200 LST(Fig.7c), the tenfold vertical velocity(w×10),meridional wind speeds(v),together with the corresponding in-plane wind vectors,indicate a well-developed valley circulation.Specifically,the upslope flows converged at the mountain top are very strong.The maximum upward velocity is more than 6 m s−1near 30.15°N where a peak meridional wind speed of 2 m s−1is present.After noon,the solar radiation generally decreases.At 1500 LST(Fig.7d),the upward flows turn downward. By 1800 LST,background winds begin to increase,and replace the previous weak upslope winds not only at the mountain top but also on the southern slope(Fig. 7e).After 3 h(Fig.7f),the prevailing southerly flows above the surface occur over the mountain ridge and subside dramatically at the valley bottom on the steep leeward slope.The subsiding motion accompanied by adiabatic warming could induce a wake mesocyclone with increased pressure gradients to the north.In fact, Figs.7e and 7f show increased southerly flows beginning at the northern foothill of the mountain.The maximal mixed-layer height is roughly 1700 m.Note that the mountain area exhibits a typical localvertical circulation.
4.3 Sensitivity experiments
It is well known that the LULC over the Yellow Mountains area has changed substantially,as the other part of China,during the past 50-60 years.The proportion of LULC in the Yellow Mountains Scenic Area was 75%in the 1950s.This percentage rapidly declined to 73.6%in 1971,because of engineering construction,water and soil erosion,forest fire,and trampling.From then on,effective management and carefulprotection were implemented to increase vegetation cover,with the percentage reaching 93%in 2009.In the light of the above scenarios,we design three sensitivity experiments,which are similar to Miao et al. (2003)and Wang et al.(2013),to study the impacts of land cover changes on the local circulation patterns and structures ofthe PBL.Reducing plant height is considered first;in other words,inhomogeneous vegetation coverage is replaced by uniform grassland(GRASS)to show the effects of vegetation deterioration.Second,an FOREST experiment with homogeneous mixed forests is designed to examine the influenced mechanism of natural expansion of forests in recent years.Third,the influence of natural vegetation is worthy of examination.Thus,an extreme experiment(DESERT)is conducted,in which no vegetation is allowed over the Yellow Mountains.
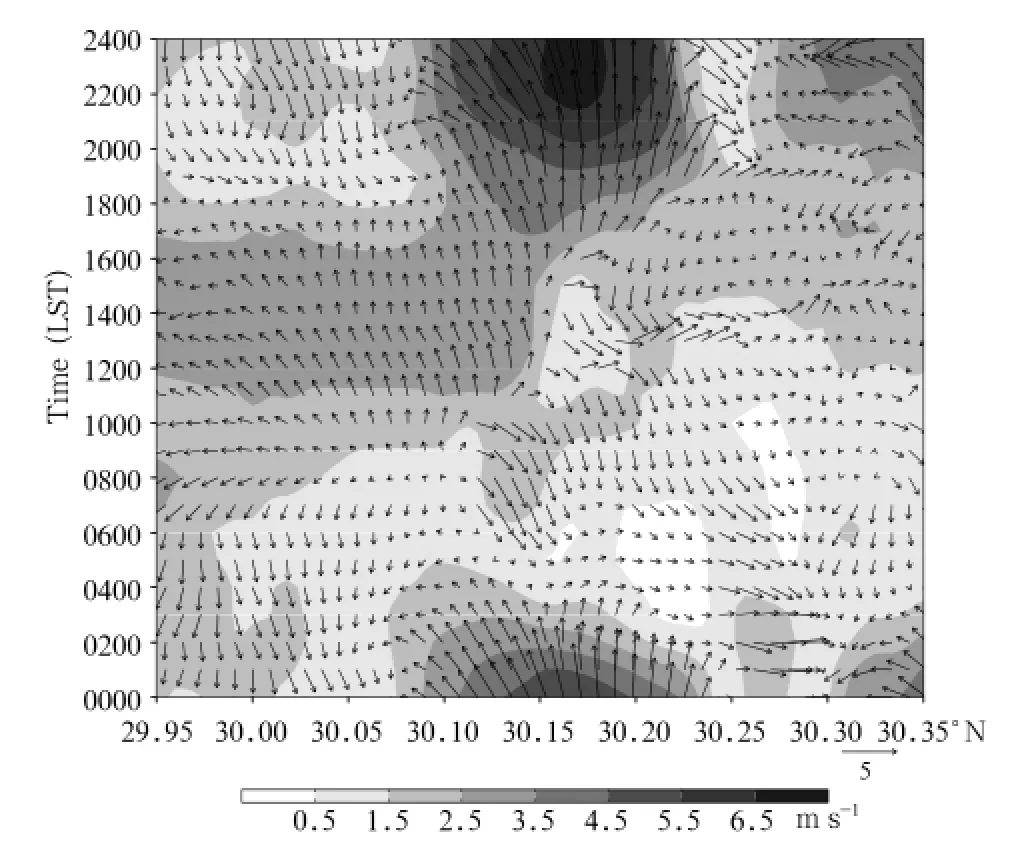
Fig.5.Meridional-time cross-section of the simulated 10-m wind vectors and speeds(shaded)along line AB,as given in Fig.2a,on 13 September 2011.Refer to Fig.2b for topography height along line AB.
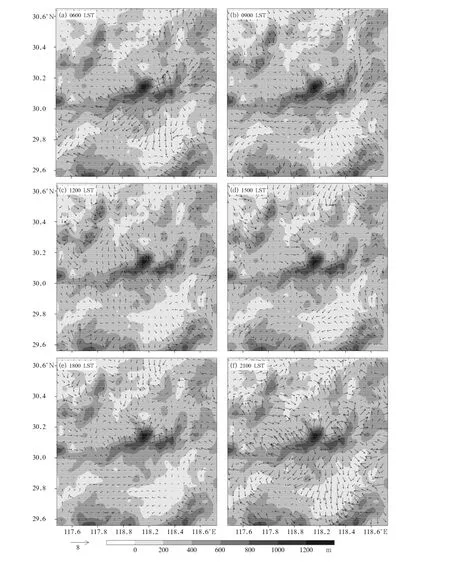
Fig.6.Simulated deviation of 10-m wind vectors that are obtained by subtracting the D4-domain averaged wind vector at(a)0600,(b)0900,(c)1200,(d)1500,(e)1800,and(f)2100 LST 13 September 2001.Topography is shaded at 200-m intervals.
Fig.7.Vertical cross-sections of the simulated in-plane flow vectors(vertical arrow length multiplied by 10),vertical velocity(w in m s−1;color shaded),and v-component(contoured at intervals of 0.5 m s−1)along line AB,as given in Fig.2a,at(a)0600,(b)0900,(c)1200,(d)1500,(e)1800,and(f)2100 LST 13 September 2011.
4.3.1 GRASS experiment
In the presence of uniform grassland,Fig.8a shows little differences in horizontal winds from 0400 to 1200 LST between the CNTL and GRASS experiments.The following half day,however,saw a slight increase of winds on the mountaintop(30.15°N),and a stronger downslope wind extending gradually from the steep slope to the valley(30.12°-30.3°N).
The horizontal wind field changes at 1500 LST mainly occur near the mountain regions(Yellow Mountains and Jiuhua Mountains),which may create more divergence centers compared with the CNTL run (see Fig.9a).This is similar to the main findings of McPherson and Stensrud(2005).
Figure 10 compares the diurnalvariations of sensible and latent heat flux among sensitivity experiments and control experiment.A variety of wind speeds and wind directions are present,and they tend to lead to different warming tendencies.The sensible heat flux in GRASS experiment decreases while the latent heat flux shows almost no change,compared to the CNTL experiment.
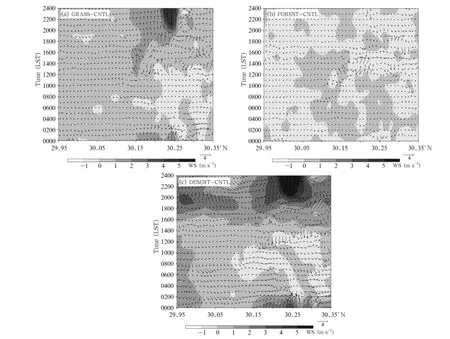
Fig.8.Meridional-time cross-sections of simulated differences in horizontal wind vectors between each sensitivity and control runs:(a)GRASS-CNTL,(b)FOREST-CNTL,and(c)DESERT-CNTL,superimposed with 10-m wind speeds (shaded),along line AB,as given in Fig.2a,on 13 September 2011.Refer to Fig.2b for topography height along line AB.
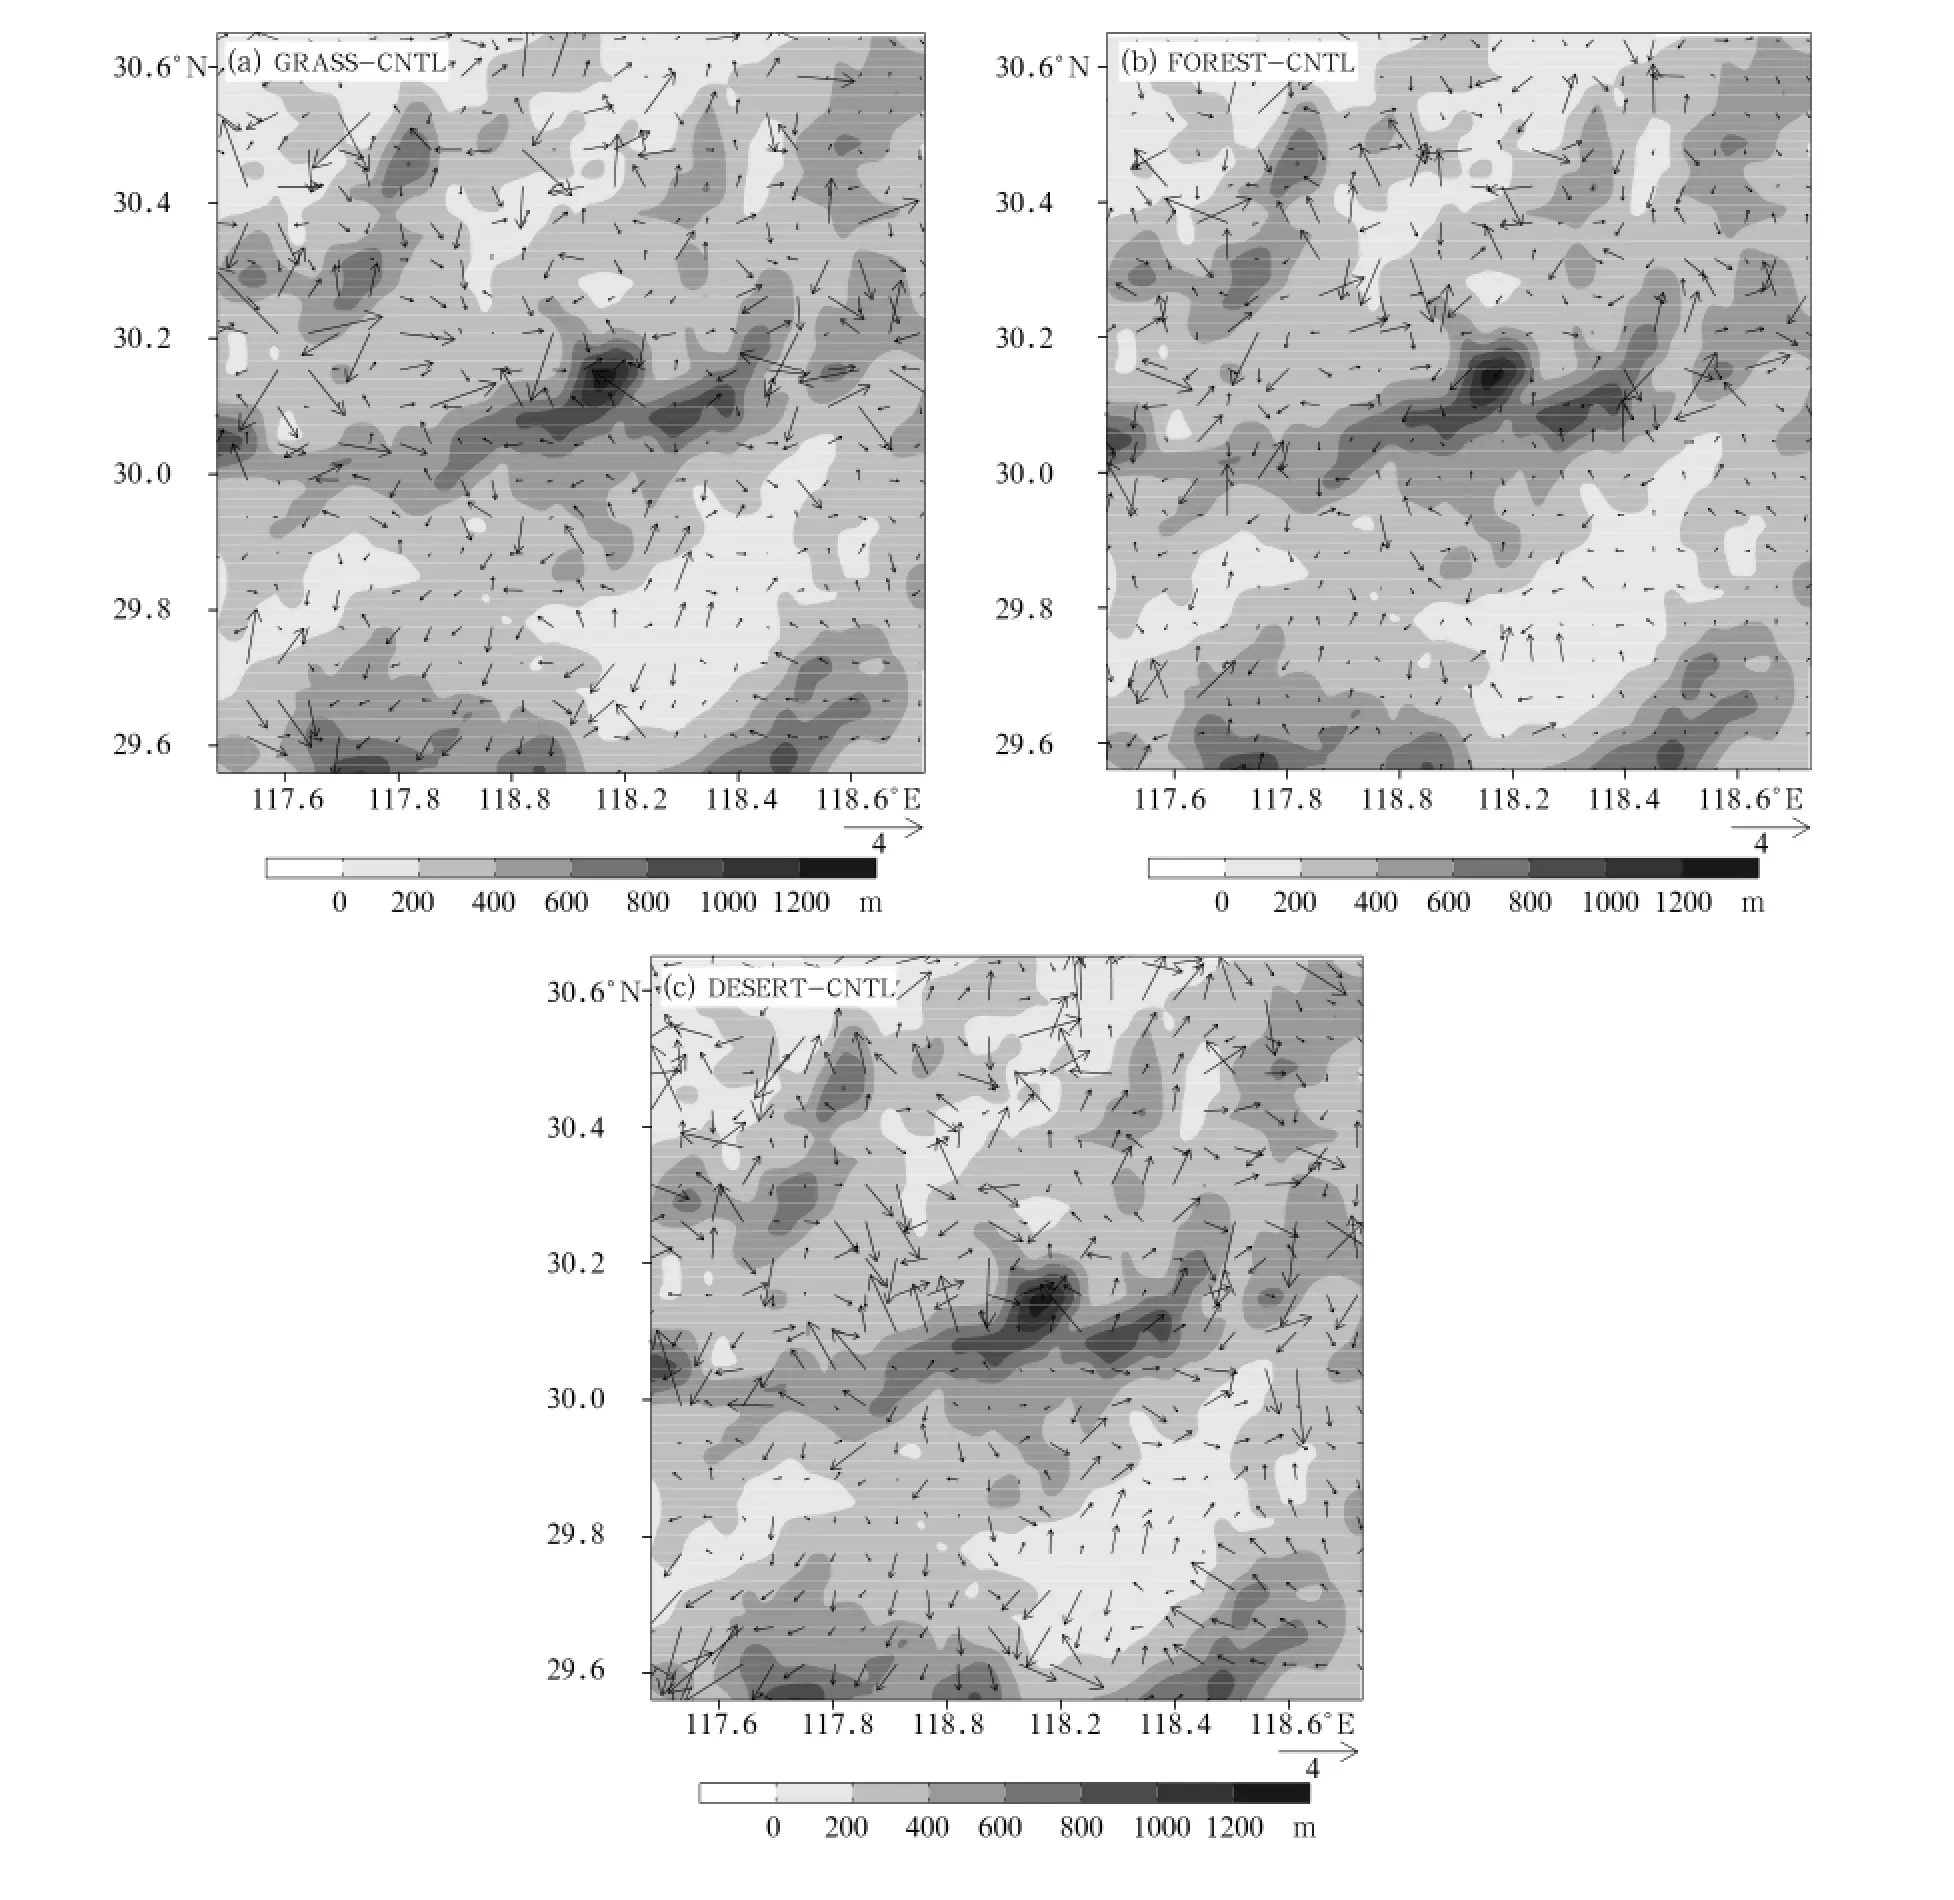
Fig.9.D4-domain differences for(a)GRASS-CNTL,(b)FOREST-CNTL,and(c)DESERT-CNTL of the 10-m horizontal wind vectors at 1500 LST 13 September 2011.Topography is shaded at 200-m intervals.
To some extent,the land cover changes could affect the wind fields,heat flux,and verticalmotion such that the associated local circulations and PBL characteristics are directly influenced.These differences are caused partly by the dynamical character of vegetation,and partly by the physiological and developmental status of vegetation.
Hence,we may state that when the original land cover is replaced by a homogeneous grass land,wind changes are relatively small,but more apparent over the mountain area. 4.3.2 FOREST experiment
In the presence of homogeneous mixed forests,a zonal-time cross-sectional analysis of the surface wind vectors reveals little differences between the FOREST and CNTL experiments(Fig.8b).Only a slight decline in wind speed occurs over the mountain area (30.13°-30.23°N)from 1000 to 1900 LST,because most of D4 in the CNTL run is covered by mixed forests(see Fig.3).
It is likely that increased plant height helps strengthen the barrier action and change the PBLstructures in different degrees because of the modifications in surface roughness length and heat fluxes.Figure 9b shows the differences in horizontal wind vectors and wind speed at 1500 LST over the Yellow Mountains.The larger differences always appear over the valley,which may increase the vertical mixing intensity in these areas.
Figure 10 compares further the sensible and latent heat fluxes in order to explain the atmospheric response to the homogeneous mixed forests.One can see that diurnal circulations in FOREST nearly follow those in the CNTL run.It follows that promoting the green land cover in the Yellow Mountains Scenic Area may not produce significant influences on the local weather conditions. 4.3.3 DESERT experiment
Segal et al.(1988)indicated that the presence of vegetations is expected to modify the surface thermalfluxes while comparing with those of an equivalent bare soil area under the same environmental conditions and then impact mesoscale circulations.During the fall months in Africa,the Lake Chad basin becomes more vegetated and generates 14℃in surface IR temperature differences comparing with the surrounding desert area(Schneider et al.,1985).Therefore,it is necessary to consider the extreme situation in this study by removing allthe natural vegetation in D4.Only slight differences between the DESERT and CNTL experiments appear during the evening hours, with similar down-valley winds(Fig.8c).As the surface is heated after sunrise(0600 LST),wind speed increases significantly over the high-altitude regions (30.12°-30.17°N)in the DESERT experiment,and the wind field begins to show differences from those in the CNTL run.After 1600 LST,without blocking by vegetation,the higher background wind speeds contribute to an active local circulation over almost the entire valley.The increased wind speeds in DESERT produce stronger convergence than that in the CNTL run, thereby generating stronger upward motion,which in turn enhances the turbulent mixing in the PBL.In the absence of natural vegetation,Fig.9c shows large differences in wind vectors,especially over the mountainous area,because of the significant decreases in surface roughness.As compared with the CNTL run,the D4-domain-averaged variables exhibit a trend towards asharp decrease in latent heat flux(Figs.10c and 10d). On the other hand,the lower moisture content in the DESERT experiment could largely be attributed to lower evapotranspiration,which leads to a decline in the latent heat flux.The sensible heat fluxes change, leading to the PBL structures changing.
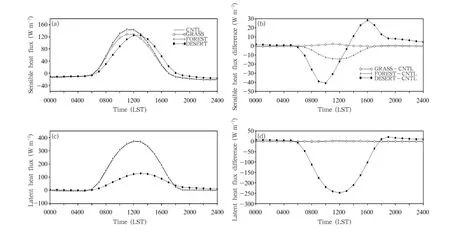
Fig.10.Diurnal variations of the D4-domain averaged(a)sensible heat flux and(c)latent heat flux from the CNTL,GRASS,FOREST,and DESERT experiments,and also(b)sensible heat flux differences and(d)latent heat flux differences(GRASS-CNTL,FOREST-CNTL,and DESERT-CNTL)on 13 September 2011.
Thus,we may state that when the original land cover is replaced by homogeneous bare soil,upslope winds will be stronger and downslope winds will be postponed to occur.
5.Summary and concluding remarks
In this study,terrain-induced local circulations and the PBL structures over the Yellow Mountains area in eastern China are examined by using a weakgradient case simulation with the WRF model.The results show that due to the asymmetric surface heating associated with the complex terrain,the strength and spatial variations of the simulated local circulations become more pronounced after sunrise,and reach their peak stage in early afternoon.Specifically, upslope flows begin to develop during the morning hours and shift to downslope flows at 1700 LST,with the former lasting for about 11 h.Meanwhile,the wind direction changes with time,starting from the mountain top.
To further examine the influence of land cover variations on the structures of local wind fields and the PBL,three sensitivity experiments are conducted by treating land cover as grassland,mixed forest,and bare soil,respectively.Compared with the CNTL experiment,the results show that in all the sensitivity experiments,the 10-m wind speed changing occurs over the mountain areas in GRASS experiment,while over valley areas in DESERT experiment.
On average,the use of bare soil results in lower surface latent heat flux(0600-1800 LST),but higher sensible heat flux(after 1400 LST),and stronger 10-m wind speed than those in the CNTL,GRASS,and FOREST experiments.However,these differences diminish during the evening hours.Hence,horizontal pressure gradients could be increased between the areas covered by different land cover types.In response to the pressure gradients,the evolution of local circulations may change.This indicates that mesoscale circulations may be impacted by subtle differences in elevation,complicated underlying surface conditions, and intense turbulent motion within the PBL.In other words,LULC may change the local weather and the PBL structures,and this could affect human comfort level if the land cover changes significantly.
As industrial and agricultural developments continue in this region,the above results have some useful implications.For example,the results provide(1)a basic 3D complex local circulation structures over the Yellow Mountains,(2)certain assessment of the meteorological alterations associated with urban planning and constructions along the sloping surface or in the valley,and(3)some ideas on the impact of the mountain-induced circulations on the transport of air pollutants originated by human activity.
Acknowledgments.The authors thank the two anonymous reviewers for their constructive comments and suggestions which greatly improve the manuscript, and Yuhui Wang for her assistance in revising the manuscript.Long Chen is thanked for his help in the preparation of an earlier version of the manuscript.
REFERENCES
Atkinson,B.W.,1981:Mesoscale Atmospheric Circulations.Academic Press,495 pp.
Baji´c,A.,1990:Small valley wind characteristics:An observational study.Meteor.Z.,40,377-382.
Banta,R.M.,1984:Daytime boundary-layer evolution over mountainous terrain.Part I:Observations of the dry circulations.Mon.Wea.Rev.,112,340-356.
Banta,R.M.,1985:Late-morning jump in TKE in the mixed layer over a mountain basin.J.Atmos.Sci.,42,407-411.
Banta,R.M.,1986:Daytime boundary layer evolution over mountainous terrain.Part II:Numerical studies of upslope flow duration.Mon.Wea.Rev.,114, 1112-1130.
Cai Xuhui,Song Yu,Zhu Tong,et al.,2007:Glacier winds in the Rongbuk Valley,north of Mount Everest.2:Their role in vertical exchange processes.J. Geophys.Res.,112,D11102.
Cairns,M.M.,and J.Corey,2003:Mesoscale model simulations of high-wind events in the complex terrainof western Nevada.Wea.Forecasting,18,249-263.
Chen Fei and J.Dudhia,2001:Coupling an advanced land surface hydrology model with the Penn State NCAR MM5 modeling system.Part II:Preliminary model validation.Mon.Wea.Rev.,129,587-604.
Chen Qian and Zhao Ming,2006:A numerical experiment on the effect of terrain on the precipitation. Scientia Meteor.Sinica,26,484-493.(in Chinese)
Crawford,T.M.,D.J.Stensrud,F.Mora,et al.,2001: Value of incorporating satellite-derived land cover data in MM5/PLACE for simulating surface temperatures.J.Hydrometeor.,2,453-468.
Dudhia,J.,1989:Numerical study of convection observed during the winter monsoon experiment using a mesoscale two-dimensional model.J.Atmos.Sci.,46,3077-3107.
Egger,J.,1990:Thermally forced flows:Theory.Atmospheric Processes over Complex Terrain,Meteor. Monogr.,No.40.Amer.Meteor.Soc.,43-57.
Egger,J.,S.Bajrachaya,U.Egger,et al.,2000:Diurnal winds in the Himalayan Kali Gandaki Valley.Part I:Observations.Mon.Wea.Rev.,128,1106-1122.
Ekhart,E.,1934:Neuere untersuchungen zur aerologie der talwinde:Die periodischen tageswinde in einem quertale der alpen.Beitr.Phys.Atmos.,21,245-268.
Gero,A.F.,and A.J.Pitman,2006:The impact of land cover change on a simulated storm event in the Sydney basin.J.Appl.Meteor.Climatol.,45,283-300.
Hong,S.-Y.,Y.Noh,and J.Dudhia,2006:A new vertical diffusion package with an explicit treatment of entrainment processes.Mon.Wea.Rev.,134, 2318-2341.
Hong,S.Y.,and S.K.Kim,2008:Stable boundary layer mixing in a vertical diffusion scheme.Proceeding of the Ninth Annual WRF User’s Workshop,Boulder, CO,3.3.
Horvath,K.,D.Koracin,R.Vellore,et al.,2012:Subkilometer dynamical downscaling of near-surface winds in complex terrain using WRF and MM5 mesoscale models.J.Geophys.Res.,117,D11111, doi:10.1029/2012JD017432.
Janji´c,Z.I.,2002:Nonsingular implementation of the Mellor-Yamada Level 2.5 scheme in the NCEP meso model.NCEP Office Note,437,61 pp.
Jankov,I.,P.J.Schultz,C.J.Anderson,et al.,2007: The impact of different physical parameterizations and their interactions on cold season QPF in the American River basin.J.Hydrometeor.,8,1141-1151.
Jim´enez,P.A.,and J.Dudhia,2012:Improving the representation of resolved and unresolved topographic effects on surface wind in the WRF model.J.Appl. Meteor.Climatol.,51,300-316.
Kain,J.S.,2004:The Kain-Fritsch convective parameterization:An update.J.Appl.Meteor.,43,170-181.
Kondo,J.,T.Kuwagata,and S.Haginoya,1989:Heat budget analysis of nocturnal cooling and daytime heating in a basin.J.Atmos.Sci.,46,2917-2933.
Lin,Y.L.,R.D.Farley,and H.D.Orville,1983:Bulk parameterization of the snow field in a cloud model. J.Climate Appl.Meteor.,22,1065-1092.
Liu Shuhua,Liu Zhenxin,Li Ju,et al.,2009:Numerical simulation for the coupling effect of local atmospheric circulations over the area of Beijing,Tianjin, and Hebei Province.Sci.China(Earth Sci.),52, 382-392.
Liu Zhenxin,Liu Shuhua,Hu Fei,et al.,2012:A comparison study of the simulation accuracy between WRF and MM5 in simulating local atmospheric circulations over greater Beijing.Sci.China(Earth Sci.),55,418-427.
Ma Xinye and Zhang Yaocun,2015:Numerical study of the impacts of urban expansion on Meiyu precipitation over eastern China.J.Meteor.Res.,29, 237-256,doi:10.1007/s13351-015-4063-5.
Mahmood,R.,R.Leeper,and A.I.Quintanar,2011: Sensitivity of planetary boundary layer atmosphere to historical and future changes of land use/land cover,vegetation fraction,and soilmoisture in western Kentucky,USA.Global and Planet Change,78, 36-53.
McPherson,R.A.,and D.J.Stensrud,2005:Influences of a winter wheat belt on the evolution of the boundary layer.Mon.Wea.Rev.,133,2178-2199.
Miao Junfeng,2014:An overview of numerical studies of interaction of urban heat island and sea breeze circulations.Trans.Atmos.Sci.,37,521-528.(in Chinese)
Miao,J.-F.,L.J.M.Kroon,J.Vil`a-Guerau de Arellano, et al.,2003:Impacts of topography and land degradation on the sea breeze over eastern Spain.Meteor. Atmos.Phys.,84,157-170.
Miao,J.-F.,D.Chen,and K.Borne,2007:Evaluation and comparison of Noah and Pleim-Xiu land surface models in MM5 using G¨oTE2001 data:Spatial and temporal variations in near-surface air temperature. J.Appl.Meteor.Climatol.,46,1587-1605.
Miao,J.-F.,D.Chen,K.Wyser,et al.,2008:Evaluation of MM5 mesoscale model at localscale for air quality applications over the Swedish west coast:Influence of PBL and LSM parameterizations.Meteor.Atmos.Phys.,99,77-103.
Miao,J.-F.,K.Wyser,D.Chen,et al.,2009:Impacts of boundary layer turbulence and land surface process parameterizations on simulated sea breeze characteristics.Annales Geophysicae,27,2303-2320.
Mlawer,E.J.,S.J.Taubman,P.D.Brown,et al.,1997: Radiative transfer for inhomogeneous atmosphere: RRTM,a validated correlated-k model for the longwave.J.Geophys.Res.,102,16663-16682.
Mursch-Radlgruber,E.,1995:Observations of flow structure in a small forested valley system.Theor.Appl. Climatol.,52,3-17.
Narisma,G.T.,and A.J.Pitman,2003:The impact of 200 years of land cover change on the Australian near-surface climate.J.Hydrometeor.,4,424-436.
Noppel,H.,and F.Fiedler,2002:Mesoscale heat transport over complex terrain by slope winds-A conceptual model and numerical simulations.Bound.-Layer Meteor.,104,73-97.
Pielke Sr.,R.A.,2001:Influence of the spatial distribution of vegetation and soils on the prediction of cumulus convection rainfall.Rev.Geophys.,39, 151-177.
Pielke,R.A.,J.Adegoke,A.Beltr´an-Przekurat,et al., 2007:An overview of regional land use and land cover impacts on rainfall.Tellus B,59,587-601.
Schneider,S.R.,D.F.McGinnis,and G.Stephens,1985: Monitoring Africa’s Lake Chad basin with LANDSAT and NOAA satellite data.Int.J.Remote Sens.,6,59-73.
Segal,M.,R.Avissar,M.C.McCumber,et al.,1988: Evaluation of vegetation effects on the generation and modification of mesoscale circulations.J.Atmos.Sci.,45,2268-2293.
Sen Roy,S.,R.Mahmood,A.I.Quintanar,et al.,2011: Impacts of irrigation on dry season precipitation in India.Theor.Appl.Climatol.,104,193-207.
Shen Jinmei,1998:Numerical modelling of the effects of vegetation and environmentalconditions on the lake breeze.Bound.-Layer Meteor.,87,481-498.
Skamarock,W.C.,J.B.Klemp,J.Dudhia,et al.,2008: A Description of the Advanced Research WRF Version 3.NCAR/TN-475+STR,113 pp.
Skamarock,W.C.,and J.B.Klemp,2008:A timesplit nonhydrostatic atmospheric model for weather research and forecasting applications.J.Comput. Phys.,227,3465-3485.
Wagner,A.,1932a:Der t¨agliche luftdruck und temperaturgang in der freien atmosph¨are und in gebirgst¨alern.Gerlands Beitr.Geophys.,37,315-344.
Wagner,A.,1932b:Neue theorie der berg-und talwinde. Meteor.Z.,49,329-341.
Wagner,A.,1938:Theorie und beobachtung der periodischen gebirgswinde.Gerlands Beitr.Geophys.,52,408-449.
Wang Die,Miao Junfeng,and Tan Zhemin,2013:Impacts of topography and land cover change on thunderstorm over the Huangshan(Yellow Mountain) area of China.Natural Hazards,67,675-699.
Whiteman,C.D.,and J.C.Doran,1993:The relationship between overlying synoptic-scale flows and winds within a valley.J.Appl.Meteor.,32,1669-1682.
Wippermann,F.,and G.Groβ,1981:On the construction of orographically influenced wind roses for given distributions of the large-scale wind.Beitr.Phys. Atmos.,54,492-501.
Wu Youxun,Yang Baogui,Wang Keqiang,et al.,2005: Climatic analysis of cloud deck in Huangshan.Acta Meteor.Sinica,25,97-104.(in Chinese)
Zhai Guoqing,Gao Kun,Yu Zhangxiao,et al.,1995: Numerical simulation of the effects of mesoscale topography in a heavy rain process.Chinese J.Atmos. Sci.,19,475-480.(in Chinese)
Zhang,D.,and R.A.Anthes,1982:A high-resolution model of the planetary boundary layer-sensitivity tests and comparisons with SESAME-79 data.J. Appl.Meteor.,21,1594-1609.
Wang Die,Miao Junfeng,and Zhang Da-Lin,2015:Numericalsimulations oflocalcirculation and its response to land cover changes over the Yellow Mountains of China.J.Meteor.Res.,29(4), 667-681,
10.1007/s13351-015-4070-6.
Supported by the National Natural Science Foundation of China(41030962)and Program for Sci&Tech Innovation Team of Qinglan Project of Jiangsu Higher Educational Institutions.
∗miaoj@nuist.edu.cn.
©The Chinese Meteorological Society and Springer-Verlag Berlin Heidelberg 2015
July 11,2014;in final form February 10,2015)
猜你喜欢
Chinese Physics B(2021年10期)2021-10-28
数学大世界(2019年30期)2019-12-20
延河(下半月)(2019年9期)2019-09-17
知识经济·中国直销(2018年5期)2018-05-26
意林(2016年22期)2016-11-30
微型小说选刊(2016年25期)2016-11-26
广西文学(2016年5期)2016-11-25
微型小说选刊(2015年27期)2015-11-17
 Journal of Meteorological Research2015年4期
- Journal of Meteorological Research的其它文章
- Regional Warming by Black Carbon and Tropospheric Ozone: A Review of Progresses and Research Challenges in China
- Comprehensive Radar Observations of Clouds and Precipitation over the Tibetan Plateau and Preliminary Analysis of Cloud Properties
- The Key Oceanic Regions Responsible for the Interannual Variability of the Western North Pacific Subtropical High and Associated Mechanisms
- Underestimation of Oceanic Warm Cloud Occurrences by the Cloud Profiling Radar Aboard CloudSat
- Performance of CMIP5 Models in the Simulation of Climate Characteristics of Synoptic Patterns over East Asia
- Nonlinear Responses of Oceanic Temperature to Wind Stress Anomalies in Tropical Pacific and Indian Oceans:A Study Based on Numerical Experiments with an OGCM