
Mechanical Property and Crystal Structure of Poly(p-phenylene terephthalamide) (PPTA) Fibers during Heat Treatment under Tension
2015-01-12 08:33YANDongdong严冬东CHENLeiCAOYutong曹煜彤LUChaofeng鲁超风YUJunrong于俊荣LIUZhaofeng刘兆峰ZHUJingWANGYanHUZuming胡祖明
关键词:严冬
YAN Dong-dong (严冬东), CHEN Lei (陈 蕾), CAO Yu-tong (曹煜彤), LU Chao-feng (鲁超风), YU Jun-rong (于俊荣), LIU Zhao-feng (刘兆峰), , ZHU Jing (诸 静), WANG Yan (王 彦), HU Zu-ming (胡祖明)*
1 College of Material Science and Engineering, Donghua University, Shanghai 201620, China 2 Suzhou Zhaoda Special Fiber Technical Co., Ltd., Changshu 215522, China
Mechanical Property and Crystal Structure of Poly(p-phenylene terephthalamide) (PPTA) Fibers during Heat Treatment under Tension
YAN Dong-dong (严冬东)1, CHEN Lei (陈 蕾)1, CAO Yu-tong (曹煜彤)2, LU Chao-feng (鲁超风)1, YU Jun-rong (于俊荣)1, LIU Zhao-feng (刘兆峰)1, 2, ZHU Jing (诸 静)1, WANG Yan (王 彦)1, HU Zu-ming (胡祖明)1*
1CollegeofMaterialScienceandEngineering,DonghuaUniversity,Shanghai201620,China2SuzhouZhaodaSpecialFiberTechnicalCo.,Ltd.,Changshu215522,China
The relationship between property and structure of poly (p-phenylene terephthalamide) (PPTA) was investigated for the purpose of obtaining products with better performance. PPTA fiber subjected to heat treatment under different conditions was intensively studied. Simultaneous wide-angle X-ray diffraction (WAXD) technique was introduced to study the changes of crystal structure. It was found that the tensile modulus was strongly sensitive to the levels of temperature and tension. The structure parameters including crystal size and crystal orientation after heat treatment evolve similarly to the tensile modulus, indicating a direct structure-property relationship. The latticc-dimension increases after heat treatment and is greatly affected by the tension. An optimal temperature can be found around 400 ℃, where big change can happen in the crystal structure due toα-relaxation in the crystal region as supported in dynamic mechanical analysis (DMA).
poly(p-phenyleneterephthalamide) (PPTA)fibers;heattreatment;crystalstructure;crystalorientation;mechanicalproperties
Introduction
Poly(p-phenylene terephthalamide) (PPTA) fiber is well known for its high tensile strength, modulus, and thermal stability[1-3]. Its excellent performance allows a wide range of applications in cables and rope, fiber-reinforced composites, and ballistic fabrics[4]. The mechanical property of PPTA fiber can be greatly enhanced through post-treatment. In order to achieve better performance, it is important to understand the relationship between the variation of structure and post-treatment and its effect on the property enhancement. In the last two decades, its structure-property relationship has been extensively studied[5-8]. Ran and coworkers studied structure changes in Kevlar®fibers via on-line synchrotron small-angle X-ray scattering (SAXS) and wide-angle X-ray diffraction (WAXD) techniques[9]. It was found that the fraction (mass) of mesophase in the Kevlar49 fiber was about 20%. The fibril length obtained using the Ruland method was nearly 90 nm and decreased until the stretch ratio was below 2.0%. Raoetal.[10]investigated the evolution of structure and property for PPTA fiber under different post-treatment conditions, and thought the fiber modulus was mainly affected by two factors including crystal orientation and paracrystalline parameter. Daviesetal.[11]conducted on-axis microbeam wide- and small-angle scattering experiments of a sectioned PPTA fiber. It confirmed a radial texture of crystalline domains with orientational order differing for skin, central core and intermediate layers. The analysis of crystallographic texture also provided direct evidence for hydrogen-bonding interactions in the radial direction along theb-axis of PPTA unit.
From the above, it is clear that studies on structure-property relationship have led to different conclusions among authors. However, few studies on the change of crystal structure with heat treatment under tension through simultaneous WAXD technique have been reported. In this paper, we apply the as-spun PPTA fiber to different treatment conditions including different temperature and tension to carefully investigate all relative structure parameters using simultaneous WAXD technique[12-14].
1 Experimental
1.1 Material
PPTA fibers were supplied by Suzhou Zhaoda Special Fiber Technical Co., Ltd., China. The fineness of single fiber is about 1.65 dtex.
1.2 Heat treatment experiments
The as-spun PPTA fibers were heat-treated through two kinds of modes: (1) constant tension mode, in which as received fibers were heat-treated at 350, 380, 400, 420, and 450 ℃ for 5 min with a tension of 0.6 cN/dtex; (2) constant temperature mode, in which as received fibers were heat-treated at 400 ℃ for 5 min with different tensions 0.6, 1.2, 1.8, and 2.4 cN/dtex.
The temperature control accuracy is ±5%. The tension on the fiber during heat treatment was created by a certain quality of counterweight. The whole treatment process was performed under Nitrogen environment.
1.3 Mechanical property test
The tensile strength and modulus were measured on XQ-1C fiber tensile tester at room temperature. The fiber length between two clamps was set to 20 mm. The fiber was drawn at a speed of 10 mm/min. Each sample was tested for 30 times to get the average value.
1.4 WAXD measurement
Single fibers were glued to the support structure. X-ray diffraction experiments were performed at SSRF BL14B1 beamline at a wavelength of 0.12398 nm. The fiber axis was oriented in the vertical direction and normal to the X-ray beam. 2D diffraction pattern was recorded in transmission for 30 s using Marccd225. The detector-to-sample distance was determined by LaB6 calibration standard asD=215.4307 mm. Data reduction for the selected pattern was performed with the FIT2D software package. In the present case, data analysis was limited to the strongest equatorial reflections.
The crystal structure parameters investigated include equatorial X-ray diffraction crystallinity,Xcr; crystal size of planes (110) and (200),L110andL200; the (200) orientation factor,fc; and lattice parameter,c.
1.5 Dynamic mechanical analysis (DMA)
The DMA experiment was performed with a DMA instrument, constructed by TA Instruments (USA, Q800). The measurement was carried out from 30 to 450 ℃ in nitrogen environment with a rate of 5 ℃/min at a definite frequency of 50 Hz. The amplitude of displacement was kept at 20 μm.
2 Results and Discussion
2.1 Mechanical behavior
The mechanical properties of PPTA fibers heat-treated under different conditions are shown in Table 1 and Fig.1.
Table 1 Mechanical property of PPTA fibers at different temperatures with a tension of 0.6 cN/dtex

Temperature/℃Elongation/%Strength/(cN·dtex-1)Modulus/(cN·dtex-1)Asreceived4.6624.12454.483503.7123.87577.903803.6623.68594.544003.5022.52624.864203.5521.29606.354503.5320.36567.01
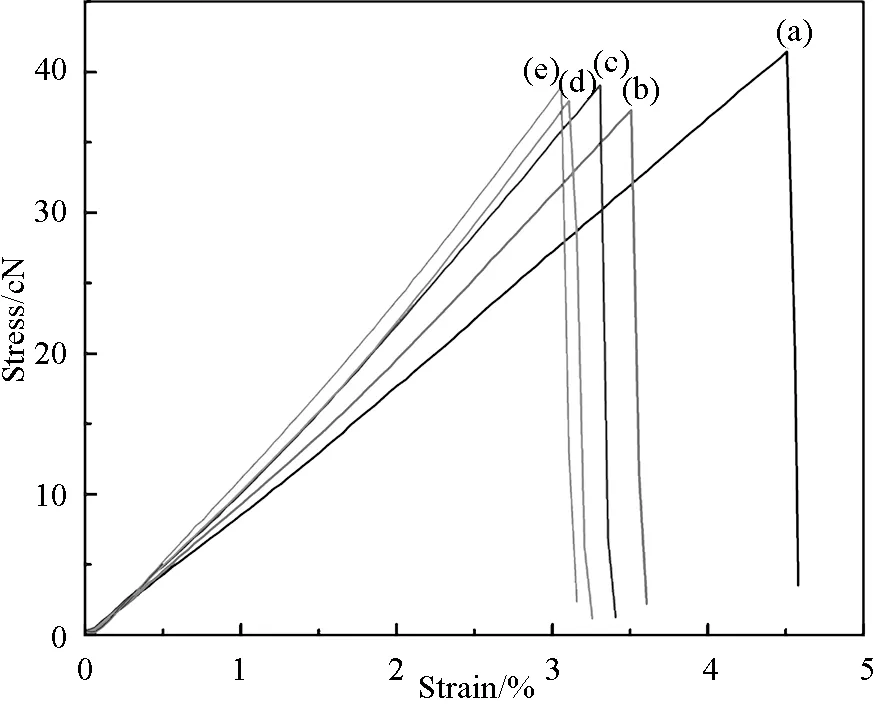
Fig.1 Stress-strain curves for PPTA fibers heat-treated at 400 ℃ under different tensions: (a) as received; (b) 0.6 cN/dtex; (c) 1.2 cN/dtex; (d) 1.8 cN/dtex; (e) 2.4 cN/dtex
Table 1 describes the mechanical properties for PPTA fibers heat-treated at different temperatures at a tension of 0.6 cN/dtex. It is clear that the tensile modulus is largely improved as the temperature increases and reaches its maximum at 400 ℃. Then the modulus starts to deteriorate when the temperature is higher than 400 ℃. Compared with the as received fiber, both the tensile strength and elongation decrease after heat treatment. Figure 1 shows the relationship between tensile modulus and applied tension. When the applied tension is larger, the tensile modulus is even improved more.
2.2 Crystal structure evolution
Commercially, PPTA fibers are heated under tension to provide products with better performance, such as Kevlar49. Under such conditions, the microstructure change of PPTA fiber takes place. For better understanding the structure evolution during the heat treatment, we studied the crystal structure of PPTA fiber through simultaneous WAXD.
Figure 2 is the 2D WAXD diffraction pattern of PPTA fiber. Two strong reflections located on the equator are indexed as (110) and (200) planes, respectively. The (211) plane emerges along the equatorial direction symmetrically. Along the meridional direction, (002), (004), and (006) planes distribute orderly.

Fig.2 2D WAXD diffraction pattern for as received PPTA fiber
2.2.1 Crystallinity and crystal size
The equatorial diffractograms for PPTA fibers heat-treated under different temperatures and tensions are shown in Fig.3. Three obvious diffraction peaks are shown at 16.42°, 18.39°, and 23.03°, corresponding to the (110), (200), and (211) planes. It is found that the diffraction peaks at (110) and (200) planes get strengthened and become sharper after heat treatment, indicating the evolution of the crystal structure.

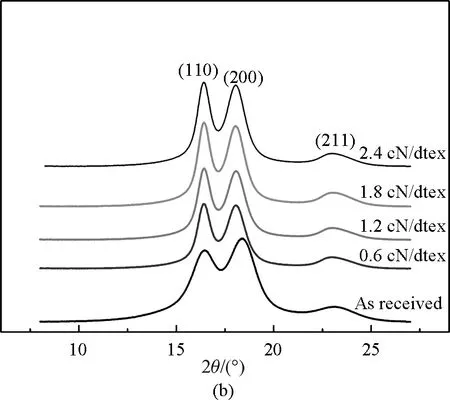
Fig.3 Equatorial diffractograms for PPTA fibers heat-treated under different conditions: (a) as received fibers and fibers heat-treated at 350, 380, 400, 420, and 450 ℃ with a tension of 0.6 cN/dtex; (b) as received fibers and fibers heat-treated at 400 ℃ with different tensions 0.6, 1.2, 1.8, and 2.4 cN/dtex
To characterize the crystallinity of PPTA fibers after heat treatment quantitatively, a Gaussian function is fitted to the X-ray diffractograms with Peakfit Software. Meanwhile, the apparent crystal sizes of (110) and (200) planes are also calculated through Scherrer formula in terms of the half width at diffraction peaks. The crystallinity and apparent crystal size are shown in Fig.4.
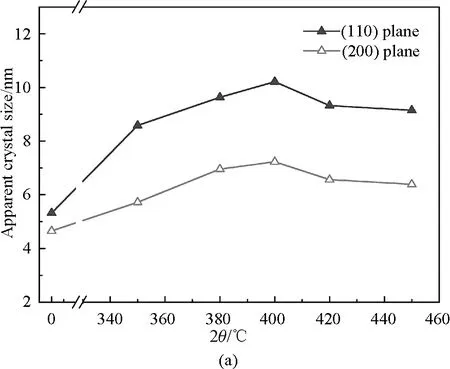

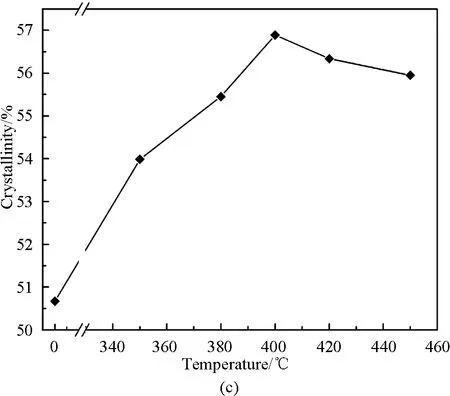
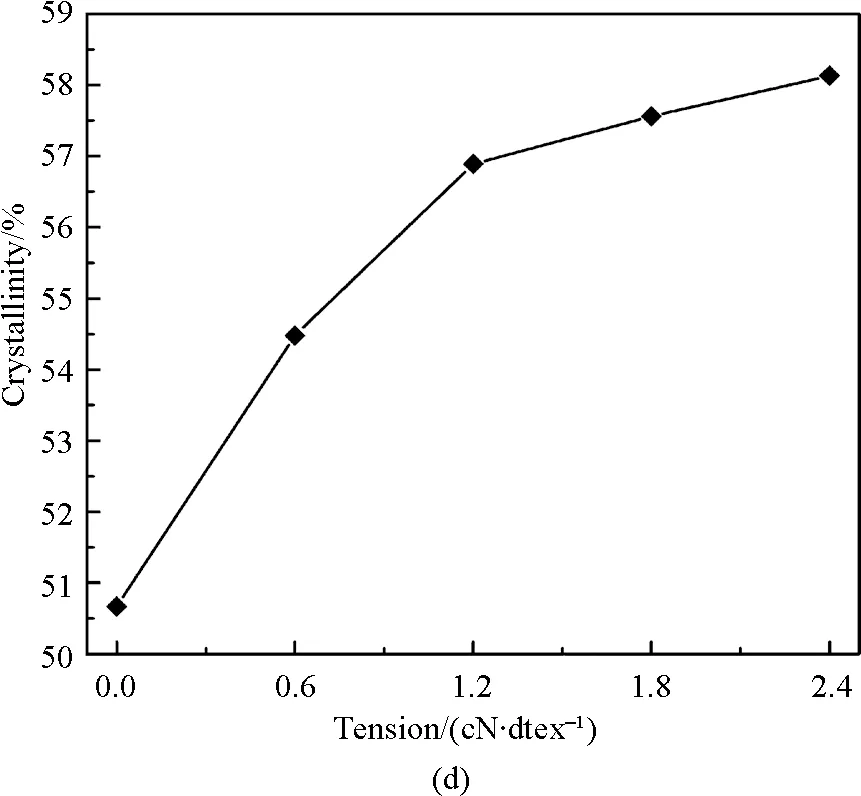
Fig.4 Evolution of crystal structure parameters for PPTA fiber under different heat treatment conditions: (a) crystal sizes of (110) and (200) planes under different temperatures; (b) crystal sizes of (110) and (200) planes with different tensions; (c) crystallinity under different temperatures; (d) crystallinity with different tensions
Figure 4 shows the changes of apparent crystal sizes of (110) and (200) planes and crystallinities for PPTA fibers heat-treated under different temperatures and different tensions. The apparent crystal size evolves similarly to the crystallinity degree. And the apparent crystal size of (110) increases faster than (200). This can be due to the fact that the hydrogen bonds exist between polymer chains along thebdirection and the binding forces like van der Waals type and π-electron interactions are involved in the stacking of the PPTA layers along theadirection[15]. Therefore more hydrogen bonds are created and theb-dimension is shortened during the heat treatment under tension. Meanwhile, thea-dimension is enlarged for steric reason. This change in chain conformation contributes to the crystal growth along the direction of hydrogen bonds. Hence, the apparent crystal size of (110) is largerly improved.
As illustrated in Figs.4 (a) and (c), both crystallinity and apparent crystal size go through the maximum at 400 ℃, corresponding to the modulus change. Figures 4 (b) and (d) show correlations of both apparent crystal size and crystallinity with the applied tensions at 400 ℃. It is found that these two quantities both increase with the increasing tension. For PPTA fibers during heat treatment under tension, the presence of tension played an important role in the growth of crystal size. The defects in crystalline region decreased and the crystalloid structure became more perfect. Meanwhile, the amorphous phase could convert to the crystals or the mesophase. That ultimately contributed to the increment of the crystallinity.
2.2.2 Crystal orientation
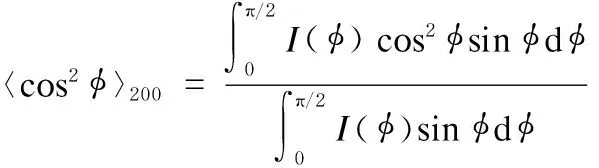
Heat treatment under tension is expected to improve the alignment of polymer chains. If we only consider the crystal phase, its orientation can be defined as the relationship of some crystallographic direction to an external reference frame. Usually the drawing direction (along the fiber axis) is defined as the reference direction. As for PPTA fiber, the (200) plane is often used for the calculation of crystal orientation due to its strongest diffraction[16]. For the (200) plane, its orientation, expressed as 〈cos2φ〉200, can be calculated,
(1)
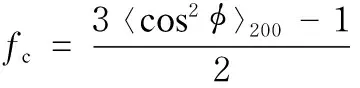
whereφis the azimuthal angle andI(φ) is the azimuthal profile. Usually the parameterfc, the so-called Herman’s orientation function, is used to describe the degree of orientation.
(2)
The WAXD diffraction patterns from PPTA fibers before and after heat treatment under tension are shown in Fig.5. The (110) and (200) reflections show a small spread along the azimuthal direction indicating that the fiber has a high degree of crystal orientation. And the spread became narrower after heat treatment indicating the increase of orientation, which could also be proved by the decrease of full width at half maximum (FWHM)[17]values in the azimuthal profile curves as illustrated in Fig.6. In Fig.6, full line represents as received fiber and dash line represents fiber heat-treated at 400 ℃ with a tension of 2.4 cN/dtex.
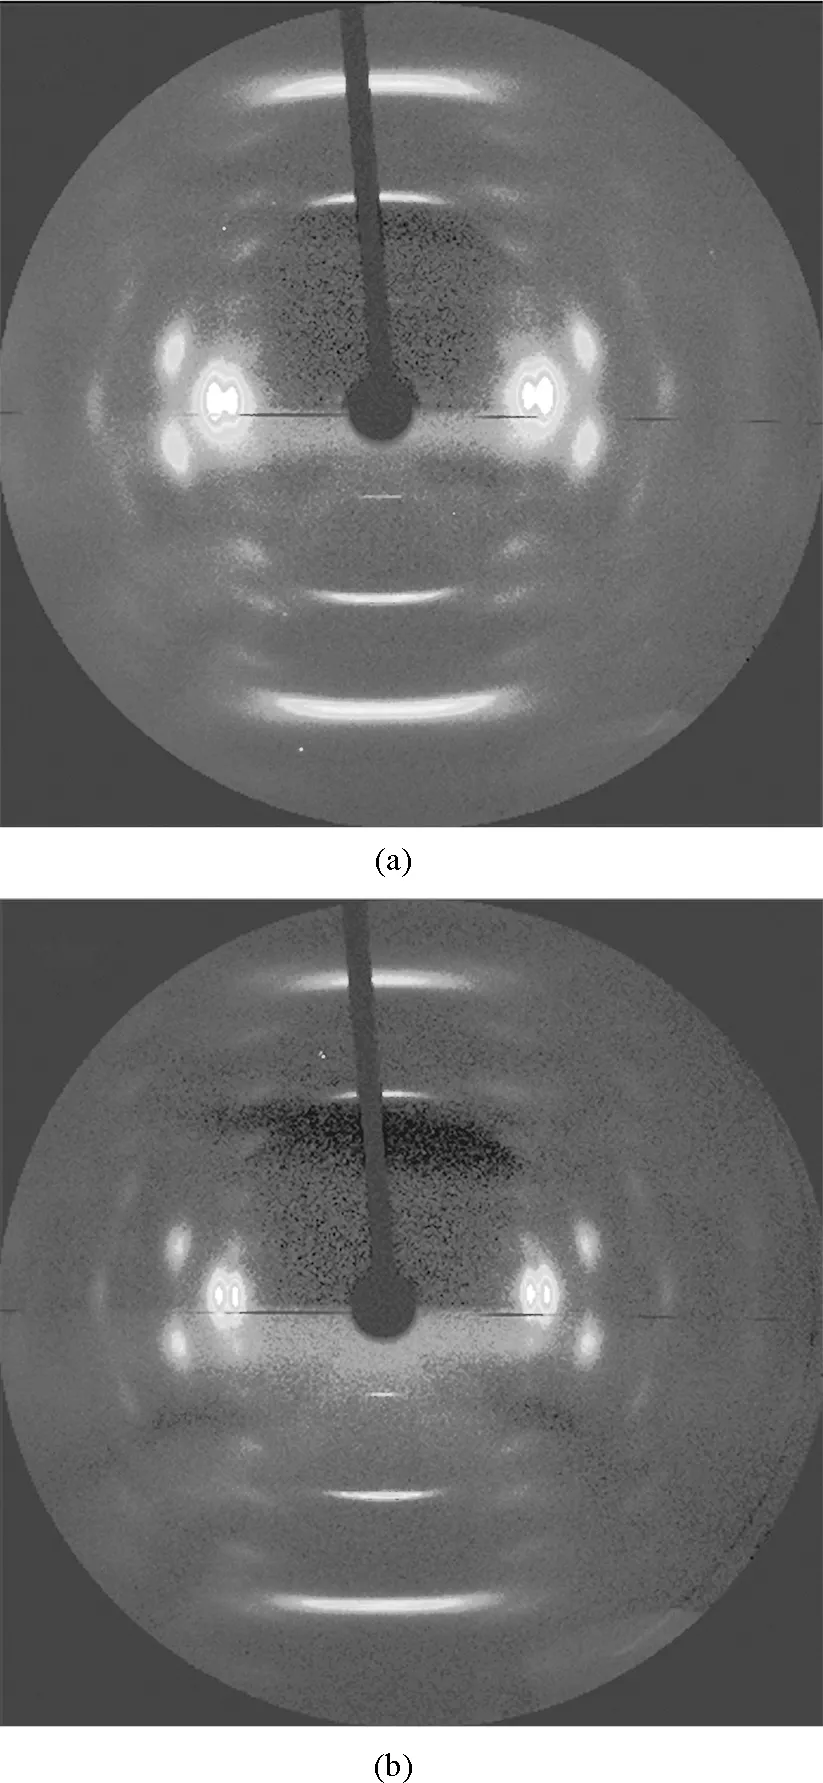
Fig.5 2D WAXD diffraction patterns for PPTA fibers: (a) as received and (b) heat-treated at 400 ℃ with a tension of 2.4 cN/dtex
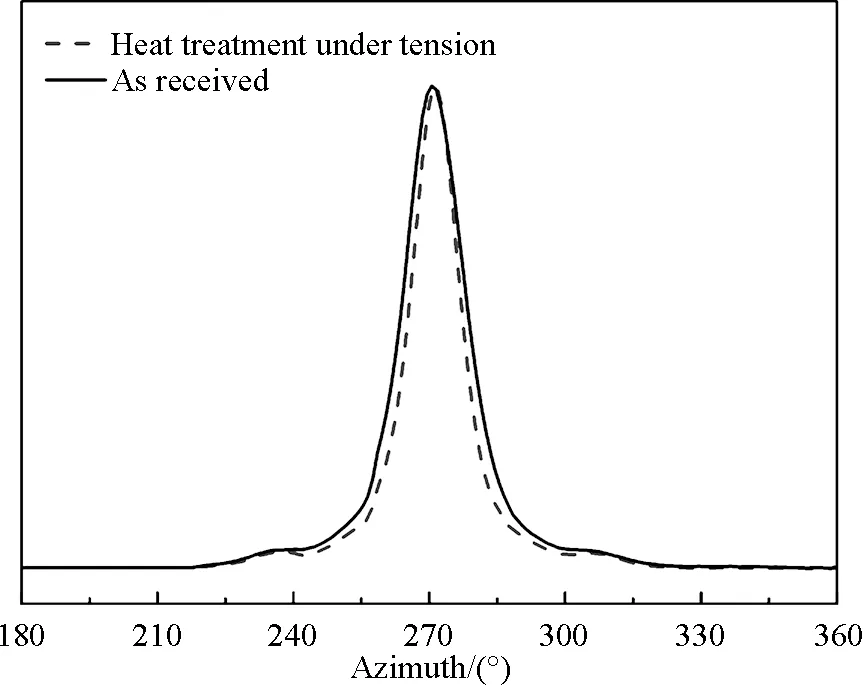
Fig.6 Azimuthal profile curves for PPTA fibers
The (200) orientation factors, calculated from the equation, are shown in Fig.7. Figure 7 (a) shows the change in crystal orientation at different temperatures with a tension of 0.6 cN/dtex. Figure 7 (b) shows the change in orientation at different levels of tension, all at 400 ℃. The as received fiber shows a high degree of crystal orientation (fc=0.757), which can be responsible for its liquid crystal spinning process. The orientation is found to increase with the increasing temperature and starts to decrease when the temperature is above 400 ℃. Meanwhile, the higher the tension is, the more effective it is in improving its crystal orientation. This is due to the fact that the molecular chains get more extended under higher tension and realign along the fiber axis to improve the regularity in crystal region. At the same time, the higher tension can prevent the orientated molecular chains from shrinking caused by the internal stress from PPTA fiber under higher temperature.

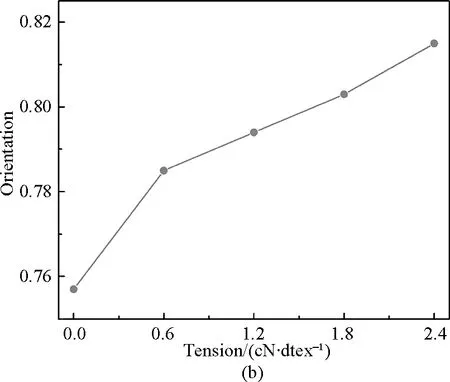
Fig.7 Change of crystal orientation in PPTA fibers: (a) heat-treated at different temperatures with a tension of 0.6 cN/dtex; (b) heat-treated at 400 ℃ with different tensions
2.2.3 Lattice parameterc
The lattice constants of PPTA crystal have been examined by WAXD. Northolt and van Aartsen[18-19]studied that the crystal structure of PPTA was preudo-orthorhombic. In this paper, we assumed it as an orthorhombic for ease of calculation. For a set ofhklplanes, the crystal interplanar spacing, expressed asdhkl, can be calculated using the following equation:
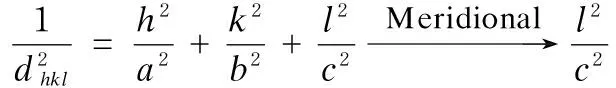
(3)
where, thec-dimension can be determined from the slope of the plot ofdhklversus 1/l. Thec-dimension can be calculated from the regression of three orders of meridional diffraction of PPTA fibers as illustrated in Figs.8 and 9.
Figure 8 is the meridional scan of PPTA fibers integrated from 2D diffraction pattern. Three obvious diffraction peaks are shown at 11.07°, 22.39° and 34.46°, corresponding to the (002), (004) and (006) planes. Figure 9 shows thec-dimension difference before and after heat treatment. In Fig.9, full line represents as received fiber and dash line represents fiber heat-treated at 400 ℃ with a tension of 2.4 cN/dtex. It is found that the slope of dotted line is slightly larger than that of full line, indicating the increase ofc-dimension.

Fig.8 Meridional diffractogram for PPTA fiber
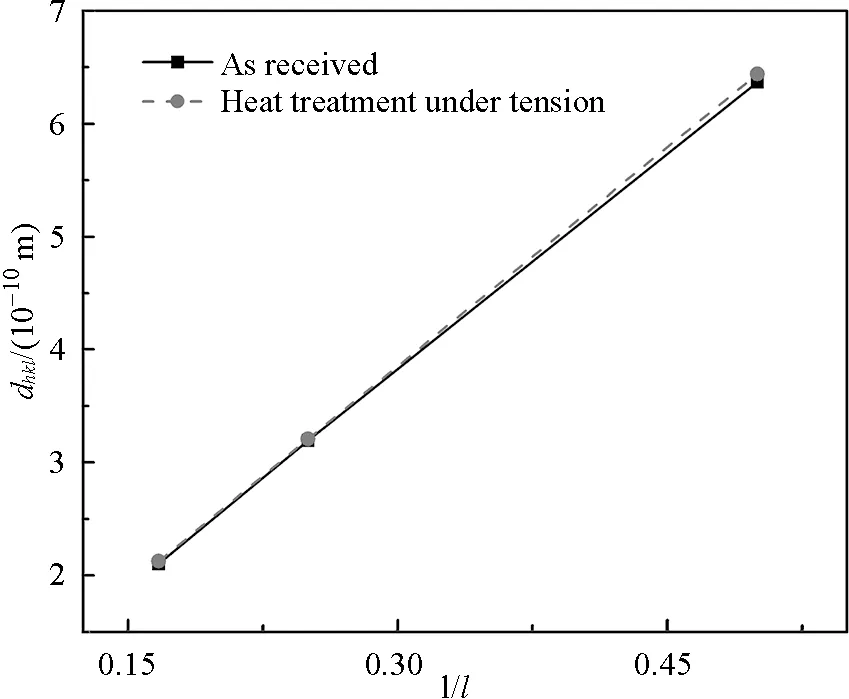
Fig.9 The c-dimension difference for PPTA fibers
Thec-dimension in the unit of PPTA fibers heat-treated under different conditions, calculated from the fitted plot, are summarized in Table 2. Thec-dimension increases until the temperature is above 400 ℃. When the tension is increasing, thec-dimension is increasing. It exhibits similar tendencies as in the case of both crystallinity and crystal orientation. This states that the crystal structure of PPTA is not thermally stable. It is not difficult to understand, because PPTA fibers are spun from lyotropic liquid crystalline state. And this ordered structure is probably frozen via coagulation under non-equilibrium state. Therefore the heat treatment is applied to following an evolution in the crystal’s metastable state. Raoetal.[10]presented an explanation that when the strong intramolecular interaction overcame the weaker intermolecular forces, namely hydrogen bonding and van der Waals force in the case of PPTA, a polymer crystal was merely the packing of chains. Hence, the external tension can apply directly to the chain and crystal dimension is changed due to the deformation of a single chain. Haraguchietal. also observed this instable structure on the PPTA film in their research[20]. Moreover, original conformation in PPTA could transform to the more stretched conformation to promote the formation of hydrogen bonds between chains withinbcplane. The symmetry of the structure became more perfect, which would contribute to the change ofc-dimension too.
Table 2 Changes inc-dimension in the unit cell of PPTA fibers heat-treated under different conditions

T/℃Tension/(cN·dtex-1)Time/minc-dimension/(10-10m)Asreceived0.0012.793500.6512.833800.6512.854000.6512.884200.6512.874500.6512.864000.6512.884001.2512.894001.8512.924002.4512.94
From our observation, the big change in the crystal structure parameters at 400 ℃ indicates that the rearrangement happens within the crystalline region. To further study the relaxations in PPTA fiber, DMA measurement is performed. Figure 10 is the DMA spectra of as received PPTA fiber. Two obvious peaks appear at 231.98 ℃ and 392.23 ℃ in its tanδcure. The transition at 392.23 ℃ may be attributed toα-relaxation in the crystalline region. The peak at 231.98 ℃ corresponds to theβ-relaxation peak proposed by Kunugietal.[21]

Fig.10 Temperature dependence of the dynamic loss modulus E″ and tan δ
3 Conclusions
Simultaneous WAXD method had been used to study the crystal structure of PPTA fiber during heat treatment under tension. Meanwhile, the mechanical properties of PPTA fiber under different heat treatment conditions were also studied. It was found that the tensile modulus was largely improved and was sensitive to temperature and tension. The crystal size and crystal orientation evolved similarly to the modulus change, indicating that both parameters were responsible for modulus improvement during the heat treatment. However, the tensile strength slightly decreased due to the increment of the latticec-dimension. Thec-dimension was greatly affected by the tension. It seemed that an optimal temperature could be found around 400 ℃, where big change happened in the crystal structure parameters. That could be due to theα-relaxation in the crystal region as supported in the DMA.
[1] Kwolek S L, Morgan P W, Schaefgen J R,etal. Synthesis, Anisotropic Solutions, and Fibers of Poly (1,4-benzamide) [J].Macromolecules, 1977, 10(6): 1390-1396.
[2] Chae H G, Kumar S. Rigid-Rod Polymeric Fibers [J].JournalofAppliedPolymerScience, 2006, 100(1): 791-802.
[3] Kwolek S L. Optically Anisotropic Aromatic Polyamide Dopes: US, 3671542[P]. 1972.
[4] Yang H H. Kevlar Aramid Fiber [M]. New York: John Wiley, 1993.
[5] Pauw B R, Vigild M E, Mortensen K,etal. Analysing the Nanoporous Structure of Aramid Fibers [J].JournalofAppliedCrystallography, 2010, 43(4): 837-849.
[6] Li C S, Zhan M S, Huang X C,etal. Hydrothermal Aging Mechanisms of Aramid Fibers via Synchrotron Small-Angle X-Ray Scattering and Dynamic Thermal Mechanical Analysis [J].JournalofAppliedPolymerScience, 2013, 128(2): 1291-1296.
[7] Rao Y, Waddon A J, Farris R J. Structure-Property Relation in Poly(p-phenylene terephthalamide) (PPTA) Fibers [J].Polymer, 2001, 42(13): 5937-5946.
[8] Gardener K H, English A D, Forsyth V T. New Insights into the Structure of Poly(p-phenylene terephthalamide) from Neutron Fiber Diffraction Studies [J].Macromolecules, 2004, 37(25): 9654-9656.
[9] Ran S, Fang D, Zong X,etal. Structural Changes during Deformation of Kevlar Fibers via On-line Synchrotron SAXS/WAXD Techniques [J].Polymer, 2001, 42(4): 1601-1612.
[10] Rao Y, Waddon A J, Farris R J. The Evolution of Structure and Properties in Poly (p-phenylene terephthalamide) Fibers [J].Polymer, 2001, 42(13): 5925-5935.
[11] Davies R J, Koenig C, Burghammer M,etal. On-axis Microbeam Wide- and Small-Angle Scattering Experiments of a Sectioned Poly(p-phenylene terephthalamide) Fiber [J].AppliedPhysicsLetters, 2008, 92(10): 101903-101903-3.
[12] Jain A, Abhishek S, Sangappa,etal. Crystallite Size and Shape in Twaron Fibers Heat Treated at Different Temperatures Using WAXS [J].JournalofAppliedPolymerScience, 2006, 100(6): 4910-4916.
[13] Riekel C, Davies R J. Applications of Synchrotron Radiation Micro-focus Techniques to the Study of Polymer and Biopolymer fibers [J].CurrentOptioninColloid&InterfaceScience, 2005, 9(6): 396-403.
[14] Feldman A Y, Wachtel E, Zafeiropoulos N E,etal.InsituSynchrotron Microbeam Analysis of the Stiffness of Transcrystallinity in Aramid Fiber Reinforced Nylon 66 Composites [J].CompositesScienceandTechnology, 2006, 66(13): 2009-2015.
[15] Jain A, Vijayan K. Forbidden Reflection from the Aramid PPTA — a Novel Correlation with Stacking Faults [J].BulletinofMaterialsScience, 2004, 27(1): 47-50.
[16] Alexander L E. X-Ray Diffraction Methods in Polymer Science [M]. New York: Wiley, 1969: 582.
[17] Riekel C, Dieing T, Engstrom P,etal. X-Ray Microdiffraction Study of Chain Orientation in Poly(p-phenylene terephthalamide) [J].Macromolecules, 1999, 32(23): 7859-7865.
[18] Northolt M G, van Aartsen J J. On the Crystal and Molecular Structure of Poly(p-phenylene terephthalamide) [J].JournalofPolymerScience:PolymerLetterEdition, 1973, 11(5): 333-337.
[19] Northolt M G. X-Ray Diffraction Study of Poly(p-phenylene terephthalamide) Fibers [J].EuropeanPolymerJournal, 1974, 10(9): 799-804.
[20] Haraguchi K, Kajiyama T, Takayanagi M. Uniplanar Orientation of Poly(p-phenylene terephthalamide) Crystal in Thin Film and Its Effect on Mechanical Properties [J].JournalofAppliedPolymerScience, 1979, 23(3): 903-914.
[21] Kunugi T, Watanabe H, Hashimoto M. Dynamic Mechanical Properties of Poly(p-phenylene terephthalamide) Fiber [J].JournalofAppliedPolymerScience, 1979, 24(4): 1039-1051.
Foundation items:National Basic Research Program of China (973 Program) (No. 2011CB606103); National High-Tech Research and Development Program of China (863 Program) (No. 2012AA03212); the Fundamental Research Funds for the Central Universities, China (No. 11D10625)
TQ342+.72 Document code: A
1672-5220(2015)01-0001-06
Received date: 2013-09-16
* Correspondence should be addressed to HU Zu-ming, E-mail: hzm@dhu.edu.cn
猜你喜欢
中国医院院长(2023年1期)2023-02-18
华人时刊(2022年9期)2022-09-06
Chinese Physics B(2022年3期)2022-03-12
学生天地(2020年34期)2020-06-09
醒狮国学(2020年4期)2020-01-04
作文通讯·初中版(2019年9期)2019-09-27
东坡赤壁诗词(2019年4期)2019-09-12
当代水产(2019年3期)2019-05-14
学生导报·东方少年(2018年20期)2018-05-14
 Journal of Donghua University(English Edition)2015年1期
- Journal of Donghua University(English Edition)的其它文章
- Joint Optimization Strategy for Video Transmission over Distributed Cognitive Radio Networks
- Asymptotic Behavior of the Drift Coefficient Estimator of Stochastic Differential Equations Driven by Small Noises
- Adaptive Modulation and Coding Based on Fuzzy Logic Cognitive Engine
- Modeling and Simulation of P-Aloha, CSMA/CA and MACAW Protocols for Underwater Acoustic Channel
- Design and Analysis of Axial Thrust Roller-Exciting Vibrating Table and Its Motor-Control System Based on Co-simulation
- Effects of Compression Garments on Lower Limb Muscle Activation via Electromyography Analysis during Running