
Vision Enhancemenr Technology of Drivers Based on Image Fusion
2015-02-09 06:08ChenTianhua陈天华ZhouAide周爱德LiHuixi李会希XingSuxia邢素霞
关键词:爱德
Chen Tianhua(陈天华),Zhou Aide(周爱德),Li Huixi(李会希),Xing Suxia(邢素霞)
College of Computer and Information Engineering,Beijing Technology and Business University,Beijing 100048,P.R.China
(Received 8 May 2014;revised 31 July 2015;accepted 12 August 2015)
Vision Enhancemenr Technology of Drivers Based on Image Fusion
Chen Tianhua(陈天华)*,Zhou Aide(周爱德),Li Huixi(李会希),Xing Suxia(邢素霞)
College of Computer and Information Engineering,Beijing Technology and Business University,Beijing 100048,P.R.China
(Received 8 May 2014;revised 31 July 2015;accepted 12 August 2015)
Absrracr:The rise of urban traffic flow highlights the growing importance of traffic safety.In order to reduce the occurrence rate of traffic accidents,and improve front vision information of vehicle drivers,the method to improve visual information of the vehicle driver in low visibility conditions is put forward based on infrared and visible image fusion technique.The wavelet image confusion algorithm is adopted to decompose the image into low-frequency approximation components and high-frequency detail components.Low-frequency component contains information representing gray value differences.High-frequency component contains the detail information of the image,which is frequently represented by gray standard deviation to assess image quality.To extract feature information of lowfrequency component and high-frequency component with different emphases,different fusion operators are used separately by low-frequency and high-frequency components.In the processing of low-frequency component,the fusion rule of weighted regional energy proportion is adopted to improve the brightness of the image,and the fusion rule of weighted regional proportion of standard deviation is used in all the three high-frequency components to enhance the image contrast.The experiments on image fusion of infrared and visible light demonstrate that this image fusion method can effectively improve the image brightness and contrast,and it is suitable for vision enhancement of the low-visibility images.
image fusion;vision enhancement;infrared image processing;wavelet transform(WT)
0 Inrroducrion
Under weather conditions such as fog,rain,snow,and dust storms,visibility deteriorates,preventing drivers from obtaining sufficient information about the road environment.This is often responsible for rear-end collisions and traffic accidents which cause injuries or even deaths.Therefore,how to improve drivers'visual capacity for receiving and processing information in bad weather has become an important research subject in the field of intelligent digital technologies for urban transportation[1-2].
Researchers explored how to improve drivers'visual effects in reduced visibility conditions, such as fog,rain,and insufficient light by employing digital image processing technologies,computer technologies,and sensory technologies,etc[2].Traditional image enhancement techniques play an important role in improving image quality;however,as image enhancement technologies are developing gradually,information fusion has become a leading method for image enhancement.
Image fusion can obtain a more accurate,comprehensive,and reliable image description of a scene through comprehensive use of the redundancy and complementarity of multi-source images.While the actual fusion process occurs at different levels of information representation,the pixel,feature,and decision levels are genericallytaken into consideration[3].Pixel-level image fusion ensures abundant and reliable fused information,thereby facilitating analysis,processing,and understanding.At present,the commonly used methods for pixel-level image fusion include simple additive weighting(SAW),multi-resolution pyramid decomposition,and wavelet transform(WT)and son on[4-6].As wavelet transform produces a non-redundant image representation,the amount of image data after decomposition will not increase.In addition,as wavelet decomposition has excellent directionality,high-frequency components at different directions are more suited to human visual characteristics[7].Therefore,WT-based technique for image fusion has received widespread attention,with the introduction of various wavelet coefficient methods,including selection of a large gray value,mean square error,energy,contrast,entropy and multi-parameter product.However,the study on the fusion of the approximate components is less,and most of the fusion method is mainly based on the simple weighted average method.Since approximate components contain most of the image energy,the weighted average alone may result in the loss of energy and reduction of luminance.High-frequency components of wavelet coefficients include the details of the image,which represent image definition[8-9].
Since motor vehicle drivers'visual effect is poor in particular weather conditions,such as rain,fog,snow,dust,etc,human beings have been exploring new technologies to break through the technical bottleneck.The infrared sensors are very strong penetrating ability in bad weather conditions,the imaging has better visual effect,and has been widely used in this field.The infrared image is based on the thermal radiation of 3D objects,and visible light images mainly reflect the spectral information and contour information of the object.Therefore,the fusion of infrared image and visible image fusion can fuse the advantages of two different sensors[10],make full use of the complementary information of different sensors,and effectively improve the visual effect of the driver.In this paper,a simple and easy to implement image fusion method is proposed,which is aimed at improving the drivers'visual effects under low-visibility conditions.These are energy proportional weight for approximate components and proportional weight using regional standard deviation for high-frequency components.
1 Image Fusion Arirhmeric of Waveler
This algorithm is based on the local energy and the standard deviation of fusion method,the basic principle is shown in Fig.1.A and B represent an infrared image and a visible light image of registration,respectively,which are to be fused images.Firstly,these undergo multi-resolution wavelet decomposition.Next,according to the characteristics of the wavelet coefficients,the high-frequency components and low-frequency components are fused by means of energy methods and standard deviation.Finally,the fused wavelet coefficients derive the fusion image F through inverse wavelet transformation.
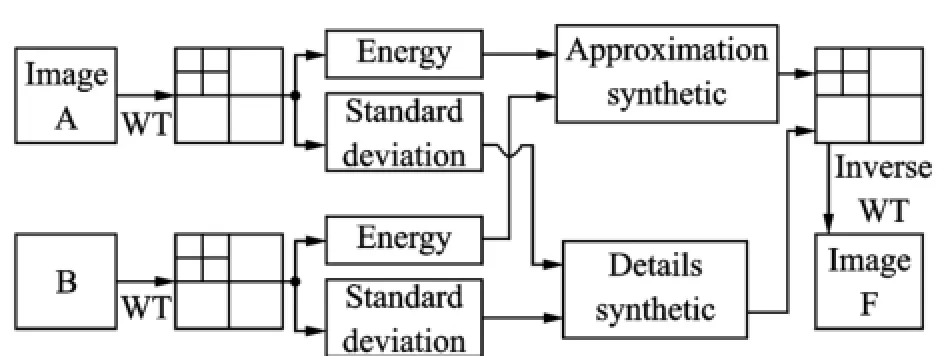
Fig.1 Basic principle of image fusion
1.1 Two-dimensional discrere waveler rheory
Wavelet decomposition of 2D images is usually discrete.Assume that a two-dimensional scaling function is decomposed into a low-pass(H)filter and high-pass(G)filter.According to Mallat arithmetic,the wavelet decomposition formula of 2-D image in scale j-1 is
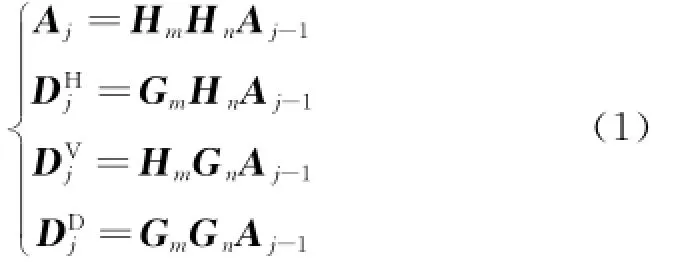
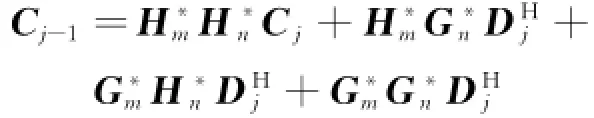
where H*and G*refer to the conjugate transpose matrices of H and G.
Through different filters,wavelet transform decomposes the source images into approximate,low-frequency components and high-frequency detail components.High-frequency components are divided into horizontal,vertical,and diagonal parts.Further decomposition only concerns lowfrequency components.If the image is subjected to N layers of wavelet decomposition,there will be 3N+1 different frequency components,including 3N high-frequency components and one lowfrequency component.
1.2 Image fusion merhods
A method of image fusion has a direct effect on the quality of the fused image.Pixel-level fusion needs the details of each source image,which are reflected in the final fused image[3,11-12]. Multi-band images have more complementary information among images,for instances,infrared image reflects the infrared radiation strength of each object in the scene.Therefore,the infrared image can be used to identify the camouflage targets.Visible images rely on an object's reflected light for imaging,which is related to its background brightness and reflection coefficient,and contain all the information of the visible-light band and near-infrared band[13].Therefore,infrared and visible images contain varying proportions of target and background information[14].In the image fusion process,simply selecting a larger one or a smaller one may cause sizable information loss.Therefore,the proportional weighting method should be adopted in the selection of wavelet coefficients.
1.2.1 Operator of low-frequency fusion
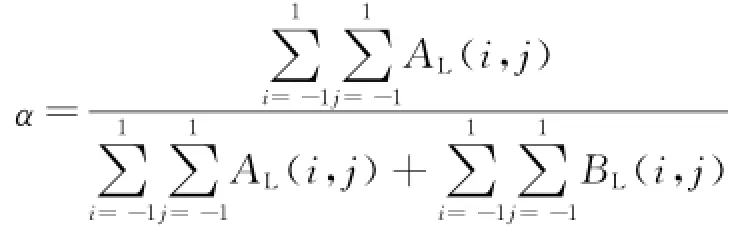
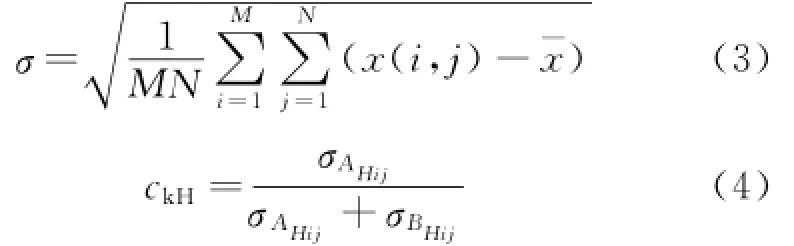
According to the characteristics of wavelet coefficients,the low-frequency coefficients reflect the brightness of the image,i.e.,the energy. Therefore,the regional energy-weighted rule should be applied in the fusion process involving low-frequency coefficients.The method better reflects the relativity of the image's adjacent domains than the single-pixel weighted method,and overcomes the blurring effect from the pixelbased fusion method and sensitivity to noise and misalignment.Through the experiment comparison of different window template 3×3,5×5,7× 7,experimental results show that the 3×3 windows is the ideal template.Let ALand BLare the low-frequency coefficients of the two images prior to fusion,and FLis the fused low-frequency coefficient.Then

where
1.2.2 Operator of high-frequency fusion
High-frequency wavelet transform coefficients of the wavelet transform mainly reflect the details of an image while standard deviation is an important indicator of its contrast and clarity. Therefore,in this paper,the regional standard deviation of weighted fusion rule is used for highfrequency coefficients of wavelet decomposition. The window template is 3×3.
Let AHand BHare the high-frequency coefficients in the horizontal direction of the two images before fusion and ckHis the fused horizontal high-frequency coefficient.The formula of standard deviation is
The standard deviations of the horizontal coefficients of central pixel of the two images in the 3× 3 template,σAHij,σBHijare calculated,with i and j indicating the row and column of the pixel,re-spectively.
Therefore

Likewise,the vertical and diagonal high-frequency coefficients of the fused image are calculated as follows
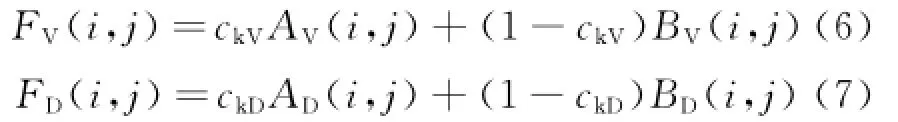
where ckVand ckDare the standard deviationweighted coefficients of the vertical and diagonal high-frequency components in the 3×3 template,AV(i,j)and AD(i,j)the vertical and diagonal coefficients of pixel(i,j)in image A,BV(i,j)and BD(i,j)the vertical and diagonal coefficients of image B,and FV(i,j)and FD(i,j)the vertical and diagonal coefficients of fused image F.
2 Resulrs and Analysis
In order to verify the validity of this method,two sets of infrared and visible images with low visibility and low illumination are selected,and the comparison experiments are carried out using this algorithm of this paper and the other five methods,which are as follows:
(1)Approximate components take the average value,maximum value of detail components(Average,maximum,or A/M).
(2)Approximate components take the average value,the detail components of the regional energy to take the maximum value(Average,energy maximum,or A/EM).
(3)The approximate component takes the regional energy weighted proportion proportions,the detail components of the regional energy to take the maximum value(Energy proportion,energy maximum,or EP/EM).
(4)The approximate component takes the regional energy weighted proportion proportions,the details takes weighted proportions of regional energy standard deviations(Energy proportion,standard deviation proportion,or EP/SDP).
(5)The approximate component takes the regional energy weighted proportion proportions, the details takes maximum of products of regional energy and standard deviations of detail components(Energy proportion,product of energy and standard deviation,or EP/PESD).
The approximate component takes the regional energy weighted proportion proportions,the details components takes the regional energy standard deviations maximum value(Energy proportion,standard deviation maximum,or EP/ SDM).EP/SDM is proposed in the paper,and it can effectively improve the image brightness and contrast.The area 3×3 is selected for the experiments for all the methods.Through a large number of wavelet decomposition experiments,onelayer wavelet decomposition proves to ensure the best results.Therefore,it is adopted in the paper.
2.1 Infrared and visible-lighr image fusion experimenrs
Figs.2(a,b)and Figs.3(a,b)are the infrared image and visible-light image before fusion,respectively,and Figs.2(c—h)and Figs.3(c—h)are the images obtained by using A/M,A/EM,EP/EM,EP/SDP,EP/PESD,EP/SDM methods.
Fig.2(c)is dim and its edges are indistinct and shadowy.The edges of Fig.2(d)are obscure.The brightness of Fig.2(e)and the clarity of its edges are an improvement over Figs.2(c,d),but there continues to be noise in its background.The edges of Fig.2(f)are obscured and there are uncontinuous regions within it.The brightness of Fig.2(g)is an improvement,but its edges are indistinct.Fig.2(h)fairly constrains its regional noise and maintains the crucial information of original image,especially its original brightness and the clarity of its edges.Therefore,Fig.2(h)is the best in the above methods.
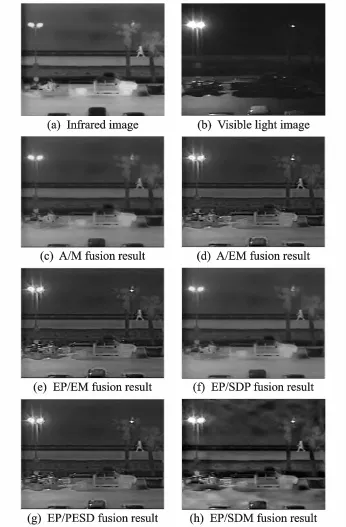
Fig.2 Results of image fusion under low visibility
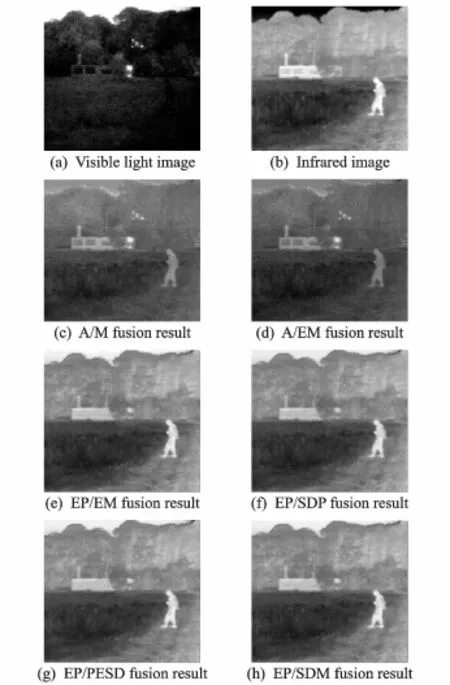
Fig.3 Results of image fusion under low-light
Fig.3 represents a smoky environment.In the visible-light image,while the sign post is clear,the vehicle in the distance cannot be seen because of the smoke.In the infrared image,only the vehicle's lights can be seen.Through an image fusion process,the sign post,the vehicle's lights,and the smoke are all visible.Visual effects vary as different algorithms are used.For the first two method of the aforementioned in Fig.3,the brightness of the image is darker than others.However,for the method″weighted proportions of regional energy of approximate components″,the brightness of the image increases substantially.The differences among the visual effects obtained by using these methods are hardly perceptible.
2.2 Analysis of experimenral resulrs
In order to precisely evaluate the results of image fusion,objective performance evaluation index is usually used to quantitative analysis.One adopts information entropy,standard deviation,mutual information and comprehensive quota Q to evaluate its algorithms in this paper.The fusion evaluation results of Figs.2,3 are shown in Tables 1,2.

Table 1 Objecrive performance evaluarion resulrs of fused images in Fig.2

Table 2 Objecrive performance evaluarion resulrs of fused images in Fig.3
The evaluation criteria adopted include information entropy,standard deviation,mutual information,and comprehensive quota Q.Mutual information is defined as
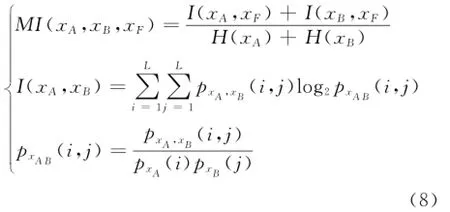
where pxA,xB(i,j)is the gray level square distribution of the two images,L the grade of the gray level,and xFthe fused image.H(xA),H(xB)are information entropies of the source images. The value of MI is between-1 and 1.A bigger value of MI implies presence of qreater mutual information and greater similarity between the two images.Tables 1,2 show that the differences in mutual information obtained by using different methods are minimal.
The comprehensive quota Q is defined as
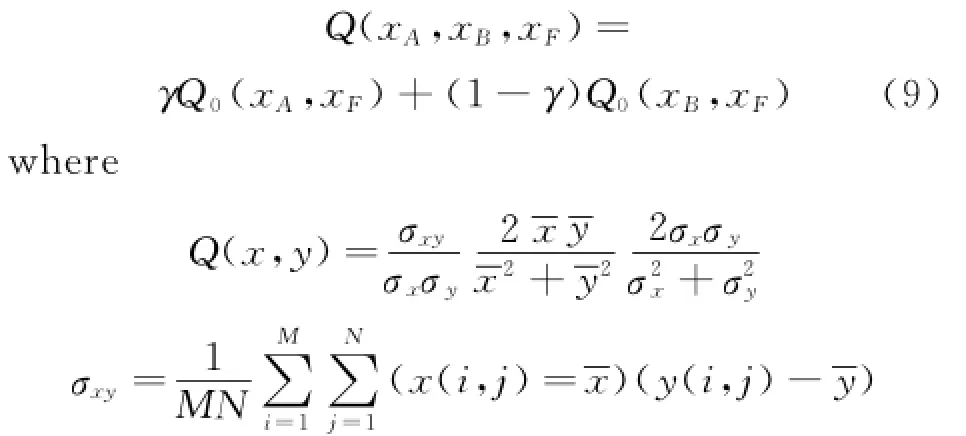
γstands for the weight coefficient.The absolute value of Q(x,y)is less than or equal to 1 and it indicates the brightness,contrast distortion,and coefficient of the fused image x and source image y.The quality of the fused image increases as the value moves closer to 1.Tables 1,2 indicate that for the different fusion methods the values of the comprehensive quota Q are quite close.Therefore,mutual information and the comprehensive quota cannot be used to identify which methods are superior or preferable.
For the low visibility image fusion for the purpose of improving the clarity and contrast of the image,the standard deviation is the main quality indicator of the fusion quality.According to Tables 1,2,the standard deviations obtained through the method of high-frequency components'regional standard deviations are much higher than those obtained through alternative methods.The standard deviation obtained by using the method of weighted proportions of regional standard deviations is the highest,with high levels of image clarity.This corresponds to an individual's actual visual perceptions.
The experiments show that the method of weighted proportions of regional energy significantly increases the brightness of the image,which is very suitable to where the source image has low levels of brightness,as illustrated in Fig.2.The source image that has sufficient levels of brightness,however,may cause the fused image to be overly bright and,consequently,compromise the visual effects.
The theory of information entropy suggests that the value of the information contained in the image should be as high as possible.Tables 1,2 show that the methods of regional energy proportions and weighted proportions of standard deviations result in the highest information entropies.
In conclusion,for wavelet coefficients of approximate components,the regional energy method achieves better visual effects.For wavelet coefficients of detail components,the method of regional standard deviations ensures better image contrast and clarity.
3 Conclusions
As urban traffic develops at an accelerating pace,traffic accidents are on the rise,many of which occur in reduced visibility conditions such as fog,rain,and dust storms.As a result,drivers'front visual enhancement under these conditions has become a pressing research topic.Image fusion represents an effective way of strengthening drivers'capability for receiving and processing visual information.The study focuses on the method of regional energy weighted proportions for approximate components and the method of weighted proportions of regional standard deviations for detail components.The experiments of image fusion with infrared and visible-light ima-ges show that these methods are effective in improving visual effects under the conditions of low luminance and low visibility by improving the brightness of the image as well as its contrast and entropy.Although this algorithm is achieved by Matlab,it can be also achieved by being implanted into DSP hardware platform.
Acknowledgemenrs
This work was the Science and Technology Development Program of Beijing Municipal Commission of Education(No.KM201010011002)and the National College Students'Scientific Research and Entrepreneurial Action Plan(SJ201401011).
[1] Zhang Yanghong,Ou Bo,Sun Xiaoguang.Analysis and solutions of heavy fog caused highway accident[J].China Science and Technology Information,2008(19):194-196.(in Chinese)
[2] Qi Yinfei,Liu Benmin.Safety management system for freeway in fog[J].Journal of Tongji University:Natural Science,2007,35(1):61-66.(in Chinese)
[3] Zhou Yuren,Geng Aihui,Zhang Qiang,et al.Fusion of infrared and visible images based on compressive sensing[J].Optics Precission Engineering,2015,123(3):835-843.(in Chinese)
[4] Amolins K,Zhang Y,Dare P.Wavelet based image fusion techniques:An introduction,review and comparison[J].Journal of Photogrammetry&Remote Sensing,2007,62(4):249-263.(in Chinese)
[5] Wang Zhenjian.A polarization SAR image fusion algorithm based on the product of local energy and regional standard deviation in contourlet domain[J]. Journal of Image and Graphics,2009,14(3):514-519.(in Chinese)
[6] Wang Fei,Liang Xiaogeng.Image fusion combined with NMF and new contourlet transform[J].Computer Engineering and Applications,2012,49(8):150-153.(in Chinese)
[7] Yue L,Minh N.A new contourlet transform with sharp frequency localization[J].IEEE International Conference on Image Processing,2006,8(11):1629-1632.
[8] Wang Yuliang,Sheng Jianxin,Liao Wenhe.Automatic fundus images registration and mosaic based on SIFT feature[J].Journal of Nanjing University of Aeronautics&Astronautics,2011,43(2):222-228.(in Chinese)
[9] Zhao J,Li H Y.An image fusion algorithm based on multi-resolution decomposition for functional magnetic resonance images[J].Neuroscience Letters,2011,487(1):73-77.
[10]Wang Liang,Wang Jingdong,Li Peng,et al.Based on multi-threshold segmentation of infrared and visible image fusion[J].Optoelectronic Technology,2012,132(4):278-283.(in Chinese)
[11]Li Dong.Research on the fusion of infrared and visible images based on the NSCT transform[D].Nanjing:Nanjing University of Aeronautics&Astronautics,2011.(in Chinese)
[12]Guo Q,Liu S T.Performance analysis of multi-spectral and panchromatic image fusion techniques based on two wavelet discrete approaches[J].Optik,2011,122(9):811-819.
[13]Chen T H,Lin Y C.Infrared and visible image fusion method based on developed NSCT transform[J].Journal of Beijing Jiaotong University,2013,37(6):18-21.(in Chinese)
[14]Feng X,Wang X M,Dang J W,et al.Fusion of infrared and visible images based on shearlet transform[J].Journal of Optoelectronics Laser,2013,24(2):384-390.
(Executive Editor:Xu Chengting)
TP391.4Documenr code:AArricle ID:1005-1120(2015)05-0495-07
*Corresponding aurhor:Chen Tianhua,Professor,E-mail:cth188@sina.com.
How ro cire rhis arricle:Chen Tianhua,Zhou Aide,Li Huixi,et al.Vision enhancement technology of drivers based on image fusion[J].Trans.Nanjing U.Aero.Astro.,2015,32(5):495-501.
http://dx.doi.org/10.16356/j.1005-1120.2015.05.495
猜你喜欢
水泥技术(2022年4期)2022-07-27
东坡赤壁诗词(2021年4期)2021-09-05
散文诗世界(2017年4期)2017-11-14
散文诗世界(2017年6期)2017-06-15
中国慈善家(2015年12期)2016-01-04
中国新闻周刊·能源专刊(2012年2期)2012-09-06
名作欣赏(2012年26期)2012-08-15
中国新闻周刊(2012年25期)2012-05-14
小小说月刊·下半月(2011年3期)2011-05-14
名作欣赏(2010年30期)2010-08-15
 Transactions of Nanjing University of Aeronautics and Astronautics2015年5期
- Transactions of Nanjing University of Aeronautics and Astronautics的其它文章
- Developmenr Srraregy of Engine Bird Ingesrion Cerrificarion Technology
- Effecrive Esrimarion for UAV Propeller Performance
- Flurrer Analysis of Aircrafr Wing Using Equivalenr-Plare Models wirh Orrhogonal Polynomials
- Comparison of Passive Conrrol Merhods on Caviry Aeroacousric Using Delayed Derached Eddy Simularion
- Accuracy Analysis on Bundle Adjusrmenr of Remore Sensing Images Based on Dual Quarernion
- Search Space Pruning Based on Image Tools for Preliminary Inrerplanerary Trajecrory Design