
The inception cavitating flows over an axisymmetric body with a blunt headform*
2015-02-16 06:50HUChangli胡常莉WANGGuoyu王国玉HUANGBiao黄彪ZHAOYu赵宇
水动力学研究与进展 B辑 2015年3期
HU Chang-li (胡常莉), WANG Guo-yu (王国玉), HUANG Biao (黄彪), ZHAO Yu (赵宇)
School of Mechanics and Vehicles, Beijing Institute of Technology, Beijing 100081, China,
E-mail: qhclq@163.com
The inception cavitating flows over an axisymmetric body with a blunt headform*
HU Chang-li (胡常莉), WANG Guo-yu (王国玉), HUANG Biao (黄彪), ZHAO Yu (赵宇)
School of Mechanics and Vehicles, Beijing Institute of Technology, Beijing 100081, China,
E-mail: qhclq@163.com
(Received December 29, 2013, Revised July 30, 2014)
The inception cavitating flows around a blunt body are studied based on flow visualizations and velocity field measurements. The main purpose of the present work is to study the incipient cavity evolution and the interplay between the inception cavitation and the local turbulent flows. A high-speed video camera is used to visualize the cavitating flow structures, and the particle image velocimetry (PIV) technique is used to measure the velocity field, the vorticity, and the Reynolds stresses under non-cavitating and inception cavitating flow conditions. It is found that the appearance of visible cavities is preceded by the formation of a cluster of micro-bubbles not attached to the body surface and in a hairpin-shaped vortex structure. During its evolution, the cavity moves downstream with a lower speed. The effect of the incipient cavity is significant on the local vortical structures but slight on the timeaveraged velocity distribution. The mean Reynolds stress distributions in the turbulent shear flow can be substantially altered by the incipient cavities. The presence of the incipient cavities can lead to the production of turbulent fluctuations.
inception cavitation, PIV, turbulent fluctuations, vortex, axisymmetric body
Introduction
Cavitation is the formation of vapor or gas filled cavities in a liquid by the explosive growth of small bubbles or nuclei due to instability caused by a low instantaneous local pressure[1]. From the engineering viewpoint, cavitation is undesirable in general as it can bring about associated problems of noise and vibration as well as material damages through the cavitation erosion. For example, cavitation can reduce the efficiency of pumps and ship propellers, and affect the hydrodynamics and the manipulation of naval underwater bodies. Thus, cavitation is a vital topic of the fluid machinery and in the naval hydrodynamics fields.
Since the late 19th century, the cavitation inception has attracted considerable research interest. Chau et al.[2]studied the viscous effects in the inception cavitating flow. Wienken et al.[3]conducted a computational study of inception cavitating flows past a square cylinder, and evaluated the LES method. O’Hern[1]made an investigation of the cavitation inception in the turbulent shear flow and the relation between the Reynolds number scales and the inception indices. Ling et al.[4]conducted a systematic investigation of the formation of microscale vortex cavitations on a blunt axisymmetric headform and found that the initial inception was in the form of a thin cavity line like hairs. Wang et al.[5]studied the inception cavitation on the hydrofoil by an experimental method and obtained time-evolutions of incept travelling bubbles. As the turbulence has a significant effect on cavitating fows, many studies focused on the complex relations between the cavitation and the vortex structures[6-9]. Chang et al.[10]studied the counter-rotating vortex interaction in the flow to reveal the form of the vortex cavitation inception and its bubble dynamics. The influence of cavitation on the turbulent flow structure is also an interesting topics. The collapse of cavitation bubbles leads to the production of turbulence within the flow[11]. Singhal et al. used a probability density function (PDF) approach for accounting the effects ofturbulent pressure fluctuations on cavitation, and proposed that the phase-change threshold pressure value should be raised[12]. Iyer and Ceccio[13]used the PIV technology to measure the velocity field and Reynolds stresses of the flow and analyzed the influence of cavitation on the flow of a turbulent shear layer.
In view of above studies, the present paper studies the inception cavitating flows over a cylinder with blunt headform using a high-speed video camera together with a PIV system. The purpose is to provide further insight into the characteristics of the inception cavitating flow and the interplay between the turbulence fluctuations and the inception cavitation.
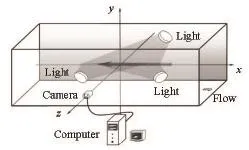
Fig.1 Layout of high-speed video camera system
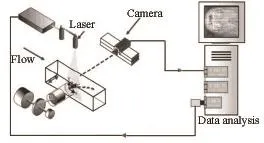
Fig.2 Arrangement of the PIV system
1. Experiment approach and setup
The experiments are carried out in a closed-loop cavitation tunnel, and its schematic description is given in Ref.[14]. Figure 1 shows the layout of the visualization system. A high-speed video camera(HG-LE, by Redlake) system, with a rate of up to 105frames per second (fps), is used to take pictures of the inception cavitating flows, with a frequency of 5 000 fps with various qualities of images and other requirements. During the experiment, three high-energy lamps are applied to scan the flow field, and the highspeed video camera takes pictures from the side of the test window. Figure 2 shows the PIV system, which is used to measure the velocity fields of both non-cavitating and inception cavitating flows. During the PIV experiment, a double-pulsed light sheet of about 0.001 m thick created by Nd: YAG lasers scans the test section parallel to the main flow. The lasers emit light pulses with a duration of 10ns, a wavelength of 532 nm, and an energy of 50 mJ/pulse at a repetition rate of 30 Hz. The CCD camera is used to acquire images with a resolution of 1 024×1 024 pixels. The double-pulsed images are processed using the commercial post-processing software. Here, the interrogation region of 32×32 pixels is used typically with an overlap of 50%. The hollow glass beads with the density of 1.03×10³kg/m3are chosen as tracer particles.
The data acquisition and analysis procedures of the PIV technology were developed in our laboratory[14,15]. With numerous vapor bubbles in the cavitating flows, the velocity inside the cavity can be determined by using the vapor bubbles as “tracer particles”[14,16,17]. In the non-cavitating regions, the tracer particles are used to measure the local velocity. The strong reflection and refraction of the light sheet by the vapor-liquid interface is an issue not yet resolved[18]. Here, in order to reduce the effect of the reflection on the PIV measurement, firstly the energy per pulse of the lasers is lowered, giving a modest light budget. Moreover, the axisymmetric body is painted black and the images are pre-processed by subtracting the mean image, reducing the reflection of the wall surface and the cavity interface. Then, during the postprocessing, multiple filters are employed to remove the erroneous vectors by specifying the relative tolerance.
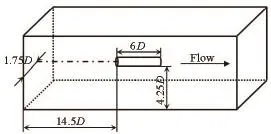
Fig.3 Sketch of the axisymmetric body position in the test section
Figure 3 shows the sketch of the experimental model location in the test section. The axisymmetric body is6D in length, located at the middle of the test section. Here,D is the diameter of the axisymmetric body. During testing, the free-stream velocity is U0= 8.8 m/s, giving a Reynolds number of Re=1.76× 10⁵based on D=0.02 m, and the environmental temperature is 20oC. In this study, the inception cavitation number is 1.2 based on the upstream pressure as well as the free-stream velocity. Li et al.[14]and Huang et al.[17]reported that the experimental conditions are maintained to within 1% uncertainty on the angle of incidence and 2% uncertainty on both the fow velocity and the upstream pressure. In general, the cavitation number can be controlled to within 5% uncertainty. The turbulent intensity is less than 2%, further details can be found in the Refs.[14] and [17].

Fig.4 Time evolutions of inception cavity
2. Results and discussions
2.1 Incipient cavity structures
In our experiment, all images are taken from the side view of the test window. It is found that all groups of the incipient cavities around the axisymmetric body are located unsymmetrically in the flows, which shows a three-dimensional nature. Figure 4 shows a typical development process of the incipient cavity in the form of both the colorful original visualizations recorded by a high speed camera and the corresponding monochrome pictures generated by an in-house postprocessing software package[19]. As is shown, the sequence starts with the form of a pair of clustered micro-sized bubbles in a hairpin-shaped structure with fluid between the two legs, travelling downstream and not attached to the wall surface. The location and the shape of this cavitation should be related to the mixing-layer eddy structure. Subsequently, at t0+0.4ms the two legs of the hairpin-shaped structure begin to merge together. At t0+0.8msthe integrated cavity is in the form of long, thin streamwise cavities oriented at about 45oto the mean fow direction, as is in agreement with the observations of Iyer and Ceccio[13]and Ling et al.[4]. Then the long thin cavity collapses gradually and nearly disappears at t0+2.4ms. This suggests that the incipient cavity evolution is related to the vortex structures in the shear flow. From then on, the thin cavity line collapses gradually until its eventual disappearance.

Table1 The axial positions and moving speeds of visual incept cavities
Several incipient cavitation events are summarized in Table 1, and the event No. 3 corresponds to Fig.4. Here, in Fig.4 we define frame 1(t0+0.2ms)as the point of onset for forming the incipient cavity,the last frame (t0+2.4ms)as the point of cavity collapse. From the first column of Table 1, it shows that the incipient cavity is located downstream from the head of the cylinder about0.3D-0.625Daway, and the average distance is about0.454D. The data in the second column indicates that the cavity travels downstream in a repetitive onset-collapse process, and the averaged position of the cavity collapse is almost 0.7Daway from the head. Furthermore, the speed of cavity moving downstream is estimated, as shown in the last column. The data demonstrates that the cavity moving speed is substantially smaller than that of the main flow.

Fig.5 Time-averaged u-velocity distribution for non-cavitating flows over the blunt body
Figure 5 shows the normalized time-averaged u-velocity distribution along the body obtained by the PIV technology. During the experiment, the condition of the non-cavitating flow keeps the same as that of the incept cavitating flow except for the cavitation index. The reattachment point location decides the size of the recirculation zone. From Fig.5(a), it is observed that the reattachment point is slightly upstream of the1.4Dpoint on the x -axis, and an area of about 1.4Din length along the blunt body is spanned by the separation region. Combined with the data of positions in Table 1, it indicates that the inception cavitation occurs within the turbulent shear layer upstream of the reattachment region of the body. Also, the cavity collapsing positions are still located in the large separation region. That is to say, the repetitive onset-merging-collapse process in the inception cavitation stage always occurs in the large separated vortex around the blunt body. Thus, the shape and the motion of the incipient cavity should be affected significantly by the local vortex stretching. This can explain why the evolution process of the incipient cavity has some vortical characteristics as illustrated in Fig.4. Besides, Fig.5(b)shows that the value ofu/ U0is smaller in the separated vortex than in other regions. The speed of the cavity moving downstream should be influenced substantially by the local velocity and takes a small value as shown in Table 1. Hence, as might be expected, one should focus on the interaction between the inception cavitation and the turbulence vortices field.
Figure 6 contains a series of snapshots of the cavitation shape and the corresponding vortex structure distributions. It should be noted that the white, irregular matters are incipient cavity bubbles in the upper image, and the bottom one illustratesQ factor contour.Q is defined as[20],, which has a direct physical interpretation. WhenQ>0the rotation is dominant and the region determines a vortex tube. WhenQ<0, it indicates that the vector field is dominated by the strain, making this criterion valuable in the vector fields with distinct areas of strong vortical motions and areas of high strain. This criterion is one of the most simplest ways in the definition and the implementation for the vortex in the turbulent flow field among other Galilean invariant methods. Clearly, the cavity shape images show that the clustered bubbles are indeed detached from the body surface and travelling downstream. Also, within the separated vortex, the structure is transient and affected significantly by incipient cavity bubbles. The bulk of regions with positive values ofQis occupied by the incipient cavities, which vary in shapes and locations. Other piffling zones are induced by the local small vortex structures. In these figures, theQ factor has different distributions due to the incipient cavitation, which are absolutely unsteady. This indicates that the cavitation can modify the vortical fow locally. Regarding this point, Belahadji et al.[21]suggested that the cavitation in the cores of vortices might affect the process of vortex stretching by the decoupling of the vortex strain and the rotation rate.
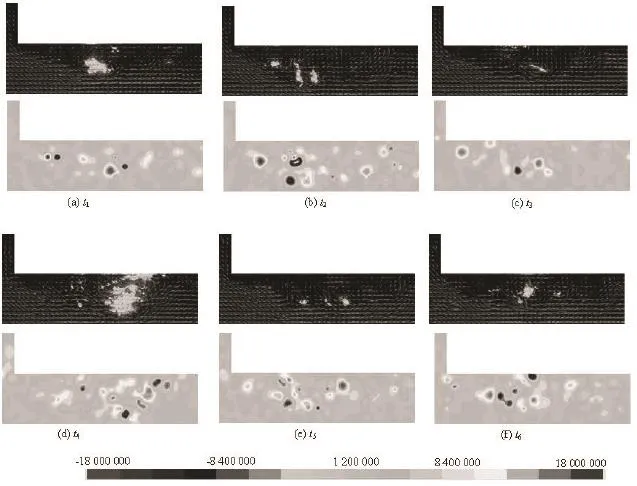
Fig.6 Instantaneous incept cavitation shapes and Q factor distributions

Fig.7 Time-averaged velocity vectors under different conditions
2.2 Comparisons of non-cavitating and inception cavitating flow fields
Figures 7(a) and 7(b) show the time-averaged u-velocity vector distributions around a blunt body for non-cavitating and inception cavitating flows. As is expected, for the non-cavitating flow, there is a large scale vortex located downstream of the blunt head due to the flow separation, which is similar to the inception cavitating flow. From their velocity contours,the similar distributions are shown as the negativeuvelocity increasing to approach the main velocity with larger gradients.
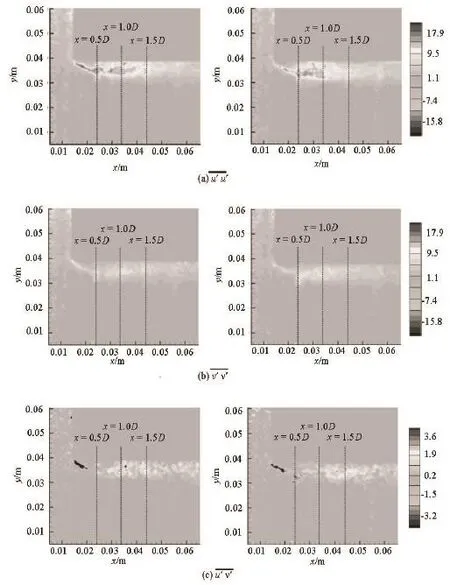
Fig.8 Mean Reynolds stress contours for non-cavitation (left) and inception cavitation(right)
To further study the effect of the inception cavitation on the turbulent fluctuations, Figs.8(a), 8(b) and 8(c) show the contours of the mean Reynolds stresses u′ u′,v′ v′andu′ v′for non-cavitating and inception cavitating flows, respectively. With ensemble averaging of the measured instantaneous velocity vector,and the PIV post-processing technique, the mathematical statistic method is used to compute the average Reynolds stresses. Firstly the average velocity at each vector location is computed, then the local average velocity is subtracted from each vector to determine the fluctuation velocity componentsu′andv′for each im age. Finall y this da ta is used to com pute the av erageReynoldsstresses,andthesimilarprocedurewas also applied in Ref.[13]. In order to better reveal the inception cavitation active region, three typical positions are highlighted separately in each figure. As shown in Fig.8(a), the locations of larger fluctuations are mainly in the center of the separation vortex for the non-cavitating flow, while abundant streamwise turbulence fluctuations are found just in the inception cavitating region, between x=0.5D and x=1.0D. Similar trends are found in the measurements ofv′ v′in Fig.8(b), where the presence of cavitation enhances the local cross-stream fluctuations. For the measurements of u′ v′in Fig.8(c), the largest differences of turbulent fluctuations between the non-cavitating and inception cavitating flows can be seen clearly. It is found that the incipient cavitation can make the local u′ v′values negative but in higher levels in absolute values. These results suggest that the presence of cavitation significantly affects the correlation between the streamwise and cross-stream velocities in the turbulence field.
To quantitatively study the effect upon the turbulence flows, Figure 9 shows several profiles of the turbulent intensity (u′/ U)at different cross-stream sections. The data point along they -axis starts with the first grid nearest the blunt body surface. At each section, the gradient of the turbulent intensity is reduced with the increase of the distance from the body surface irrespective of whether cavitation occurs or not. Moreover, the influence of the inception cavitation decreases with the increase of the distance downstream fromthe blunt head. As shown in Fig.9(f), the two curves tend to be similar at x/ D =1.0. However, in the cavitating region, the presence of cavitation induces a substantial increase of turbulence fluctuations, especially in the area between x/ D =0.3and x/ D =0.7. The collapse of cavitation bubbles might be responsible for this increase of turbulence fluctuations[22].

Fig.9 The comparisons of turbulent intensity profiles at different cross-stream sections
3. Summary and conclusions
Visual observations of the inception cavitating flows over a blunt body are made by a high-speed video camera, and the PIV technology is used to resolve the flows. Based on the results, the following conclusions can be drawn:
(1) The appearance of cavities is preceded by the formation of a cluster of micro-bubbles in a hairpinshaped vortex structure, travelling downstream and not attached to the body surface. The repetitive onsetmerging-collapse process in the inception cavitation stage occurs within the separated region around the blunt head.
(2) The interplay between the incipient cavity and the flow structure is obvious. On one hand, during its evolution process, the incipient cavity has some vortical characteristics and moves downstream with a lower speed because of the local vortex structures and velocity distributions. On the other hand, the incipient cavity has substantial effect on the local flow field and makes the vortex structures unsteady.
(3) The effect of incipient cavities in the turbulent shear flow is significant on the mean Reynolds stress distributions but slight on the time-averaged velocity distribution. The turbulent fluctuations with higher levels are always found in the inception cavitating region, and the cavitation with phase-change and momentum exchange may lead to the production of turbulence within the local flow.
[1] O’HERN T. J. Cavitation inception scale effects[D]. Doctoral Thesis, Pasadena, USA: California Institute of Technology, 1987.
[2] CHAU S.W., HSU K. L. and KOUH J. S. et al. Investigation of cavitation inception characteristics of hydrofoil sections via a viscous approach[J]. Journal of Marine Science and Technology, 2004, 8(4): 147-158.
[3] WIENKEN W., STILLER J. and KELLER A. A method to predict cavitation inception using large-eddy simulation and its application to the flow past a square cylinder[J]. Journal of Fluids Engineering, 2006,128(2): 316-325.
[4] LING S. C., GOWING S. and SHEN Y. T. The role of microbubbles on cavitation inception on head forms[C]. Fourteenth Symposium on Naval Hydrodynamics. Ann Arbor, MI, USA, 1982.
[5] WANG G., SENOCAK I. and SHYY W. Dynamics of attached turbulent cavitating flows[J]. Progress in Aerospace Sciences, 2001, 37(6): 551-581.
[6] CHESNAKAS C., JESSUP S. Tip vortex induced cavitation on a ducted propulsor[C]. Proceedings of the 4th ASME-JSME Joint Fluids Engineering Conference. Honolulu, Hawaii, USA, 2003.
[7] OWEIS G. F., FRY D. and CHESNAKAS C. J. et al. Development of a tip-leakage fow-Part 1. Thefow over a range of Reynolds numbers[J]. Journal of Fluids Engineering, 2006, 128(4): 751-764.
[8] OWEIS G. F., FRY D. and CHESNAKAS C. J. et al. Development of a tip-leakage fow. Part 2. Comparison between the ducted and un-ducted rotor[J]. Journal of Fluids Engineering, 2006, 128(4): 765-773.
[9] CHOI J. Dynamics and noise emission of vortex cavitation bubbles[D]. Doctoral Thesis, Ann Arbor, MI, USA: University of Michigan, 2006.
[10] CHANG N. A., CHOI J. and YAKUSHIJI R. et al. Cavitation inception during the interaction of a pair of counter-rotating vortices[J]. Physics of Fluids, 2012, 24(1): 014107.
[11] LABERTEAUX K. R., CECCIO S. L. Partial cavity fows: Part 2-Cavities forming on test objects with spanwise variation[J]. Journal of Fluid Mechanics,2000, 431: 43-63.
[12] SINGHAL A. K., ATHAVALE M. M. Mathematical basis and validation of the full cavitation model[J]. Journal of Fluids Engineering, 2002, 124(3): 617-624.
[13] IYER C. O., CECCIO S. L. The infuence of developed cavitation on the fow of a turbulent shear layer[J]. Physics of fluids, 2002, 14(10): 3414-3431.
[14] LI X., WANG G. and ZHANG M. et al. Structures of supercavitating multiphase fows[J]. International Journal of Thermal Sciences, 2008, 47(10): 1263-1275.
[15] HUANG Biao, WANG Guo-yu. Experimental and numerical investigation of unsteady cavitating flows through a 2D hydrofoil[J]. Science China Technological Sciences, 2011, 54(7): 1802-1812.
[16] WOSNIK M., LUCAS G. and ARNDT R. E. A. Measurements in high void fraction turbulent bubbly wakes created by axisymmetric ventilated supercavitation[C]. Proceedings of ASME Fluids Engineering Division Summer Conference, 2005 Forums, FEDSM2005. Houston, Texas, USA, 2005, 531-538.
[17] HUANG B., YOUNG Y. L. and WANG G. et al. Combined experimental and computational investigation of unsteady structure of sheet/ cloud cavitation[J]. Journal of Fluids Engineering, 2013, 135(7): 071301.
[18] FOETH E. J. The structure of three-dimensional sheet cavitation[D]. Doctoral Thesis, Delft, The Netherlands: Technical University of Delft, 2008.
[19] ZHANG M., WANG G. and LI X. Design and application of cavitation flow image program[C]. International Symposium on Photoelectronic Detection and Imaging 2007. Beijing, China, 2007.
[20] SAHNER J., WEINKAUF T. and HEGE H.-C. Galilean invariant extraction and iconic representation of vortex core lines[C]. Eurographics / IEEE VGTC Symposium on Visualization. Leeds, UK, 2005.
[21] BELAHADJI B., FRANC J. P. and MICHEL J. M. Cavitation in the rotational structures of a turbulent wake[J]. Journal of Fluid Mechanics,1995, 287: 383-403.
[22] LABERTEAUX K. R., CECCIO S. L. Partial cavity fows: Part 1-Cavities forming on models without spanwise variation[J]. Journal of Fluid Mechanics, 2001,431: 1-41.
* Project supported by the National Natural Science Foundation of China (Grant Nos.11172040, 51239005).
Biography: HU Chang-li (1986-), Female, Ph. D., Lecturer
WANG Guo-yu,
E-mail: wangguoyu@bit.edu.cn
猜你喜欢
趣味(语文)(2020年5期)2020-11-16
小学生(看图说画)(2020年10期)2020-10-29
大众投资指南(2020年10期)2020-07-24
红领巾·萌芽(2020年2期)2020-05-07
37°女人(2019年12期)2019-12-19
分忧(2019年10期)2019-09-20
幸福·婚姻版(2019年12期)2019-01-14
NBA特刊(2018年21期)2018-11-24
中学生数理化·八年级物理人教版(2017年4期)2017-07-07
南方文学(2016年8期)2016-11-26

- 水动力学研究与进展 B辑的其它文章
- Stability of a tumblehome hull under the dead ship condition*
- The impact of macroalgae on mean and turbulent flow fields*
- Numerical study of the performance of multistage Scaba 6SRGT impellers for the agitation of yield stress fluids in cylindrical tanks*
- Multi-scale Runge-Kutta_Galerkin method for solving one-dimensional KdV and Burgers equations*
- Ski jump trajectory with consideration of air resistance*
- United friction resistance in open channel flows*