
Torsional stiffness modeling and optimization of the rubber torsion bushing for a light tracked vehicle
2015-04-22 07:24YAOShouwen姚寿文ZHENGXin郑鑫CHENGHaitao程海涛HUANGYoujian黄友剑MORongli莫容利
关键词:海涛
YAO Shou-wen(姚寿文), ZHENG Xin(郑鑫),, CHENG Hai-tao(程海涛),HUANG You-jian(黄友剑), MO Rong-li(莫容利)
(1.School of Mechanical Engineering, Beijing Institute of Technology, Beijing 100081, China;2.Zhuzhou Times New Materials Technology Co Ltd, Zhuzhou, Hunan 412007, China)
Torsional stiffness modeling and optimization of the rubber torsion bushing for a light tracked vehicle
YAO Shou-wen(姚寿文)1, ZHENG Xin(郑鑫), CHENG Hai-tao(程海涛)2,HUANG You-jian(黄友剑)2, MO Rong-li(莫容利)2
(1.School of Mechanical Engineering, Beijing Institute of Technology, Beijing 100081, China;2.Zhuzhou Times New Materials Technology Co Ltd, Zhuzhou, Hunan 412007, China)
Taking the rubber torsion bushing of a certain type of all-terrain tracked vehicle as the research object, a theoretical model of torsional stiffness was proposed according to the non-linear characteristics of rubber components and structural feature of the suspension. Simulations were carried out under different working conditions to obtain root mean square of vertical weighted acceleration as the evaluation index for ride performance of the all-terrain tracked vehicle, with a dynamics model of the whole vehicle based on the theoretical model of the torsional stiffness and standard road roughness as excitation input. Response surface method was used to establish the parametric optimization model of the torsional stiffness. The evaluation index showed that ride performance of the vehicle with optimized torsional stiffness model of suspension was improved compared with previous model from experiment. The torsional stiffness model of rubber bushing provided a theoretical basis for the design of the rubber torsion bushing in light tracked vehicles.
rubber torsion bushing; torsional stiffness model; dynamics modeling; ride performance; optimization
Light tracked vehicles, especially all-terrain tracked vehicles (ATV), usually refer to certain kind of vehicles that can drive on any kind of terrain. Compared with other vehicles, the most significant advantage of a light tracked vehicle is its lower ground contact pressure and better mobility, thus a better adaptability to different terrains. In 1970s, Sweden, Finland, and the former Soviet Union started the research on all-terrain vehicles in the demand for transportation in harsh terrain conditions. At present, the research for light tracked vehicle in China is still at the starting stage[1]. ATV consists of all-terrain tracked vehicle, all-terrain wheeled vehicle and a third type with a driving system that can run with tracks or wheels. All-terrain tracked vehicle is commonly used in military, agriculture and transportation in tidal flat terrain due to its excellent mobility and capacity[2].
With lighter weight and smaller volume, rubber torsion bushing is used in the suspension of all-terrain tracked vehicle as vibration reduction component to achieve a lighter weight of the vehicle in order to amphibiously drive on terrains like snow and swamp. Compared with traditional torsion bar, suspensions with rubber torsion bushing are effective in vehicle weight control of driving system to low ground contact pressure, and in lifting ground clearance to improve mobility. The torsional stiffness of rubber bushing is the key factor that affects the vibration characteristics of the suspension and ride performance of the vehicle. Currently, researches on torsional stiffness of rubber torsion bushing are insufficient, and there is no appropriate theoretical model for the design of torsional stiffness.
Taking the rubber torsion bushing of a certain type of all-terrain tracked vehicle as the research object, this paper presented a torsional stiffness model in accordance with the nonlinearity of rubber bushing. In the perspective of ride performance, multi-body dynamics software was used to carry out simulation on the basis of the theoretical model. With root mean square of vertical weighted acceleration as the optimization objective, central composite design (CCD) was used to set up simulation tests for response surface model, and a theoretical torsional stiffness model with best ride performance was proposed.
1 Torsional stiffness model of a rubber bushing
Considering the nonlinearity of a rubber torsion bushing and requirements of ride performance, a non-linear model of torsional stiffness is derived from an equation describing the relationship between vertical force and torsional angle. Parameters in the model were qualitatively analyzed, which provides a basis for the parameter optimization below.
Fig.1 shows the structural diagram of the suspension of a certain typeof all-terrain tracked vehicle with a rubber torsion bushing. The length of the road arm isL, and the angle between mounting position and horizontal line is α0.Balanceisregainedafteraverticalforceexertedtoroadwheel,andtheangleisreducedbyα.Letcounterclockwisebepositive.

Fig.1 Structural diagram of suspension
UndertheverticalforceF,theroadarmrotatesanangleofαfromthemountingposition.Accordingtotorquebalance,thefollowingequationisreferred
FLcos (α0-α)=Kαα
(1)
whereKαisthetorsionalstiffnessoftherubbertorsionbushing.VerticalforceFisdeterminedbythefollowingequationderivedfromEq. (1)
(2)
Verticaldisplacementofroadwheelisdeterminedbygeometricrelationshipas
x=Lsinα0-Lsin (α0-α)
(3)
Differentiate vertical forceFby displacementx, the equivalent stiffness of the suspension is
(4)
InEq.(4),thestiffnesscharacteristicsaredeterminedbytorsionalstiffnessKαoftherubbertorsionbushingwhencertainparametersofthesuspensionhavebeendecided.
Rubberelementsshowobviousnonlinearity.Therearevarietiesofsystemmodelsdescribingnon-linearcharacteristics,whilefewofthemfitthecharacteristicsofelasticcomponentsofavehiclesuspension.Fromtheperspectiveofrideperformanceevaluation,goodrideperformancewillbeachievedonconditionwithsmalldisplacement,suspensionshouldhaveweakstiffnesstoisolatehighfrequencysmallamplitudevibrationtoensurecomfortability.Whilewithlargedisplacement,suspensionshowsstrongstiffnesstopreventroadwheelfromcausingshocktovehiclebody.Exponentialfunctionisusedtoexpresstherelationshipbetweentheverticaldisplacement
andforceinaccordancewithdemandsofthestiffnessabove.Withdifferentvaluesoftheexponents,equationsshowdifferentnon-linearcharacteristics.Defineindexmasthenon-linearindex.Pretensioncoefficientkisusedtoreflecttheinitialtracktensioncausedbypreloadmountingangleofthetorsionbushing.Tofacilitatefurtherprocessingoftheexponentialfunction,aswellasweakeningtheinfluenceofnonlinearityoftheverticalforce,attenuationfactornisintroducedtomakeverticaldisplacementxdimensionless.Tosumup,therelationshipbetweentheverticalforceFandtheverticaldisplacementxisexpressedas
(5)
wherekis the pretension coefficient,nis the attenuation factor andmis the non-linear index. To express the relationship of vertical force and torsion angle, the following equation can be obtained by combining Eq.(3) and Eq.(5)
(6)
SubstitutingEq.(6)intoEq.(1),torsionalstiffnessoftherubberbushingis
Lsin (α0-α)]-m
(7)
Three parameters,k,n,m, are studied to observe their respective influence upon the torsional stiffness model. While attenuation factornand non-linear indexmis fixed, take different values of pretension coefficientk, the relationship between torsional stiffness and torsion angle is shown in Fig.2. From the curve, pretension coefficientkonly affects the intercept of the curve, namely the preload torque. The larger the value ofk, the greater the initial preload. The pretension coefficientkhas no influence on the nonlinearity of the stiffness model.
While pretension coefficientkand non-linear indexmis fixed, different values of attenuation factornis taken to study the relation between torsional stiffness and torsion angle, which is shown in Fig.3. The curves show that the attenuation factornaffects the nonlinearity of the stiffness model. The larger the value ofn, the greater reduction it imposes to the nonlinearity of the model, that is, the model has less nonlinearity.

Fig.2 Stiffness-angle with different k

Fig.3 Stiffness-angle with different n

Fig.4 Stiffness-angle with different m
While pretension coefficientkand the attenuation factornis fixed, take different values of the non-linear indexm, and the relationship between torsional stiffness and torsion angle is shown in Fig.4. Note that from the curve that the non-linear indexmaffects the nonlinearity of the stiffness model. The larger the value ofm, the greater nonlinearity the model has.
2 Ride performance evaluation
With standard road roughness as excitation input, dynamics model of the vehicle is built to obtain evaluation index with parameter optimization of the torsional stiffness model. Time histories of vertical acceleration are extracted from dynamics simulation for statistical analysis to get root mean square of the vertical acceleration.
2.1 Generation of road roughness
Road roughness can be generated either by actual road test or by power spectral density transformation. The latter is widely applied in the study of dynamics simulation of vehicle[3]. The fitting expression of power spectral density of road roughnessGq(n) is
(8)
wherenis spatial frequency,n>0, andn0is reference spatial frequency,n0=0.1 m-1;Gq(n0) is the power spectral density at the reference spatial frequency;Wis frequency index, usually has a value of 2.
Considering the driving environment of the vehicle, Grade F, with power spectral density ofGq(n0)=1.638 4×10⁻²m3, is set as the test road roughness in the vehicle dynamics simulation for ride performance evaluation. Standard road roughness is generated by power spectrum inverse transformation function based on harmonic superposition method, and its mathematical model can be expressed as
(9)

2.2Dynamicsmodelingandsimulation
Theresearchmainlyfocusedontheinfluenceofstiffnessmodelofrubbertorsionbushingonsuspensioncharacteristicsandvehiclerideperformance,thusirrelativebodyaccessoriesandprotectivearmorareequivalenttobodymass.Thewholevehiclebodyisconsideredasrigidandparticipatesindynamicsmodelinginformofmassandinertia[4-5].
Multi-rigid-bodymodelofdrivingsystem,whichconsistsoftrack,drivesprocket,roadwheel,idlerwheelandsupportroller,isshowninFig.5.Constraintsareaddedtocorrespondingpartsandpowerisappliedtodrivesprocketaccordingtoparametersofpowersystem.Thetheoreticalmodeloftorsionalstiffnessofarubberbushingisappliedinformofdiscretedatapoints.Theintegralrubbertrackofthevehicleisdividedintoequivalentrigidsegmentsconnectedtoeachother.Longitudinaltensileandbendingstiffnessareintroducedinformofflexibleforcetosimulatestretchingandbendingeffectsoftherubbertrackduringdriving.

Fig.5 Multi-body model of driving system
Theall-terrainvehiclehasafullyloadedweightof6.9tandcurbweightof6.3t.DesignparametersofwheelsystemareshowninTab.1.Roadroughnessobtainedinsection2.1isconvertedtoroadfiletoimportintothesimulationmodel.Speedofthevehicleissetas30km/hinaccordancewithitsconventionaloff-roadspeed.Timehistoriesofverticalaccelerationatcenterofmassa(t)areextractedforstatisticalanalysisofrideperformance.
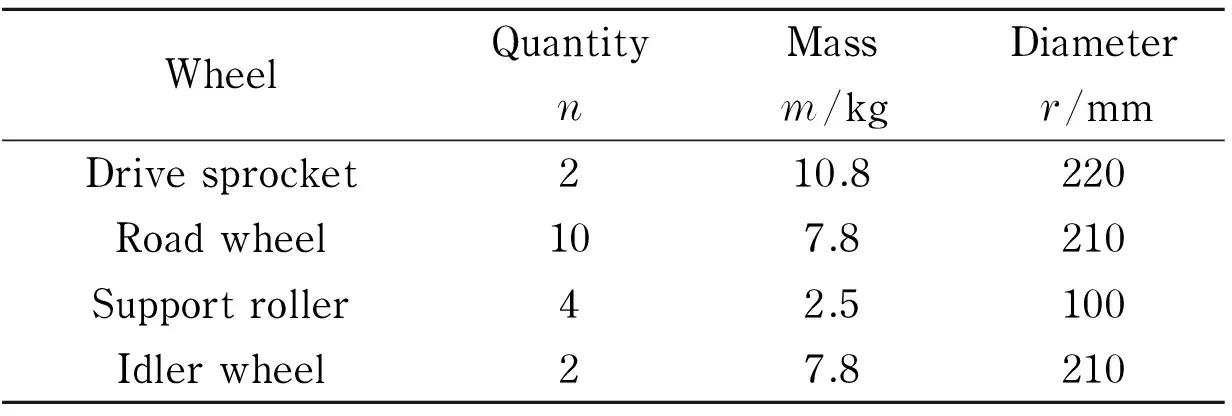
Tab.1 Design parameters of wheel system
2.3 Ride performance evaluation
According to ISO 2631-1:1997(E), root mean square (RMS) of weighted acceleration is used to evaluate the impact of vibration on human comfort and health on vehicle normal driving conditions (including off-road conditions). In this method, RMS of weighted acceleration of each axial is calculated,and then time history of weighted accelerationaw(t) is obtained by filtering accelerationa(t) through weighted frequency functionw(f)[6-7]. RMS of weighted acceleration is calculated by
(10)
Inthecaseofnormaldriving,bothsidesofthevehicletracksaredrivingonsymmetricalroad,whichleadstoverticalvibrationofmasscenterofthevehicle.ThereforeverticalRMSofweightedaccelerationisappliedtoevaluaterideperformance.Weightedfrequencyfunctionisexpressedas
(11)
wherefis the frequency with unit of Hz. Calculation is conducted with time history of accelerationa(t) to obtain power spectral densityGa(f), then the vertical RMS of weighted acceleration is
(12)
3 Optimization based on RSM
Variationofparametersinthestiffnessmodelofrubbertorsionbushing,throughthecomplexsystemofdrivingcomponentsandvehiclebody,leadstoverticalaccelerationchangewithexcitationofroadroughness.Therefore,theoptimizationofthestiffnessmodelisathree-factor,single-objectiveoptimizationproblem.Thistypeofoptimization,ifsimulationiscarriedoutbychangingonefactoratatime,willleadtohighcomputingcostandlowcomputingefficiency.Itmayalsooverlooktheinteractionsamongfactors[8-9].Usingstatistics,responsesurfacemethodology(RSM)canquicklyacquiremaineffectandinteractionamongfactorswithexcitationinput,andthesystemuncertaintycanalsobetakenintoconsideration[10].Responsesurfaceofthesystemanditsfittingequationcanbeobtained,aswellastheoptimalsolution.Thismethodissuitablefortheoptimizationofthemodelinthiscase[11].
Quadraticfunctionwithcrossedtermsisusedtoconstructresponsesurfacefunction,whichcanbeexpressedas
(13)

Thepredictivecapabilityofresponsesurfacemodeldependsonthedegreeoffittingapproximationoftheresponsesurfacefunctiontotheexperimentaldata.ItisevaluatedbymultiplecorrelationcoefficientR2,whichcanbedescribedasEq.(14).Thecloserthevalueto1,thesmallertheinfluenceoferroris.
(14)
whereSYis the sum of square of the differences between response values and mean response value,SEis the sum of square of the differences between response values and predicted response values,SRis the sum of square of the differences between predicted response values and mean response value, which can be expressed respectively as
(15)
(16)
SR=SY-SE
(17)
3.1 Design of simulation tests
Three parameters ofk,nandmof torsional stiffness model of rubber bushing are the variables in the optimization model. With reference to actual stiffness acquired through product test, qualitative analysis in section 1 and engineering practice, the optimal ranges of variables are chosen as 6 500≤k≤10 500, 0.30≤n≤0.60, -3≤m≤-1. Therefore, the optimization problem can be expressed as
(18)
SimulationtestsaredesignedbyCCD,proposedbyBoxandWilsonin1951[12],whichiscurrentlythemostwidelyuseddesignmethodforquadraticresponsesurfaceproblem.Itcombinestraditionaldistributionofdifferencepointswithfullfactorialorfractionalfactorialdesign[13]. 20simulationtestsaredesignedaccordingtotheCCDmethod, 8ofwhicharefactorialtestsand6areaxialtests.Toensuretheprecision,centretestarerepeated6times.ThevaluesofimpactfactorsareshowninTab.2.

Tab.2 Tests design and response values
The values of impact factors are changed in dynamics model according to the simulation tests designed by CCD, and the tests for ride performance evaluation are carried out. RMS of weighted acceleration is acquired as response value, also shown in Tab.2.
3.2 Modeling and analysis of response surface
Quadratic function with crossed terms is used to construct response surface function of acceleration, which is expressed as
α5km+α6nm+α7k2+α8n2+α9m2
(19)
where αi(i=0-9)areundeterminedcoefficients.
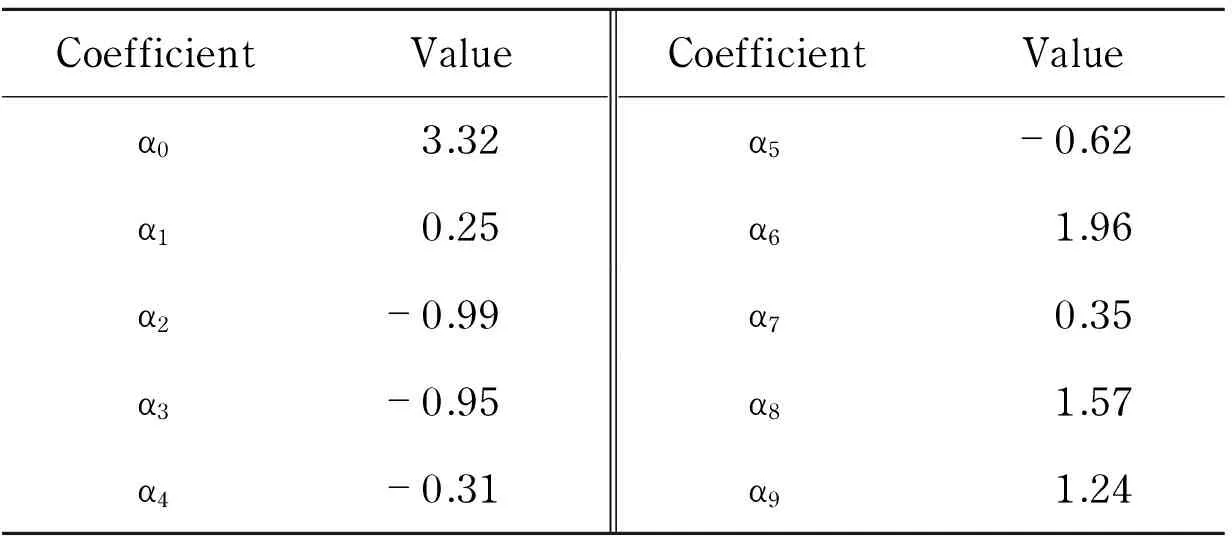
Accelerationdataextractedfromsimulationisprocessedbydesignexperttosolveundeterminedcoefficientsintheresponsesurfacefunction.ThecoefficientsoftheregressionequationareshowninTab.3.

Tab.3 Coefficients of response surface model (actual)
The multiple correlation coefficientR2of the predictive model is 0.934 0, which means the response surface model is quite suitable for simulation data, and is capable of predicting response values.
The values of the impact factors are normalized to facilitate the comparison of effects. The coefficients of the regression equation are shown in Tab.4 after normalization. The contour diagrams of Fig.6 to Fig.8 show their interactive effects to response values of the pretension coefficientk, the attenuation factornand the non-linear indexm.
Tab.4 Coefficients of response surface model (after normalization)
Fig.6 shows the interactive effect on response values, which are marked with labels, of pretension coefficientkand attenuation factorn. The contours show that attenuation factornimposes a more significant effect on the predictive model than pretension coefficientk.

Fig.6 Contour of response surface with k and n
Fig.7 shows the interactive effect on response values of pretension coefficientkand non-linear indexm. The conclusion is that non-linear indexmhas a more significant effect on the predictive model than pretension coefficientk.

Fig.7 Contour of response surface with k and m
Fig.8 shows the interactive effect on response values of attenuation factornand non-linear indexm, where the attenuation factornimposes a more significant effect on the predictive model than non-linear indexm.
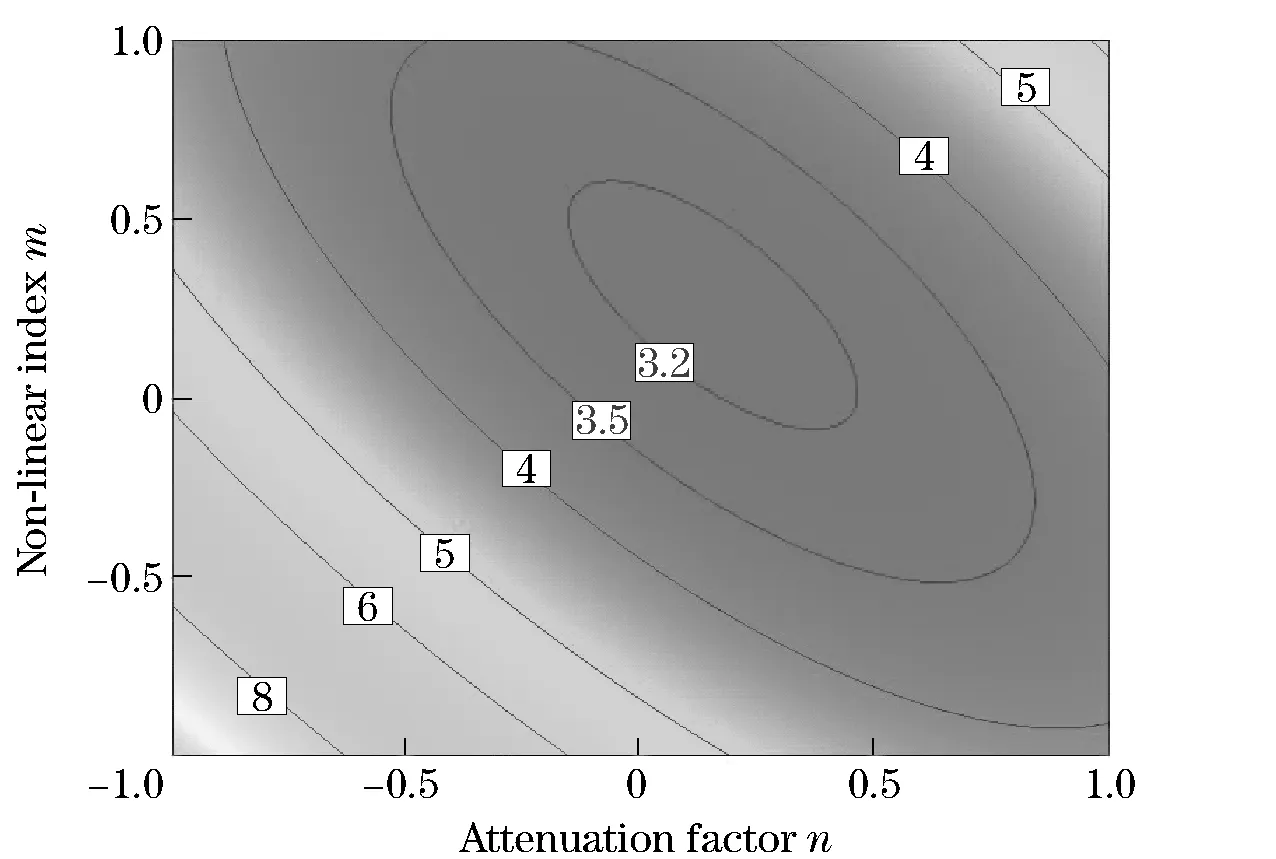
Fig.8 Contour of response surface with n and m
Comparison of Fig.6, Fig.7 and Fig.8 shows that the attenuation factornimposes the most significant effect on ride performance of the vehicle, followed by the non-linear indexmand the pretension coefficientk. It is also reflected in the linear and quadratic terms of the predictive equation that |α2|>|α3|>|α1|,|α8|>|α9|>|α7|.Theextremevaluecanbefoundfromthecontourdiagramoftheresponsesurface,whichisatthecenterofthecontour.Theoptimalsolutionisobtainedwhentheresponsevaluehasaminimumof3.122 97m/s2atk=8 349.12, n=0.47, m=-1.76.

Fig.9 Stiffness-angle before and after optimization
Fig.9showsthetorsionalstiffnesscharacteristicsofboththeoptimalsolutionandtheactualstiffnessofproduct.Comparedwithactualstiffness,thecurveshowsthatwithinthefrequentworkingangle,theoptimizedmodelstrengthenedthenonlinearity.ARMSofweightedaccelerationis3.463 7m/s2bysimulationwiththeactualstiffness.Comparedwiththepredictedresponsevalue,theoptimizedmodelreducedtheverticalaccelerationby9.84%,whichmeansanobviousimprovementofthevehiclerideperformance.
4 Conclusions
①Accordingtothevehiclesuspensionstructure,atorsionalstiffnessmodelwasestablishedwithconsiderationtononlinearityoftherubberbushingandrequirementsoftherideperformance.Parametersinthemodelwerequalitativelyanalyzedtostudytheirrespectiveinfluenceonthemodel.
②Dynamicsmodelofthevehiclewasestablishedwiththetorsionalstiffnessmodelappliedindrivingsystem.Flexibleforcewasusedtosimulatecharacteristicsofarubbertrack.RoadroughnessofFgradewasutilizedasexcitationinputforthesimulation,wheretheverticalaccelerationwasextracted.
③Responsesurfacemethodologywasusedtobuildthepredictivemodelfortorsionalstiffnesscharacteristicsoptimization,withparametersinstiffnessmodelasoptimizationvariablesandrootmeansquareofweightedaccelerationfromdynamicssimulationasresponse.Optimalsolutionwasacquiredwithinfeasibleregion,andrideperformancewasimprovedcomparedwithactualtorsionalstiffnesscharacteristics.Thestudyprovidesatheoreticalbasisforthedesignofrubbertorsionbushingindifferenttypesoflighttrackedvehicles.
[1] Feng Fuyong, Hong Wannian, Zhang Yong. Survey of twin cabin all-terrain tracked vehicle development [J]. Vehicle & Power Technology, 2011(3): 57-60. (in Chinese)
[2] Zuo Peng, Cheng Kai, Zhou Yize. Research on torsion bar spring of all-terrain articulated crawler transporter [J]. Journal of Machine Design, 2011,28(8): 12-16. (in Chinese)
[3] Liu Hui, Fu Shengping, Xiang Changle. Torsional random excitation of tracked vehicle powertrain system caused by road roughness [J]. Transactions of the Chinese Society for Agricultural Machinery, 2010, 41(12): 1-6. (in Chinese)
[4] Feng Jinzhi, Liu Le, Zheng Songlin. Load simulation analysis on a car suspension system[J]. Automotive Engineering, 2012,34(10): 913-917. (in Chinese)
[5] Guan Xin, Wu Zhenxin, Zhan Jun. A study on suspension modeling for real-time vehicle dynamics simulation[J]. Automotive Engineering,2007,29(5): 433-436. (in Chinese)
[6] Yu Zhisheng. Automotive theory[M]. Beijing: China Machine Press, 2005: 203-206. (in Chinese)
[7] Zhao Liuqi, Liu Feng. Revise the evaluation method of vehicle ride performance with reference to the new ISO 2631 draft[J]. Automotive Engineering, 1993, 15(6): 371-377. (in Chinese)
[8] Rui Qiang, Wang Hongyan. Suspension optimization study based on response surface method[J]. Journal of Academy of Armored Force Engineering, 2006,20(4): 49-52,55. (in Chinese)
[9] Pan Feng, Zhu ping. Improved response surface method for constrained optimization and its application to lightweight design of autobody structures[J]. Journal of Mechanical Engineering, 2011,47(10):82-87. (in Chinese)
[10] Hill W J ,Hunter W G. A review of response surface methodology[J]. Technometrics, 1975, 31(12):803-851.
[11] Pratheepa B. Modeling and simulation of automobile suspension system[C]// Frontiers in Automobile and Mechanical Engineering (FAME), Piscataway, NJ, USA, 2010: 377-382.
[12] Box G E P, Wilson K B. On the experimental attainment of optimum conditions [J]. Journal of Royal Statistical Society, 1951, 13(1): 1-45.
[13] Picheny V, Kim N H, Haftka R T. Application of bootstrap method in conservative estimation of reliability with limited samples[J]. Structural and Multidisciplinary Optimization, 2010, 41(2): 205-217.
(Edited by Cai Jianying)
10.15918/j.jbit1004-0579.201524.0312
U 463.334 Document code: A Article ID: 1004- 0579(2015)03- 0361- 08
Received 2014- 01- 12
E-mail: zhengxin911@gmail.com
猜你喜欢
 Journal of Beijing Institute of Technology2015年3期
- Journal of Beijing Institute of Technology的其它文章
- High-rise building fire pre-warning model based on the support vector regression
- Dynamic modeling and simulation for the flexible spacecraft with dynamic stiffening
- Experimental study on the time-dependent dynamic mechanical behaviour of C60 concrete under high-temperatures
- Experimental study on compression stroke characteristics of free-piston engine generator
- Numerical simulation and optimization of the cylinder head water jacket based on the two-phase flow boiling heat transfer
- Multi-action-based approach for constructing knowledge map