
Polymer flow through water- and oil-wet porous media*
2015-11-25 11:31HATZIGNATIOUDimitriosMORADIHojatSTAVLANDArne
水动力学研究与进展 B辑 2015年5期
HATZIGNATIOU Dimitrios G., MORADI Hojat, STAVLAND Arne
1. University of Stavanger, Institute of Petroleum Technology, N-4036 Stavanger, Norway
2. International Research Institute of Stavanger, IRIS Energy, N-4021 Stavanger, Norway,E-mail: Dimitrios.Hatzignatiou@iris.no
Polymer flow through water- and oil-wet porous media*
HATZIGNATIOU Dimitrios G.1,2, MORADI Hojat1, STAVLAND Arne2
1. University of Stavanger, Institute of Petroleum Technology, N-4036 Stavanger, Norway
2. International Research Institute of Stavanger, IRIS Energy, N-4021 Stavanger, Norway,E-mail: Dimitrios.Hatzignatiou@iris.no
2015,27(5):748-762
The effect of wettability on polymer behavior in porous media is investigated through a series of synthetic polymer floods conducted in water- and oil-wet Bentheim and Berea sandstone cores. A new experimental setup is used in which the core effluent polymer concentrations are not measured during polymer flooding, but instead are passed through a capillary tube that is connected to the core outlet. Using the notion of intrinsic viscosity, an approximate expression is presented that can be used to determine the breakthrough time of the injected polymer solution. In addition, polymer adsorption, inaccessible pore volume, and apparent viscosities are evaluated for all cores and wetting conditions. In general, in the presence of residual oil, the oil-wet cores display the lowest degree of polymer retention (Berea) and the lowest inaccessible pore volume-IPV (Bentheim). The largest wettability impact on the polymer behavior in porous media appears to be for the Berea formation; polymer retention in oil-wet cores decreases 90% and IPV 52% compared to the corresponding amounts for the water-wet ones. On the other hand, the estimated polymer retention and IPV values appear to be similar for the oil- and water-wet Bentheim cores, this is attributed to questionable wettability alteration.
polymer flow in porous media, formation wettability, polymer retention, inaccessible pore volume, permeability reduction, resistance factor
Introduction
Due to the molecule size and the ionic nature of synthetic polymers from one side, and the pore size and surface charge of the formation rock on the other,there are significant interactions between the transported polymer molecules and the rock surface. These interactions, in the form of adsorbed and trapped polymer molecules, result in reduced rock permeability and diminishing polymer effectiveness in displacing formation oil. Adsorption, mechanical entrapment and hydrodynamic retention are the three main retention mechanisms of polymer retention in porous media.
The interaction between polymer molecules and solid surface causes the former to be bounded to the solid surface mainly by physical adsorption. Low permeability formations have higher surface available for interaction with the injected polymer, and thus display increased levels of adsorption. On the other hand, very low permeability formations display low levels of polymer adsorption due to the inability of the polymer to enter the small pore throats, thus leaving a large part of the porous space inaccessible to the injected polymer. Retention by mechanical entrapment may also occur when larger polymer molecules are trapped in narrow flow channels thus blocking the flow paths. This most likely will increase polymer trapping upstream of blockage site. If the number of polymer entrapment locations exceeds a critical number, the flow through the core will cease.
Results from core flood experiments illustrated that, in absence of adsorption, polymer moves through the porous media faster than tracers. Therefore, polymer breakthrough time is a balance of inaccessible pore volume (IPV) and polymer adsorption. IPV is viewed either as the fraction of pore space with pore entrance radii too small for polymer molecule to enter or by the depleted layer theory which suggests that polymer concentration close to the pore surface is considerably lower than in the middle of the pore. The thickness of the depleted layer is similar to the polymer size. By both explanations, IPV should increase withthe polymer molecular weight (MW)[1]. In flood experiments permeability reduction, RRF, is related to polymer adsorption. The simplest approach is to assume bundle of capillary tubes and an absorbed layer with thickness equal to the polymer size; RRF will then increase by increasing polymer MW or decreasing permeability.
A literature survey conducted by Manichand and Seright[2]on polymer characteristics (IPV and retention) and reported laboratory measured polymer-retention and IPV values of nearly zero (0 µg/g to 20 µg/g)and 0% PV to 10% PV, respectively, from corefloods conducted in two core samples originated from two sand zones in the same field. Field data, however, indicated much higher polymer-retention values ranging from 50 µg/g to 250 µg/g. Zhang and Seright[3]investigated the effect of HPAM polymer concentration on retention in porous media and concluded that, in the absence of oil saturation, three polymer-retention behavior regimes may be observed in dilute, semi-dilute and concentrated regions. In both dilute and concentrated regions, polymer retention is independent of concentration, whereas in semi-dilute regions polymer retention displays a concentration dependent behavior. Rodriguez et al.[4]studied polymer transport properties in 4 Darcy permeability sand packs as a function of injected polymer concentration. For polymer injection concentrations of 0.8 g/l, 2 g/l and 2.4 g/l, polymer retention of 5.4 µg/g, 32.9 µg/g and 62.9 µg/g and IPV of 0% PV, 2% PV and 5% PV, respectively, were reported, these values show that both polymer retention and IPV depend heavily on polymer concentration.
Park et al.[5]considered the effect of polymer adsorption-induced permeability reduction on oil recovery factor in low permeability sandstone formations,and reported that oil recovery was not increased proportionally with the increase in polymer concentration. In fact, recovery factor started to decrease when injected polymer concentration increased above a certain level. This oil recovery reduction was attributed to polymer adsorption/concentration dependency with the formed polymer adsorption layer at high concentrations causing a significant permeability decrease.
Most research work was performed either under single-phase flow conditions or using water-wet porous media due to the complexity of polymer behavior. Literature lacks of critical studies, which address synthetic polymer behavior in the present of residual oil saturation, and most of the works have been conducted on water-wet cores. The retention of a xanthan biopolymer in Brent shaly sandstones cleaned with various solvents, thus displaying different wettability characteristics, was examined by Lund et al.[6]. The cores were flooded to residual oil saturation using reservoir crude oil followed by polymer flood. The authors reported that polymer retention was critically dependent on the followed cleaning procedure. Solvent(toluene and methanol) cleaned cores became water wet and the retention at residual oil saturation was 30 μg/g rock. On the other hand, kerosene-brine washed cores became oil/mixed wet and polymer retention was very low, 5 μg/g rock. In the absence of crude oil, polymer retention increased up to 50 μg/g rock in the water-wet core samples. This last result conflicts observations reported by Zaitoun and Kohler[7]who reported that polyacrylamide (PAM)and polysaccharide polymer retention levels at residual oil saturation to be almost the same as the ones at full water saturation. Lund et al.[6]also found that the cores’ IPV was around 17% and insensitive to the cleaning procedure, oil saturation, temperature, and clay content. Finally, the authors observed that polymer retention was not sensitive to the high clay content of 7%-16% or variations in the amount of clay. In a recent work, Bennetzen et al.[8]reported on experiments in oil-wet carbonate cores. HPAM polymer adsorption in high salinity brine was in the range of 10 g/g-20 g/g rock with an IPV of 15%-20%. The authors attributed the low polymer adsorption to the strong oil-wetness. This is in agreement with previous results by Lund et al.[6]who reported on very low xanthan retention in oil-wet reservoir sandstone.
Broseta et al.[9]investigated the influence of core wettability and presence of oil on polymer adsorption/ retention on both hydrophilic (siliceous or quartzitic sands) and hydrophobic (silane treated siliceous or quartzitic sands resulting in the formation of a nanometer-thick alkane layer) substrates. Polymer adsorption was estimated based on a series of core (sand pack) flood experiments conducted using PAM (neutral), HPAM (anionic), and polysaccharides (xanthan and scleroglucan). For the most common EOR polymers, adsorption increased with surface hydrophobicity, the effect being stronger for (1) neutral synthetic polymers and polysaccharides than for anionic synthetic polymers (hydrolyzed polyacrylamides), and (2) in hard and acid brines. This effect disappears in soft brines for anionic polymers, which display low adsorption tendencies on both hydrophobic and hydrophilic substrates. In the presence of oil (dodecane) the authors reported that PAM retention/adsorption decreased considerably in oil-wet cores, and slightly increased in water-wet systems. Broseta et al.[9]concluded that in water-wet cores, residual oil offers an additional adsorbing surface to the polymer, whereas in oil-wet cores the oil wetting film offers to the polymer a small adsorbing surface compared to the no longer accessible rock surface.
Based on an experimental investigation of strongly water-wet Berea and mildly oil-wet Warden core samples, Zheng et al.[10]concluded that adsorption ofa high molecular weight HPAM induces a selective reduction of water relative permeability compared to the oil one. This water relative permeability reduction was attributed to both pore size reduction and wettability changes (increased water wetness) occurred due to polymer adsorption, which also resulted to an increase of the irreducible water saturation. Although polymer adsorption amounts were reported, no direct comparison on the effects of core wettability could have been made since the cores were different and of variable properties (permeability and porosity).
A 2-D glass micro-model was used by Meybodi et al.[11]to get a better understanding of polymer chemistry and rock wettability on the polymer flood performance. Various polymer molecular weights, degrees of hydrolysis, and polymer concentrations were tested in both water-wet and oil-wet systems and the image processing technique was used to analyze and compare microscopic and macroscopic behaviors of polymer displacements. Oil recoveries, both at breakthrough and end of process, were in general higher in water-wet media compared to the ones from oil-wet formations. On the microscopic displacement,Meybodi et al.[11]observed thick, connate-water films on the pore walls of a strongly water-wet medium with discontinuities of injected polymer occurring primarily within the pore necks. The microscopic displacement was favorable resulting in a relatively uniform front that improved the sweep efficiency. In a strongly oil-wet medium, thick, connate-water film was absent from the grain surfaces. A trapped water phase within the oil phase, and polymer trapping, both in pore bodies and necks, were observed. The injected polymer seldom swept the oil phase completely and the competition between capillary and viscous forces had a significant influence on the front stability and thus microscopic displacement.
In a recent study, Yun and Kovscek[12]used etched silicon micromodels to examine the retention of an HPAM solution under single-phase flow using image analysis. The investigated factors were salinity of displacing water, change of wettability of the micromodel surface, and polymer mechanical degradation. Increasing brine salinity resulted in less polymer retention, due to the contraction of HPAM molecules,and thus a decrease of the thickness of polymer adsorption. The strongly water-wet surface nature of the micromodel was altered by deposition of crude oil and CTAB. Oil-wet micromodels aged by crude oil showed larger polymer retention than the polymer retention on water-wet micromodels. On the other hand,polymer retention for the CTAB treated micromodel was lower compared to polymer retention observed in the water-wet micromodel. The authors reported a lower polymer retention for filtered than unfiltered polymer solutions.
Hatzignatiou et al.[13]investigated experimentally the behavior of a synthetic polymer while flowing in water-wet and oil-wet Berea core samples. The authors concluded that formation wettability impacts significantly the amount of polymer adsorbed as well as oil recovery, and further investigated the apparent polymer viscosity as a function of applied shear rate. Adsorbed polymer onto the rock coats rock surfaces with a hydrophilic film which swells when water passes over it, this causes the water effective permeability to be reduced. The phenomenon of polymer coat swelling does not occur in the presence of oil, which implies that polymers can reduce to large extent water mobility in relatively low oil saturation regions, thus increasing oil recovery factors[14]. Since the amount of adsorbed polymer controls the reductions of water relative permeabilities, irreducible water saturation, and thus oil recovery from a formation[10]the understanding of these phenomena on the effectiveness of oil displacement processes is vital.
Unlikely with the work of Broseta et al.[9], in this work a synthetic polymer’s flow behavior in Bentheim and Berea porous media in the presence of oil is presented and the effects of formation wettability on parameters related to polymer flooding are investigated. For the core floods, the Lund et al.[6]experimental approach was followed in developing the cores’ initial conditions but a different approach applied in altering the wettability of water-wet Bentheim and Berea formations. A simple expression for pressure drop across a capillary tube as a function of polymer concentration[13]is used to predict the breakthrough time of the injected polymer based on the recorded pressure drop across a capillary tube, which is mounted at the end of the core. Core flood results (oil production and pressure drops, polymer behavior in porous media, apparent polymer viscosity, polymer breakthrough time, polymer retention, IPV, RRF) observed from our laboratory experiments for both Bentheim and Berea sandstone water-wet and oil-wet cores are presented, analyzed and compared.
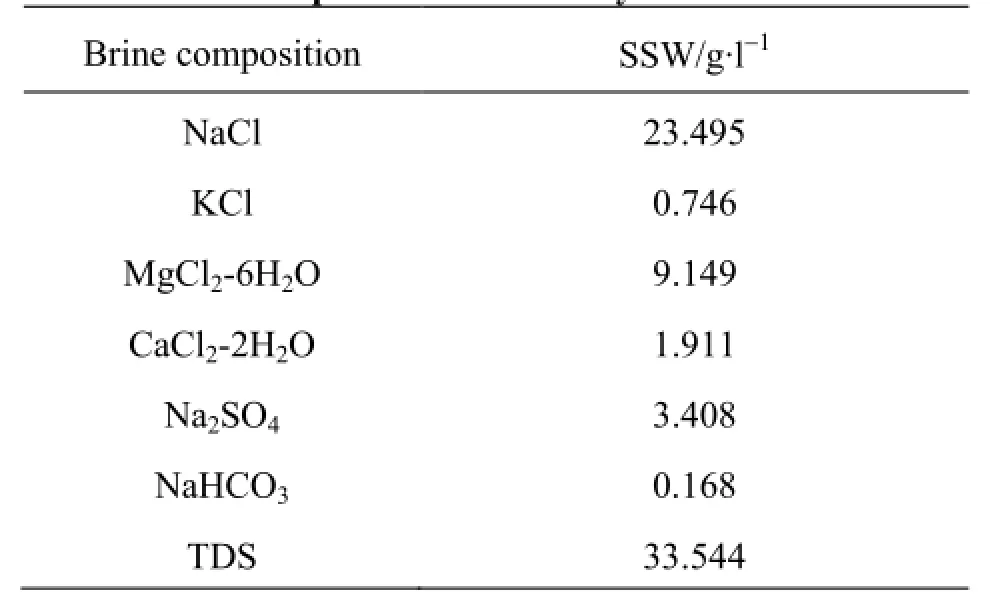
Table 1 Brine composition and salinity

Table 2 Bentheim and Berea core samples’ properties
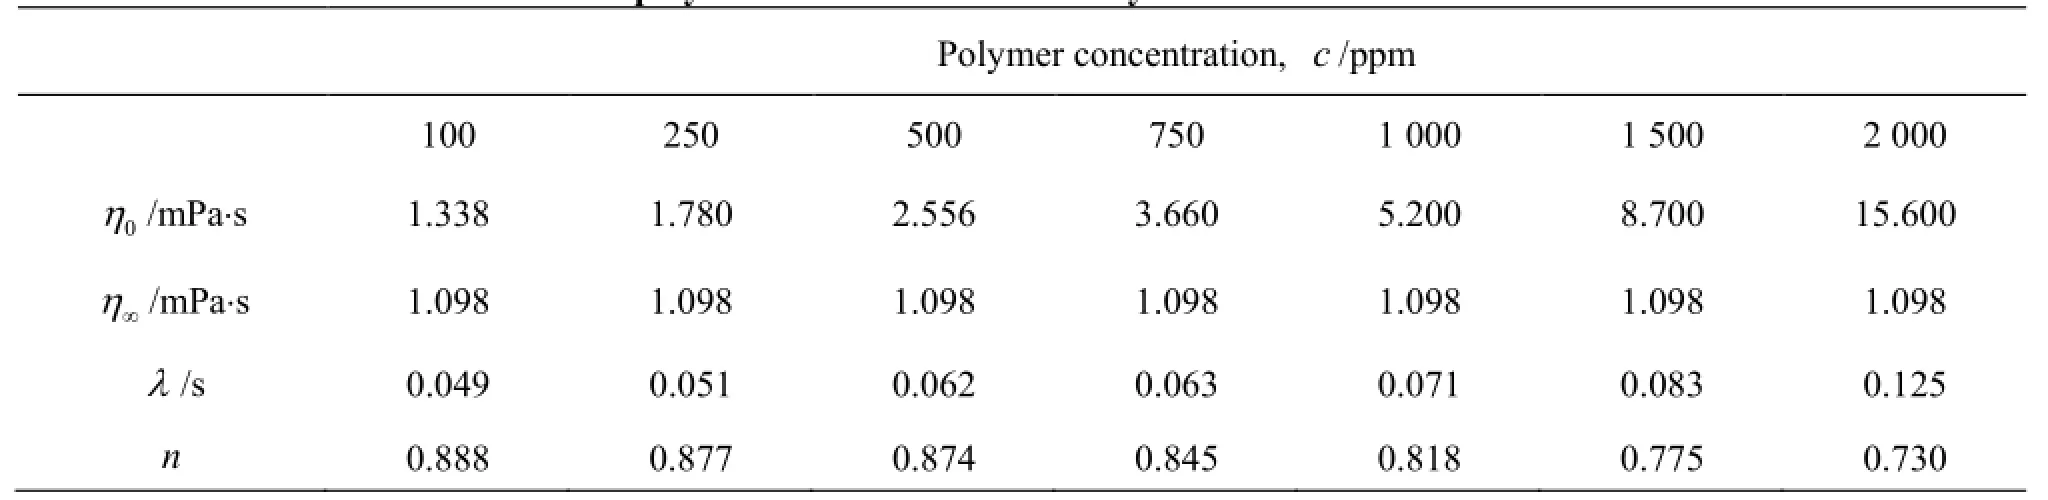
Table 3 Parameters used to match the polymer 3630S in SSW viscosity to a Carreau model
1. Bulk measurements and core flooding experiments
The synthetic polymer, 3 630S, with a molecular weight of 2×10⁷Dalton, 30% degree of hydrolysis and medium to high anionicity was used to form polymer solutions in synthetic sea water (SSW), see Table 1. Each solution was diluted into various polymer concentrations and the bulk viscosities of these diluted solutions were measured as a function of the applied shear rate.
All bulk viscosities were measured using an Anton Paar Physica MCR 301 rheometer. Measurements were conducted at 20oC and variable shear rates ranging from 0.1 s-1up to 500 s-1using a cone-measuring head. Polymer viscosities were measured both at increasing and at decreasing shear rate sequence. It was found that measured viscosities were of a higher accuracy while the shear rate decreases rather than increases.
Four core samples were used for the core flooding experiments, two Bentheim and two Berea sandstone core samples. Normally, both Bentheim and Berea formations are strongly water-wet. The wettability of the two core samples, one of each type, was altered with Quilon to intermediate and oil wet, respectively. The wettability alteration treatment procedure was presented by Hatzignatiou et al.[13]. The relevant core properties of the various samples used in the four core flooding experiments are listed in Table 2.
All experiments were conducted at ambient temperature (~20oC) and a backpressure of 106Pa. Isopar-H, with a viscosity of 1.3 mPa·s was used in all core floods as the oleic phase. In order to detect changes in the effluent viscosity, a capillary tube was connected to the core holder and the polymer effluent introduced to the capillary tube immediately after coming out of the core holder, the pressure drop across the capillary tube was also recorded during all the experiments. Thecapillary tube was 1 m long and had 0.635 mm(0.000635 m) inner diameter. The typical core flooding procedure followed has been described by Hatzignatiou et al.[13].

Table 4 Carreau and power-law models viscosity parameters-400 ppm polymer 3630S in SSW
2. Polymer bulk rheology
The experimental bulk rheology properties of the synthetic polymer used in the core flood experiments were presented in details by Hatzignatiou et al.[13]. Therefore, only core flood results are presented when the diluted polymer solutions were injected into both water- and oil-wet Bentheim and Berea core samples.
2.1 Bulk viscosity versus shear rate-polymer 3630S
The HPAM polymer 3630S was mixed in SSW and the resulting polymer solutions’ bulk polymer behavior as a function of the applied shear rate was evaluated for polymer concentrations ranged from 100 ppm to 2 000 ppm. The SSW measured viscosity was 1.097 mPa·s and used as a solvent viscosity,η∞,for rest of measurements. The measured polymer bulk apparent viscosity vs. shear rate data has been fitted with the Carreau model and Table 3 summarizes all estimated parameters. This table shows that although the exponent constant,n, is decreasing as the polymer concentration increases, both the time constant,λ,and viscosity at zero shear rates,η∞, increase with the polymer concentration. Hatzignatiou et al.[13]showed that brine salinity decreases significantly the viscosity of synthetic HPAM polymer solutions. The same results show that the divalent-ion content has more effect on polymer viscosity than salinity, higher amount of divalent-ion content in SSW reduces the polymer molecule extension more, and as a result, the viscosity of the polymer decreases enormously, this is in addition to tendencies for polymer precipitation.
2.2 Analysis of measured bulk viscosity data
All polymer flooding experiments were conducted using a 400 ppm 3630S polymer concentration in a SSW solution. Table 4 provides the Carreau model parameters developed by matching the measured experimental polymer viscosities. A power law model was also matched on the shear thinning part of the viscosity/shear-rate graph and the results are given below.
2.3 Intrinsic viscosity
The intrinsic viscosity,(η), is obtained by plotting either the reduced or inherent viscosity against the polymer concentrations and extrapolating the resulting straight line to zero polymer concentration. Table 5 summarizes the calculated intrinsic viscosities, as well as the Huggins and Kraemer constantsand′.
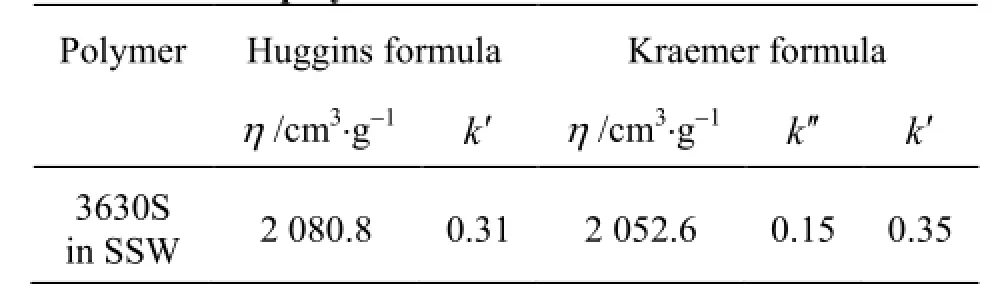
Table 5 Intrinsic viscosity and Huggins constant for the 3630S polymer-low shear rates
3. Polymer flow through a capillary tube
Hatzignatiou et al.[13]examined polymer flow in a capillary tube and derived a simplified relationship between pressure drop across capillary tube and polymer concentration. In their procedure, Newtonian SSW and non-Newtonian polymer solution, 400 ppm 3630S polymer concentration, were injected through a capillary tube at the various rates and at ambient temperature. Using the Huggins formula, a relationship was obtained between polymer viscosity and its concentration, which was used to establish a linear equation between the pressure drops across the capillary tube and the polymer normalized effluent concentration. This relationship suggests that the capillary tube differential pressure profile has a one to one correspondence to the effluent polymer concentration profile. Therefore, a change in the effluent polymer concentration is indicated directly from a variation in the pressure drop across the capillary tube. Based on these findings, a pressure drop of 1 350 Pa corresponds to a c/c0value of 0.5, which indicates the polymer breakthrough time. It should be noted that one of the main factors affecting intrinsic viscosity is polymer size, which is a function of shear rate. The development of this simplified relationship was based on a constant intrinsic viscosity at a shear rate of 130 1/s,which corresponds to a capillary tube flow rate of 0.2 m l/mi n. In additio n, due to its app roxi mate nature,basedonNewtonianfluidbehavior(anassumptionthat is violated at higher polymer concentrations and/ or high flow rates), this relationship should not be used to compute effluent polymer concentrations as a function of measured capillary pressure drop across the capillary tube. Another reason is because of inaccuracies in the measurement of the differential pressure across the capillary tube due to experimental difficulties, equipment malfunction, etc..
4. Wettability alteration
The impact of wettability on polymer flow/behavior in porous media was evaluated by using Bentheim and Berea core samples treated with Quilon to alter their wettability. The effectiveness of the Quilon treatment on the wettability of cores was determined by interpreting the oil production and pressure drop across the core profiles during water injection conducted to establish the residual oil saturation,Sorw(see Hatzignatiou et al.[13]for the graph of normalized oil recovery against pore volume of water injected for water- and oil-wet Berea cores).
4.1 Bentheim core samples
SSW was used to flood the water-wet Bentheim core sample at a constant rate of 0.2 ml/min and the pressure difference across the core and amount of oil production were recorded as a function of time. The water breaks through the water-wet core at 0.38 PV of injected water, with a normalized recovery of 0.99 and this is primarily due to the high oil relative permeability which yielded a very favorable end-point mobility ratio of 0.16. The normalized oil recovery reaches unity at approximately 1 PV of injected SSW. The pressure drop across the core increased rapidly before SSW breakthrough due to two phase flow inside the core. After SSW breakthrough, the pressure drop across the core stabilized at approximately 4 000 Pa after approximately 1.5 PV of injected SSW, this could be interpreted as negligible change in fluid saturations in the core sample and thus negligible oil production which agrees with the recorded oil recovery. The oil production and pressure drop across core behavior indicate a strongly water-wet core sample.
For the altered wettability Bentheim core, the SSW injection rate was also constant and 0.9 ml/min,the injected water breaks through after 0.35 PV of injected water with a normalized oil recovery is 0.72. Unlikely with the Berea oil-wet core sample, after the SSW breakthrough time there appears to be another“major” event around 1.5 PV, with the oil recovery increasing very slowly and approaching a normalized oil recovery of unity at approximately 42 PV of injected water. The pressure across the core increased sharply until breakthrough time and afterwards it decreased gradually to a stabilized level of approximately 20 000 Pa after 20 PV of injected water. After breakthrough time the recorded pressure drop across the capillary tube displayed some abnormal fluctuations while the effluent changed its color from colorless to green before becoming a jelly-like colloid. This was most likely due to interactions, within the core, between the oil (Isopar H), SSW and coretreatment chemicals used for wettability alteration (Quilon is a dark green solution that contains trivalent chromium which may not have been deactivated properly this partially crosslinking the HPAM).
4.2 Berea core samples
SSW was injected into the water-wet Berea core samples at a favorable end-point mobility ratio of 0.15 and at a constant injection rate of 0.9 ml/min. The pressure differential across the core and the amount of oil production were recorded as a function of time. For this core sample, the water breaks through at 0.46 PV of injected water, with a normalized oil recovery factor of 0.98. The normalized oil recovery reaches unity at approximately 2.5 PV of injected SSW (only very small amounts of oil were produced from breakthrough time to the total 28 PV of injected SSW). The recorded pressure drop across the core increased rapidly before SSW breakthrough due to the presence of two-phase flow inside the core. After the SSW breakthrough, the pressure gradually stabilized at around 64 000 Pa after approximately 12 PV of injected SSW. The oil recovery profile and the behavior of the pressure differential across the core both suggest a waterwet core.
For the oil-wet Berea core, with the same water injection rate of 0.9 ml/min, the water breaks through at 0.35 PV of injected water when the normalized recovery is 0.64. After breakthrough time, the oil recovery increases gradually as a function of time and approaches a normalized oil recovery of unity at approximately 27 PV of injected water. The recorded pressure drop across the core increased rapidly before SSW breakthrough and started to decline rapidly immediately after SSW breakthrough and then gradually tend to reach a stabilized pressure drop of approximately 14 000 Pa after 20 PV of injected SSW. The oil recovery profile and the pressure differential across the core suggest an oil-wet core. Finally, the pressure drop across the capillary tube follows a similar behavior to the one for the differential pressure across the core, but it tends to get stabilized at 5 000 Pa after only 4 PV of injected water.
5. Water-wet bentheim and berea sandstone core samples
5.1 Polymer retention
5.1.1 Bentheim formation
The retention of the injected polymer in the po-rous media was investigated by conducting consecutive polymer solution and SSW injections. After achieving the residual oil saturation,Sorw, the first polymer flooding was conducted at a constant rate of 0.2 ml/min, followed by SSW flooding with the same injection rate. The second polymer flooding was carried out at the same injection rate of 0.2 ml/min immediately after the SSW injection, with the flooding continued until the differential pressure across the core and the capillary tube were stabilized. Subsequently, a series of polymer floods were conducted at various injection rates.
Polymer started to get retained immediately when the polymer solution is entered the porous media and therefore, polymer breakthrough is delayed significantly in the first polymer flooding. Since all, or the majority of, polymer retention takes place during the first polymer flooding, depending on the volume of injected polymer solution, polymer breakthrough in the second polymer flooding should occur much faster than in the first polymer flooding. The amount of polymer retained in porous media is calculated by comparing polymer breakthrough times in the first and second polymer floodings.
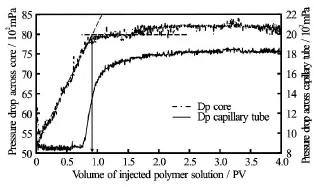
Fig.1 First polymer flooding: Pressure drop profiles across the core and capillary tube vs. time and polymer breakthrough time evaluation-Bentheim water-wet sandstone core sample
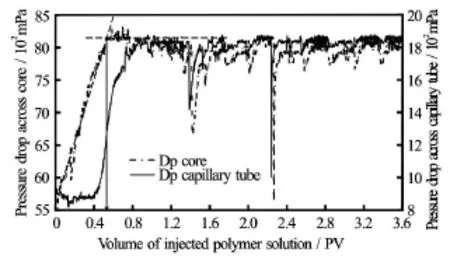
Fig.2 Second polymer flooding: Pressure drop profiles across the core and capillary tube vs. time and polymer breakthrough time evaluation-Bentheim water-wet sandstone core sample
Figures 1 and 2 display the recorded differential pressures across the Bentheim water-wet core and the capillary tube for the first and the second polymer flooding. These results show that after a rapid increase in the differential pressure across the core (brown curve) measured prior to the injected polymer breakthrough time, the pressure differential levels off and tends to stabilize at a time depending on the core and fluid properties as well as the injected fluid ones. The intersection of the two straight lines fitted to the preand post-polymer breakthrough periods determine the breakthrough time of the injected polymer (solid arrow). This breakthrough time agrees very well with the breakthrough time indicated by the measured capillary tube differential pressure (curve) that corresponds to an effluent polymer concentration of c/ c0=0.5, or a ∆pacross the tube of 1 350 Pa. Based on the results shown in Figs.1 and 2, the two polymer breakthrough times occurred at 0.905 and 0.525 injected polymer pore volumes for the first and second polymer flooding, respectively. Therefore, 0.38 pore volume of polymer was retained inside the3core. Since the actual core pore volume is 58.62 cm, and core sample weight 567.81 g, 15.7 micrograms of polymer per gram of the core was retained.
A closer attention to Fig.2 shows that forPV>1.35 of injected polymer solution (corresponding to capillary tube ∆p>1700Pa) there are pressure fluctuations, with a subsequent increase of the recorded differential pressures across both the core and capillary tube. This phenomenon occurred often in our experiments, especially after injecting more than 1 PV of polymer solution, and it was attributed to observed clogging tendencies of the small diameter flow lines,despite our efforts to prevent and/or rectify them. It should be pointed out that if one attempts to calculate the normalized polymer concentration at∆p= 1 700 Pa from Eq.(1), one will obtain the non-physical value of c/c0=1.09, due to the approximate nature of the equation as it was pointed out earlier.
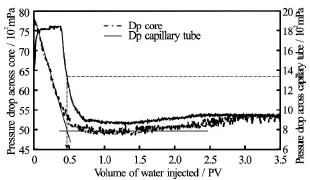
Fig.3 Evaluation of the SSW breakthrough time following the first polymer flooding-Bentheim water-wet sandstone core sample
5.1.2 Berea formation
The differential pressure across the core and capillary tube for the first and the second polymer floodsare presented by Hatzignatiou et al.[13]for an injection rate of 0.2 ml/min. Based on these results, it appears to be very difficult to determine the polymer breakthrough simply based on the measured pressure drop across the core. On the other hand, the pressure drop profile across the capillary tube displays features which can be used to determine the polymer breakthrough time based on the information presented earlier in this work. The polymer breakthrough takes place after the injection of 1.431 and 0.487 pore volumes for the first and second polymer floods, respectively. Therefore, 0.944 pore volumes of polymer was retained inside the core, considering the core pore volume of 63.51 cm3and core sample weight of 565.4 g, 42.41 micrograms of polymer per gram of the core was retained in the water-wet Berea core sample.

Table 6 Apparent viscosity determined from the second polymer flooding-Bentheim water-wet sandstone core sample
5.2 Inaccessible pore volume (IPV)
5.2.1 Bentheim formation
In order to determine the IPV, a SSW flood was conducted on the Bentheim water-wet core after the second polymer flooding at an injection rate of 0.2 ml/min. The SSW breakthrough occurred after the injection of 0.475 SSW pore volumes as shown in Figure 3 and the second polymer flooding breakthrough time was 0.525 pore volumes of injected polymer solution. This implies that the injected SSW flows faster through the pore space compared to the polymer injected during the second polymer flood. This is attributed to the following: (1) the SSW viscosity is lower than the polymer one and the injected SSW fingers into the polymer solution existing in the formation,thus yielding an earlier SSW breakthrough, and (2)polymer already existing in the porous space may block the injected SSW to access parts of the formation.
The following approach was therefore followed to determine IPV. Following the effective displacement of oil from the core sample, the amount of pore volume available for a tracer (water in this case) to flow through the core sample is equal to 1-Sorw=0.6. Since in this study all saturation values are determined using fluid injection which flows through connected porous media, and assuming a thorough oil displacement, the water breakthrough should theoretically occur after 0.6 PV of injected SSW (piston like displacement). Considering that the polymer breaks through after 0.525 PV of injected polymer solution in the second polymer flood, this procedure yields a 0.075(=0.6-0.525)core pore volume (7.5%) that is inaccessible to the injected polymer.
The IPV in the Bentheim water-wet core is low. There could be several reasons for this observation,for example, the core sample has a high permeability so the pore throat size is large causing a decrease of the injected polymer mechanical entrapment inside the core. In addition, 40% of the core sample contains oil that is not accessible to the aqueous phase.
5.2.2 Berea formation
The amount of pore volume available for the water to flow through is 1-Sorw=0.635. Using the piston like displacement assumption, the water breakthrough occurs after 0.635 pore volumes of water injection. Polymer breakthrough in the second polymer flooding experiment conducted in the Berea Waterwet core sample occurred after 0.48 PV of injected polymer. Therefore, the approximate IPV value is 15.5% of the pore volume.
5.3 Permeability reduction
5.3.1 Bentheim formation
The residual resistance factor, RRF, defined asthe ratio of water mobility before and after polymer flooding, can be used to quantify the effect of polymer retention on the permeability of core sample. Note that RRF can also be expressed as the ratio of the permeability of water initially and after polymer injection.
The stabilized waterflood differential pressure across the core was equal to 4 000 Pa and 5 000 Pa(Fig.3) before and after the first polymer flooding, respectively (this yields approximately 1 000 Pa increase in the measured pressure drop after polymer flooding). Based on these two values and using the waterwet core sample properties (Table 6), the water effective permeability was calculated as 220 mD and 157 mD before and after the polymer flooding, respectively. This results to a residual resistance factor of RRF=1.39. The low value of RRF shows that polymer retention has a small effect on water permeability. As explained above, the majority of the pore throats in the Bentheim core are sufficiently large to avoid their blocking by the injected polymer. Therefore, both determined RRF and IPV parameters are relatively low.
5.3.2 Berea formation
The recorded stabilized pressure difference across the core in the two water flooding experiments,before and after the first polymer flooding, display a significant change with the effective water permeability decreasing from 61.7 mD to 7.2 mD, respectively. This yields an RRF factor of 8.56. While only 63.6% of the core’s pore volume was available for the injected polymer solution to flow through, a large amount of the injected polymer was retained inside the core reducing significantly the water effective permeability.
In the Berea formation experiments, 4.5 PV of brine were injected to flush the mobile polymer molecules out of the core. The differential pressures recorded across the core and capillary tube during brine injection following the first polymer flood suggest that brine breakthrough occurred at approximately 0.4 PV of water injection. Subsequently, the polymer concentration in effluent, and differential pressure across the capillary tube, drop sharply. Capillary tube differential pressure suggests that the effluent polymer concentration contains no polymer after 2.2 PV of brine injection.
5.4 Apparent polymer viscosity
5.4.1 Bentheim formation
After the second polymer flood, a multirate polymer injection was conducted aiming to investigate the effects of shear rate (fluid velocity) on the estimated apparent polymer viscosity. The capillary tube was bypassed before increasing the injection rate to 9.6 ml/min. The reason for doing so is because the pressure difference across the capillary tube would exceed the transmitter’s upper limit, if the rate was increased to this level. Oil was produced after the rate was increased to 3.2 ml/min. Oil production, apparent viscosity and other parameters for the second polymer flooding are shown in Table 6 for all ten cycles of polymer solution injection.
Polymer retention and oil production are the two important factors having an effect on the effective phase (oil and water) permeability. Polymer retention may reduce effective permeability by blocking pore throats and oil production may increase the water effective permeability by increasing the water saturation inside the core.
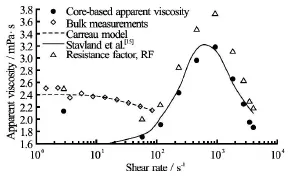
Fig.4 Resistance factor, apparent polymer viscosity, bulk polymer viscosity and Carreau model vs. shear rate-Bentheim water-wet sandstone core sample
The permeability used to calculate the apparent viscosity and shear rate was the SSW effective permeability (157 mD) after polymer flooding in order to reduce the effect of polymer retention on SSW effective permeability. This value was kept constant when calculating the apparent viscosity and shear rate for all injection rates (Fig.4). Measured bulk viscosity data and the fitted Carreau model are also depicted in Fig.4.
Comparing the calculated apparent viscosity values (solid circles), the bulk measurements (diamonds)and Carreau model (curve) in Fig.4, one can see that for low shear rates, the polymer apparent viscosities are lower than the bulk viscosity measurements, and that the apparent viscosity of 2.126 mPa·s (for the lowest shear rate corresponding to the polymer injection rate of 0.01 ml/min) falls most likely in the upper-Newtonian regime. The shear thinning regime of the apparent viscosity data falls between the injection rates of 0.01 ml/min and 0.2 ml/min. In the shear rate range of 100 s-1-1 000 s-1, (i.e., 0.4 ml/min to 3.2 ml/min injection rate), the apparent viscosity increases when increasing the shear rate (shear thinning polymer behavior). For shear rates higher than approximately 900 s-1(injection rates higher than 1.6 ml/min), the apparent viscosity decreases with an increase of shear rate (solid points encompassed by circles) marking the polymer degradation regime. It should be also pointed out that for this high-range ofpolymer injection rates, additional oil is also recovered from the core sample, which causes an increase of the water effective permeability. This is probably due to the increase of the viscous forces which combined with lower size polymer molecules (due to degradation) can mobilize oil that was previously trapped in the pore space. Finally, the increase of the water effective permeability, due to the additional oil recovery,will increase the error introduced in the calculation of the polymer apparent viscosity and shear rate which assumed a constant water effective permeability. Finally, the green solid curve represents the fitting of the calculated polymer apparent viscosities using the Stavland et al.[15]model. Note that the agreement between the analytical model and the calculated polymer apparent viscosities is not very good. This is due to the multiphase flow conditions prevailing in the core in the polymer degradation flow regime, but it also demonstrates that the Stavland et al.[15]model experiences some difficulties in describing all polymer apparent viscosity versus shear rate flow regimes.
5.4.2 Berea formation
After the second polymer flooding, a multirate polymer injection was performed. The injection rates and pressure drop across the core and capillary tube,oil production, apparent viscosity and other parameters related to the multirate polymer flooding are discussed in Hatzignatiou et al.[13]. Oil was produced after stepping up the rate to 0.8 ml/min (third polymer injection cycle) with the mobilized oil continuing to be produced during the fourth injection cycle, thus causing the water effective permeability to increase significantly. Comparing the pressure difference across the core for the rate of 0.2 ml/min at the early part of the flooding, with the same rate after 11 pore volumes of polymer injection, shows drastic pressure drop which was due to oil production in the this period. All apparent viscosities were calculated based on the water effective permeability from water flooding, which was performed after the first polymer flooding. Increasing the water permeability during polymer flooding due to oil production, introduced an error to apparent polymer viscosity calculation.
As with the Bentheim core case, the apparent viscosity values are much lower than the polymer bulk viscosity ones for a given shear (injection) rate. The polymer displays a shear-thinning behavior followed by a shear-thickening one up to a maximum estimate apparent viscosity value of 1.175 mPas which is associated with the polymer injection rate of 1.6 ml/min,subsequently (and for higher injection rates) the polymer starts to degrade. Polymer degradation causes a decrease in the polymer viscosity, a behavior which is noticeable from the recorded pressure drop values recorded across the capillary tube. The polymer effective viscosities did not follow the injection polymer solutions’ apparent viscosity after the injection rate of 1.6 ml/min, this fact is in good agreement with the statement above.
5.5 Resistance factor
5.5.1 Bentheim formation
Resistance factor (RF) is defined as the ratio of the brine mobility in the porous media before polymer contact to the polymer mobility in the same porous medium. Figure 4 shows that the calculated RF values follow very clearly the same trend with the estimated polymer apparent viscosity as a function of injection rate. For polymer injection rates less than 3.2 ml/min,the only factor affecting the resistance factor was the polymer effective viscosity. For polymer injection rates higher than 1.6 ml/min, the combined effects of(1) increased effective polymer permeability due to the oil production and (2) reduced polymer viscosity due to degradation, cause the polymer mobility to increase and RF to decrease.
5.5.2 Berea formation
Both resistance factor and apparent viscosity are presented by Hatzignatiou et al.[13]. The brine mobility before polymer flooding was constant. Therefore, the only factor affecting RF was polymer mobility. Although the value of the calculated apparent viscosity was based on constant permeability, it seems that there is a nice consistency between apparent viscosity and resistance factor. According to resistance factor results, flooding with rate of 1.6 ml/min gives the lowest mobility to the polymer solution.
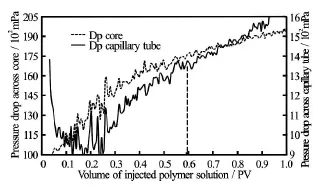
Fig.5 Polymer breakthrough estimation in the second polymer flooding through a Bentheim oil-wet sandstone core sampl-Polymer injection rate 0.2 ml/min
6. Oil-wet bentheim and berea sandstone core samples
6.1 Polymer retention
6.1.1 Bentheim formation
TheinjectionofthepolymerthroughtheBentheim oil-wet core sample was phased by a number of challenges related to the partial clogging of the tubing and the observed production of a greenish fluid which later became a jelly-like colloid fluid. Therefore, the recorded differential pressures across mainly the capillary tube but also across the core displayed significant fluctuations making difficult the estimation of the polymer breakthrough time from the first polymer flood, which was conducted at an injection rate of 0.2 ml/min. However, using both the core differential pressure along the differential pressure across the capillary tube, an approximate polymer breakthrough time was estimated to be 0.94 pore volumes of injected polymer solution.

Table 7 Apparent viscosity from Darcy law in Bentheim core second polymer flooding
Figure 5 displays the core and capillary tube differential pressure drops versus pore volume of injected polymer solution during the second polymer flood. Although this flood also displayed pressure fluctuation, especially at the very early and late stages of the test, from the displayed results the polymer breakthrough for the second polymer flooding occurred at approximately 0.6 pore volumes of injected polymer solution. Based on the two polymer breakthrough times, 0.34 pore volumes of polymer were retained in the core. The actual pore volume of the core is 38.51 cm3and its weight equal to 445.85 g, 11.75 micrograms of polymer per gram of the core was retained. Note that this polymer retention value, even though slightly lower, does not deviate significantly for the one estimated earlier for the water-wet Bentheim core. This is most likely due to the core’s ineffective wettability alteration process as observed from the core’s wettability measurements, and discussed above.
6.1.2 Berea formation
The core and capillary tube pressure differentials for the first and the second polymer floods, conducted at an injection rate of 0.2 ml/min, are presented by Hatzignatiou et al.[13]. According to these results, the injected polymer solution breakthrough time for the first and second polymer floods took place at 0.8 and 0.705 pore volumes of injected polymer, respectively. This yields a 0.095 pore volume of polymer retained in the core, considering the core’s pore volume of 60.61 cm3and its weight of 569.7 g, one easily can determine that 4.04 micrograms of polymer per gram of the core was retained inside the oil-wet Berea sandstone core sample. Comparing this value to the polymer retention of 61.65 micrograms of polymer per gram of core estimated for the water-wet Berea core sample it is easily to conclude that the core wettability plays a major role on the amount of the retained polymer in the formation during a polymer (SP or ASP)flooding process.
6.2 Inaccessible pore volume
6.2.1 Bentheim formation
For the IPV estimation, a SSW flood was performed between the first and the second polymer floods discussed above and run to estimate the amount of polymer retained in the core sample, all flood injection rates were 0.2 ml/min. The pore volume available for the SSW to flow through is 1-Sorw=0.678which means that the SSW breakthrough time is 0.678 PV. The second polymer breakthrough occurred at approximately 0.6 PV of injected polymer solution, which yields an approximate IPV of 7.8% of the core’s pore volume. This value is similar to the one estimated earlier for the water-wet Bentheim core sample, but due to the uncertainties in estimating more precise breakthrough times for the two polymer flood the estimated IPV value should be considered as an indication of the IPV for the Bentheim oil-wet core sample.
6.2.2 Berea formation
The pore volume available for the SSW to flow through the core is1-Sorw=0.777, which is the SSW breakthrough time in pore volumes. The second polymer flood resulted to a breakthrough time of 0.705 PV of injected polymer solution. Therefore, the estimated IPV value is 7.23% of pore volume. Comparing the reductions of the retained polymer and IPV between the water-wet and oil-wet Berea core samples one can observe that despite the relatively large decrease, 91%,of the amount of retained polymer in the oil-wet core compared to the water-wet one, the reduction in the IPV was only 51%. For a given formation/polymer combination, these results are attributed to the differences in the mechanisms contributing to the determined reductions in the polymer retention and IPV. More specifically, polymer adsorption for the observed retained polymer reduction is mainly due to the formation wettability, on the other hand the structure and distribution of the pore throat size mainly and wettability of the formation secondly are the main causes of the estimated IPV reduction in the Berea oil-wet core compared to the water-wet one.
6.3 Permeability reduction
6.3.1 Bentheim formation
Comparing the stabilized pressure differences across the core during the SSW floods conducted prior and after the polymer flooding yielded an approximate difference of 10 000 Pa mbar increase in the recorded differential pressure after polymer flooding. Employing Darcy’s law the water effective permeability prior and after polymer flooding can be easily calculated as 141.87 mD and 57.02 mD, respectively. Therefore, the estimated RRF for the oil-wet Bentheim core is equal to 2.48, which once again should be viewed in light of the experimental difficulties detailed above.
6.3.2 Berea formation
To determine the permeability reduction of water,SSW was injected after the first polymer flooding. From the experimental results, an increasing trend of differential pressure across the capillary tube was noticeable after the SSW breakthrough, accompanied by pressure fluctuations. Following the same procedure as above, the effective permeability of water was decreased from 281.18 mD to 232.08 mD for the SSW injection prior and after the polymer flooding, which result to an RRF value of 1.31.
6.4 Apparent viscosity
6.4.1 Bentheim formation
A series of polymer injections at an increasing injection rate were performed to study the polymer apparent viscosity behavior as a function of the applied shear rate in the porous space. The injection rate of the polymer solution, pressure drop across the core sample, estimated shear rate, oil production, and computed apparent viscosities as a function of the injection rate are shown in Table 7. The effective permeability of SSW (57.02 mD), obtained after polymer flooding, is used when calculating the apparent viscosity and shear rate for all injection rates in order to reduce the effect of polymer retention on the SSW permeability. The computed polymer apparent viscosity results display a continuously decreasing trend (i.e.,shear thinning behavior) which is quite different for the behavior observed for the water-wet core samples. Despite the experimental difficulties in this experiment, this behavior could not be fully justified just by simply considering the observed greenish and jellylike appearance of the effluent and the abnormal pressures recorded across the capillary tube.
6.4.2 Berea formation
Multiple polymer floodings with various injection rates (0.2 ml/min, 0.4 ml/min, 0.8 ml/min and 0.03 ml/min) have been conducted for the oil-wet Berea core sample[13]. The differential pressure across the core does not get stabilized for any injection rate,even when 9 PV of polymer solution have been injected for the first cycle. It was conceived that this increasing pressure could be the effect of oil relocation and accumulation at the end of core. In oil-wet cores,oil saturation at the end of the core will increase during a displacement process. This implies that the connected pore space for the water to flow through the end of the core sample will be reduced. After flooding the core with a higher water injection rate, some of the oil, both in the core and core-end accumulated, may be produced (due to the increased capillary number),and the pressure across the core will decrease gradually. This observation reported by Hatzignatiou et al.[13]for SSW multi-rate flooding, is more pronounced for polymer injection since polymer requires larger pore throats to pass through compared to water. A tendency for increased polymer entrapment toward the end of the core due to the reduced flow space could be the reason of the observed increase of the differential pressure across the core during a given flow rate, which differs from the pressure behavior for SSW flooding.
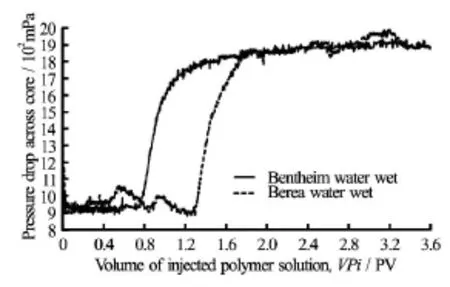
Fig.6 Comparison of pressure drop across the cores and breakthrough times during the first polymer flood for both Bentheim and Berea sandstone water-wet core samples
Attempts have been made to flood the core by injecting water at higher rates (thus increasing viscous forces) to displace any potentially trapped oil out of the core samples. The flooding rates used were 0.2 ml/min, 1 ml/min, 3 ml/min, 5 ml/min, 7 ml/min and again 0.2 ml/min to compare results with the firstflow rate. For the three higher rates (3 ml/min,5 ml/min and 7 ml/min) some oil production was observed which was accompanied by small, but noticeable, fluctuations in the measured pressure difference across the capillary tube. The amount of oil produced was 2.1 ml after 32 PV of injected SSW. Finally, a new polymer flooding was conducted, which again demonstrated an increasing differential pressure across the core indicating that the observed behavior was due to the behavior of the injected polymer. Therefore,any attempt to reach stabilized differential pressure to further investigate this behavior was discontinued.
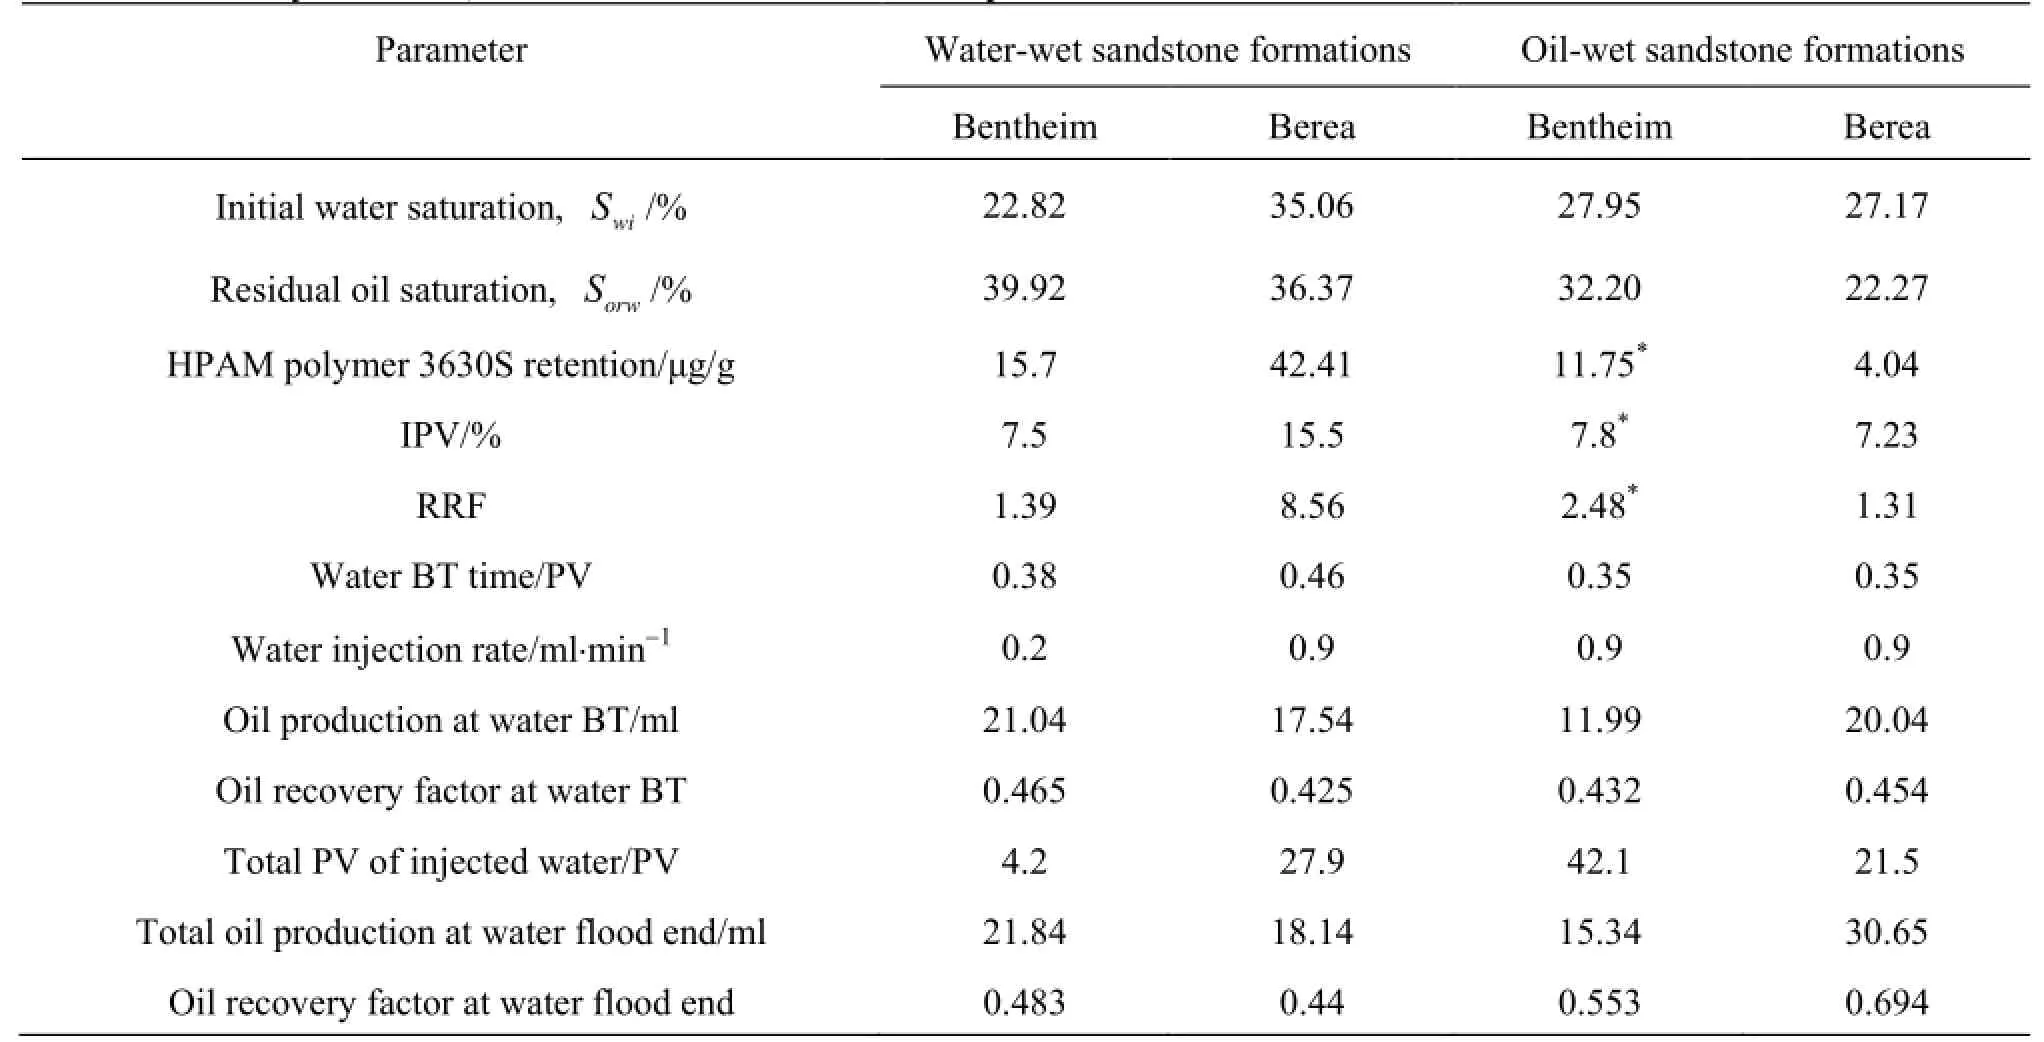
Table 8 Summary of results, water-wet and oil-wet core samples
7. Polymer retention comparison
7.1 Bentheim and berea water-wet core samples
Figure 6 shows a comparison of the polymer breakthrough time observed in the first polymer flooding conducted in the Bentheim and Berea water-wet sandstone cores. This comparison is important since all polymer retention occurred during this phase of the investigation. As Fig.6 suggests, and also examined earlier in this work, the amount of polymer retention in the Berea is much higher than in the Bentheim core sample. Referring to Table 8, the IPV for the Berea core is also higher than the IPV determined for the Bentheim core sample. These results are due to the lower permeability of the Berea formation which leads to (1) higher contact area, and thus increased interaction with the injected polymer solution leading to increased amounts of polymer adsorption, and (2) presence of smaller channel size and pore throats in the Berea leading to increased polymer retention due to mechanical entrapment and also larger IPV.
Several experiments conducted on both waterwet Bentheim and Berea cores samples using 3630S polymer in SSW, and in the absence of oil, have shown that polymer retention varies in the range of 20 to 50 micrograms of polymer per gram of core. In addition, experimental runs conducted in both water-wet Bentheim and Berea cores samples with 3630S polymer in SSW and in the presence of residual reservoir crude oil showed similar retention figures to the ones observed when oil was absent from the core. These results are in agreement with previous results[9]which indicate that the amount of retention in water-wet cores is not significantly influenced by the absence/ presence of oil. Finally, when the salinity of water in the polymer solution was lowered, the amount of polymer adsorption decreased to approximately 10 µg/g rock in the absence of oil and for both oil- and waterwet samples, which again agrees with the findings of Broseta et al.[9]who reported small variations(7.25 µg/g and 9 µg/g for the untreated and silanetreated substrates) of HPAM adsorption.
7.2 Berea water-and oil-wet core samples
The retention value for Berea oil-wet is small and IPV is in acceptable range which suggests that the most of pore volume which associated to IPV have not been inaccessible by polymer entrapment. In the other words, there were already inaccessible due to small pore size of pore throats. The reason that the surface adsorption in the Berea oil-wet is low could be due to the existence of an oil film which covers the insidesurface of the core and reduces the contact area between the surface and polymer solved in the water. Based on results from experiments conducted in both oil-wet Bentheim and Berea cores samples using 3630S polymer in SSW, and in the absence of oil, polymer retention is less than 10 µg/g rock.
The 3630S polymer retention results presented in our work in the presence of residual oil agree with the results presented by Lund et al.[6]. Broseta et al.[9]presented PAM (9×10⁶Dalton) adsorption experiments on quartzitic natural sand (E), crushed sand (C) and oxidized silicium carbide (SiC) and HPAM A(7.6×10⁶Dalton) polymer adsorption on quartzitic natural sand (E) all in the presence of residual oil saturation. The average amount of adsorbed PAM on hydrophilic substrates was shown to be higher, lower, or approximately equal compared to the amount adsorbed on hydrophobic substrates, for substrate (E)34 µg/g versus 10.5 µg/g, for substrate (SiC)24.67 μg/g versus 48.33 µg/g, and substrate (E)43.33 µg/g versus 44 µg/g, respectively. In their only HPAM A polymer experiment, Broseta et al.[9]showed that the amount of adsorbed HPAM is not significantly different in a low salinity brine environment regardless the wettability of the substrate and the presence or absence of residual oil. The authors stated that in water-wet cores droplets of residual oil offer additional adsorbing surface to polymer, and in oilwet cores the oil wetting film yields a small adsorbing surface compared to the no longer accessible rock surface. Since in all experiments Broseta et al.[9]used dodecane oil, which is chemically very similar to the alkane chain grafted on the sand surface, the reported polymer adsorption levels are skewed. Our work shows that presence of residual oil prevents the direct rock-surface/HPAM interaction for an oil-wet formation, thus decreasing the amount of adsorbed polymer compared to water-wet equivalent ones.
Comparing IPV values for both Berea cores,there is more inaccessible pore volume for polymer in the Berea water-wet core which became inaccessible by polymer entrapment. Despite the fact that some amount of polymer retained in porous media was trapped in pore channels (hydrodynamic retention), most of the retained polymer was adsorbed on the rock surface of the water-wet core. The combined effect of polymer adsorption and hydrodynamic retention render part of the rock space inaccessible to the injected polymer molecules, thus yielding increased IPV values. Table 8 provides a summary of important parameters and results achieved for both water- and oil-wet cores samples.
8. Summary and conlcusions
The main conclusions of this work are as follows:
(1) The overwhelming majority of the research work on polymer retention and IPV was conducted on strongly water-wet porous media, this work illustrates the impact of formation wettability on these two parameters and highlights the expected differences between the two types of formation wettability.
(2) A new experimental setup is introduces that eliminates the need to collect and measure effluent viscosity, and thus provides more frequent data. It is,therefore, possible to run effectively high-pressure experiments since there is no need to expose the core outlet to atmospheric conditions in order to collect effluent samples.
(3) An approximate expression, that relates pressure drop measurements across a capillary tube inserted at the outlet of the core sample with the injected polymer concentration, can be used to determine the polymer breakthrough time from core samples in a simple, quick and inexpensive method, thus avoiding the traditional, costly and time-consuming approach of recording the effluent polymer concentrations.
(4) The wettability of all core samples was evaluated using both oil and water produced volume measurements along with the pressure drop profiles recorded across the core. The pressure and oil production profiles of water flooding for the Bentheim core indicated that rather a small volume of oil was produced after polymer breakthrough, and therefore the core can be considered as intermediate wet. The pressure and oil production profiles during water flooding of the Berea core showed oil production after breakthrough which means the wettability-altered Berea core was oil-wet.
(5) The chemical treatment for altering the Bentheim core wettability proved to be unsuccessful most likely due to partial crosslinking of the injected HPAM caused by the ineffectively deactivated trivalent chromium in the wettability alteration chemical,and the recorded polymer flooding results were deemed unreliable.
(6) Comparing the results of polymer flooding from Berea and Bentheim water-wet cores, the retention in the Berea formation was noticeably higher than the Bentheim one. This is because of the lower permeability and higher surface area in contact with polymer in the Berea as well as difference in rock surface composition and clay minerals. The IPV value of the Berea was higher than the Bentheim as well due to lower permeability and smaller pore throats in the Berea core. High polymer retention and high IPV of the core lead to higher reduction of the permeability(RRF) after polymer flooding.
(7) In oil-wet Berea rock the amount of retention is very low, which means wettability had a significant effect on this parameter. Apparently, oil covers the surface area of sand grains thus preventing polymer to have contact with the solid surface. Although the re-tention value was low, still 7.23% of the core was inaccessible to polymer, which is due to low permeability of the core and the large size of polymer molecules.
(8) Comparing the Berea oil-wet and water-wet cores, the polymer retention is much lower in the oilwet core, whereas the insignificant deviation of the observed polymer retention in the oil-wet Bentheim core sample compared to the water-wet one is another strong indication of the ineffective wettability alteration of the core. The IPV value in Berea water-wet is higher than the oil-wet one, which shows that some extra pore volume of the Berea water-wet core has been blocked due to polymer entrapment. Since polymer retention in the oil-wet Berea core is very low,any decrease in permeability is due to polymer entrapment. Increased polymer trapping toward the core end due to reduced flow area caused by the higher oil saturations encountered in oil-wet cores may cause the differential pressure across the core to increase for a given polymer flow rate in a multirate polymer flooding.
(9) IPV and polymer retention affect polymer front velocity. This work shows that polymer retention depends strongly on formation wettability while IPV appears to not be affected significantly. Since most reservoirs tend to be less water wet than the mainly examined water-wet ones, polymer retention at field scale will be lower. This observation, if properly implemented in EOR simulation models for predictive purposes, will yield better designs of polymer, SP or ASP floods and thus contribute to higher EOR potentials.
References
[1] PANCHAROEN M., THIELE M. R. and KOVSCEK A. R. Inaccessible pore volume of associative polymer floods[C]. SPE Improved Oil Recovery Symposium(SPE 129910). Tulsa, Oklahoma, USA, 2010.
[2] MANICHAND R. N., SERIGHT R. S. Field vs. laboratory polymer retention values for a polymer flood in the tambaredjo field[J]. SPE Reservoir Evaluation and Engineering, 2014, 17(3): 314-325.
[3] ZHANG G., SERIGHT R. S. Effect of concentration on HPAM retention in porous media[J]. SPE Journal,2014, 19(3): 373-380.
[4] RODRIGUEZ F., ROUSSEAU D. and BEKRI S. et al. Polymer flooding for extra-heavy oil: New insights on the key polymer transport properties in porous media[C]. SPE International Heavy Oil Conference and Exhibition (SPE 172850). Mangaf, Kuwait, 2014.
[5] PARK H., HAN J. and SUNG W. Effect of polymer concentration on the polymer adsorption-induced permeability reduction in low permeability reservoirs[J]Energy, 2015, 84(1): 666-671.
[6] LUND T., BJØRNESTAD E. Ø. and STAVLAND A. et al. Polymer retention and inaccessible pore volume in north sea reservoir material[J]. Journal of Petroleum Science and Engineering, 1992, 7(1-2): 25-32.
[7] ZAITOUN A., KOHLER N. Two-phase flow through porous media: Effect of an adsorbed polymer layer[C]. SPE Annual Technical Conference and Exhibition(SPE 18085). Houston, Texas, USA, 1988.
[8] BENNETZEN M. V., GILANI S. F. and MOGENSEN K. et al. Successful polymer flooding of low-permeability, oil-wet, carbonate reservoir cores[C]. International Petroleum Exhibition and Conference (SPE-171849-MS). Abu Dhabi, UAE, 2014.
[9] BROSETA D., MEDJAHED F. and LECOURTIER J. et al. Polymer adsorption/retention in porous media: Effects of core wettability on residual oil[J]. SPE Advanced Technology Series, 1995, 3(1): 103-112.
[10] ZHENG C. G., GALL B. L.and GAO H. W. et al. Effects of polymer adsorption and flow behavior on twophase flow in porous media[J]. SPE Reservoir Evaluation and Engineering, 2000, 3(3): 216-223.
[11] MEYBODI H. E., KHARRAT R. and WANG X. Study of microscopic and macroscopic displacement behaviors of polymer solution in water-wet and oil-wet media[J]. Transport in Porous Media, 2011, 89(1): 97-120.
[12] YUN W., KOVSCEK A. R. Microvisual investigation of polymer retention on the homogeneous pore network of a micromodel[J]. Journal of Petroleum Science and Engineering, 2015, 128: 115-127.
[13] HATZIGNATIOU D. G., MORADI H. and STAVLAND A. Experimental investigation of polymer flow through water and oil-wet berea sandstone core samples[C]. SPE EUROPEC and EAGE Annual Conference and Exhibition (SPE 164844). London, UK,2013.
[14] SPARLIN D. An evaluation of polyacrylamides for reducing water production[J]. Journal of Petroleum Technology, 1976, 28(8): 906-914.
[15] STAVLAND A., JONSBRÅTEN H. C. and LOHNE A. et al. Polymer flooding-flow properties in porous media versus rheological parameters[C]. EUROPEC/EAGE Annual Conference and Exhibition (SPE 131103). Barcelona, Spain, 2010.
10.1016/S1001-6058(15)60537-6
(August 24, 2014, Revised July 6, 2015)
* Biography: HATZIGNATIOU Dimitrios G., Male,Ph. D., Professor

- 水动力学研究与进展 B辑的其它文章
- Classification of flow regimes in gas-liquid horizontal Couette-Taylor flow using dimensionless criteria*
- Effect of structure parameters of the flow guide vane on cold flow characteristics in trapped vortex combustor*
- MHD flow of a visco-elastic fluid through a porous medium between infinite parallel plates with time dependent suction*
- Hydrodynamics and modeling of a ventilated supercavitating body in transition phase*
- Numerical analysis of the unsteady behavior of cloud cavitation around a hydrofoil based on an improved filter-based model*
- Thermal instability and heat transfer of viscoelastic fluids in bounded porous media with constant heat flux boundary*