
Remote Visualization of High-Speed Rail Power QualityMonitoring
2015-12-20 09:14SUNQingLUOGuilin罗桂林CAOQinghua曹庆华
关键词:桂林
SUN Qing(孙 青),LUO Guilin(罗桂林),CAO Qinghua(曹庆华)
1 School of Computer Science and Engineering,Beihang University,Beijing 100191,China
2 School of Economics and Management,Beihang University,Beijing 100191,China
Introduction
With the fast development of electricity market,power quality monitoring is becoming an open challenge for most power enterprises.It is related to the safety and runtime efficiency of power system which promotes the standardization process of the electricity market.Power quality is used to describe the interaction and mutual influence of power system and the status of power servo system.It mainly includes voltage quality,currents quality,electricity supply quality,and continuity of service[1].
Power quality monitoring system is vital for modern power electricity business.The rapid development of hardware and software in computer enables the real-time monitoring of power quality.An excellent power quality monitoring system should be able to analyze,process,store,and display power quality data collected from the remote monitoring,control devices and provide a variety of data services for further use.Two parts constitute the basic architecture of the modern power quality monitoring system:the server responsible for computing and the client responsible for displaying.The widely used visualization technology in power quality monitoring system helps to monitor and analyze power quality remotely,which can further be used to optimize other tasks including job scheduling,electricity dispatching,signal and power management,fault analysis and detection[2-3].To make the power quality monitoring system more intelligent,the remote visualization can even support advanced evaluation approaches based on data mining and machine learning[4].
1 Remote Visualization Requirements of High-Speed Rail Power Quality Monitoring
Currently,most domestic power enterprises have already deployed plenty of monitoring equipments along the high-speed rail routines.These equipments,professionally called monitoring station data acquisition devices,collect basic electrical parameters,including variation in voltage magnitude,continuity of service,transient voltages and currents,and harmonic content in the waveforms for alternating current(AC)power.Each monitoring system typically has a number of monitoring terminals(monitoring stations in entity)and each power monitoring terminal collects a large amount of data,which is prone to cause traffic jam to the power data communication networks,and finally increase the pressure of data transmitting over communication network and reduce the real-time performance of power quality monitoring.To solve the problem,Microsoft's OPC (OLE for process control)standard method is generally used to simplify power quality data set[5]for the purpose of monitoring,collecting,and visualization.Each monitoring device along the high-speed rail uploads the collected data to a central server(i.e.,server power monitoring system)according to OPC standard.The remote visualization client is used for requesting standardized power quality data from the OPC server in real time.
The recorded alarming data,another important kind of power quality information,should be also processed by the remote visualization client.Whenever the power indicators overshoot the predefined threshold value,the alarm will be triggered and feedback will be sent to the remote user.The remote visualization client can analyze information sent by the OPC event server and provide a visual way to rapidly position the abnormal sites.The requirements for the remote visualization client also include text processing and statistical analysis of real-time alarm data,which helps to locate the real-time alarm monitoring stations on geographic information system(GIS)map.
For the purpose of safety and reliability,the minimum upload interval of power quality data is required to be less than 3s[6-7].The remote visualization client for high-speed rail power monitoring system should meet the real-time performance requirements,requesting and getting data from the monitoring devices within per 3s.
2 Solutions to Remote Visualization of High-Speed Rail Power Quality Monitoring
Information visualization is a well-studied technology.Many visualization tools can be applied to handling different issues.In this study,we suggest the ways of GIS maps,histograms,trend graphs,monitoring data dashboards,realtime train operation simulation,real-time data reports,and other visual ways to display data collected from monitoring stations along the high-speed rail and detect emergency.The specific power quality monitoring data requirements and functional requirements,analyzed as follows,are the motivations for such kinds of decision.
2.1 Design of function structure for high-speed rail power quality monitoring remote visualization solution
In this paper,we study and design a functional architecture for high-speed rail power quality monitoring remote visualization as illustrated in Fig.1.
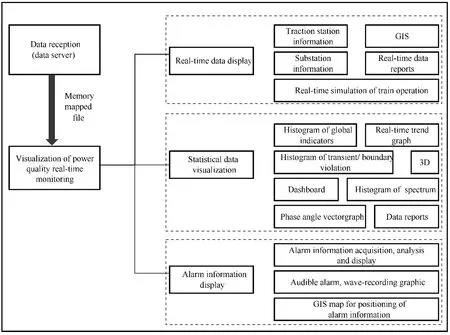
Fig.1 Solution of remote visualization of high-speed rail power quality monitoring-function structure
(1)Real-time data display
Real-time data displaying module shows details of realtime power quality data,including GIS map view,the substation information,the traction station information,the real-time simulation of train operation between stations,the real-time data reports,and other sub-modules.GIS map provides real-time display of indicators values such as monitoring stations information set by the user.Substation information window is used to display real-time power quality data connection diagram and power quality indicators set by the user.Traction station information window is used to display real-time traction power quality data connection diagrams and power quality indicators set by the user.The window of the train operation real-time simulation between stations is used to display real-time status between different stations and real-time operating conditions of the power supply.Real-time data reports are presented in tabular form for directly displaying the conditions of monitoring sites and the corresponding power quality.
(2)Statistical data visualization
This module partly or globally displays statistic information of real-time and historical power quality data collected from different monitoring stations in the form of various charts.Depending on the visual objects,we suggest statistical charts and dashboards.Statistical charts include histogram,line diagrams,and charts of various types for displaying real-time power quality indicators.Dashboard display module is used to display the global power quality indicators in the form of dashboard.
(3)Alarm information display
This module is designed for real-time display of various types of alarm information of systems or devices,including alarm information broadcasted by the OPC alarm server.Both real-time and historical alarm information are necessa-rily displayed to support searching,analysis,and other kinds of data mining operations.
2.2 Technologies related to high-speed rail power quality monitoring remote visualization
(1)GIS
GIS is a multidiscipline of cartography,geography,remote sensing,spatial databases and computer science,which can be used to store,query,analyze,and display geographic data.GIS has been widely applied in different areas including public transportation,military,smart city,travel,and business.
The motivation of using GIS is the high performance requirements of power failure analysis and real-time detection.The high-speed rail power quality monitoring remote visualization client should use GIS vector map for map data importing and exporting,map zooming,Beijing-Shanghai highspeed railway line displaying,real-time power quality informing,monitoring stations conditions marking,alarm monitoring stations detecting and other related tasks[8].
(2)Windows presentation form(WPF)
WPF is a basic graphical display interface for windows based on.NET platform.With the development of modern display technologies such as HTML,Flash and DirectX technology and hardware rendering,WPF replaces the traditional standard Windows applications that rely on the Windows operating system and the User32and GDI/GDI+graphics rendering technology.A graphics engine system provides hardware acceleration on the demand of sophisticated texture mapping,transparent and 3D rendering with DirectX instead.During the graphics rendering,plenty of work is transferred to the graphic processing unit(GPU)processor as much as possible[9].All these advantages can make the remote power monitoring visualization client be crossplatform and high-quality.Compared with the traditional Win-dows technologies,WPF obtains great rendering performance by integrating previous graphics technologies and many advanced visualization features,including transparency effects,transition effects and other basic functions as well as vector animation,audio playback and 3Dgraphics and other sophisticated functions.
In this paper,WPF toolkit is used to display high-speed rail power quality data and simulate real-time train operation,and the tools of histograms,trend charts,data reports,dashboards and 3Dvisualization are developed under the mentioned motivation[9].
3 A Case Study in the Remote Visualization of High-speed Rail Power Quality Monitoring
Based on aforementioned discussion and design,we developed and implemented a Beijing-Shanghai high-speed rail remote visualization client.Through system testing and acceptance testing,the visualization solution we proposed is preferable to complete the visualization needs of remote power quality monitoring system.Compared with conventional power quality monitoring system,the remote visualization client we have developed enhances power quality management scalability and interoperability,and can provide better decision support for users in practice.
We visualize the data from the output of the designed data receiving procedure.The module captures power quality data from OPC console via the OPC standard.The OPC console provides a steady-state and transient power quality data from the 54monitoring substations along Beijing-Shanghai high-speed railway line.Data receiving service executives once per 3sto receive power quality data,and the received data are cached in the system memory mapping files.Then the data display procedure obtains these data through the memory-mapping files to achieve data sharing.
3.1 Display of multi-dimensional real-time power quality data
We use GMap.NET and WPF toolkit for power quality data visualization.The real-time data display module is the core function module of power quality monitoring remote visualization client.For this case,we display various types of data collected from the OPC server deployed along Beijing-Shanghai high-speed railway line in various forms of realtime charts.The main display methods include GIS map viewer,the information window for substation,traction station information window,the window of operation train realtime simulation between stations and data chart windows.
1)GIS map
The reason for choosing the GMap.Net is that the components are powerful,free,cross-platform,and opensource.GMap.Net can preferably support vector map zoom,latitude and longitude,map data importing and exporting,distance calculating and connections drawing between two places,path finding,geocoding and map display and offline map caching[10].The remote visualization client we have developed is based on GMap.NET source code research[12-16],and has already achieved the following visual functions as shown in Fig.2:
(1)map navigation;
(2)full-screen navigation;
(3)Beijing-Shanghai high-speed rail route display(The route can be displayed in dash line according to the latitude and longitude information.);
(4)pop-up tips display for station geographic information;
(5)GIS map zooming in and out(The user can visually measure the actual distance between two points on the map.).
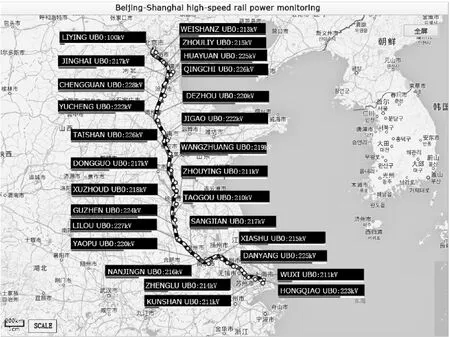
Fig.2 Real-time display of power quality data-GIS map
2)Real-time simulation of train operation
We achieved real-time simulation of train operation based on GIS maps.Using animation for train operation diagram,we draw traction substations proportionally in a simulated diagram according to the latitude,longitude,and distance information.In addition,users can query the information of train trips and train schedule by clicking on the train operation diagram.Our GIS map is able to accurately display the real-time train operation for Beijing-Shanghai high-speed rails(see Fig.3),including:
(1)the animation shows the current operation status be-tween two train stations;
(2)basic information display between the two stations,and stations power supply arm;
(3)providing navigation data to all current traction substations between two terminals,where the users can view a detailed connection diagram of monitoring sites and realtime power quality indicators;
(4)real-time display of power data quality indicators of traction power station,allowing the users to choose the power quality indicators.
The most difficult problem we encountered is how to calculate the train's starting,running,and terminal position in real time.We use WPF animation technical solutions[11]to solve the problem.WPF animation needs to determine target's operation trajectory as well as the desired start and end time.First,we need to determine the operating direction of the train,to be specific,upstream or downstream.According to this information,we can get the starting position,the terminal position,and the arrival time of the train based on the current system time and the departure time of the train.
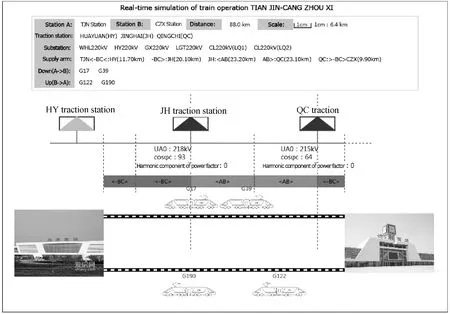
Fig.3 Real-time simulation of train operation
3)Histogram
Indicators histogram is a visual presentation of the data in the form of bar charts.When the user determines a list of monitoring stations and monitoring indicators,the histogram will get the memory file,which contains the latest power quality data at regular time and updates the display.This paper designs and uses the real-time power quality indicators histogram,including global indicators histogram and monitoring station's spectrum histogram.Basically,these two kinds of histograms are implemented in the same way in Fig.4.The key point to realize the real-time visualization indicators histogram is data acquisition,management,and histogram display.Data management module will store the power quality data,which is named after the power quality monitoring stations in data dictionary where both name and data are keywords.The corresponding data display module will bind the refreshed data to the histogram view.To meet the requirement of real-time visualization,the application launched a 3stimer for user interface refreshing,updating newly acquired data to the dictionary,and then rebinding the data.
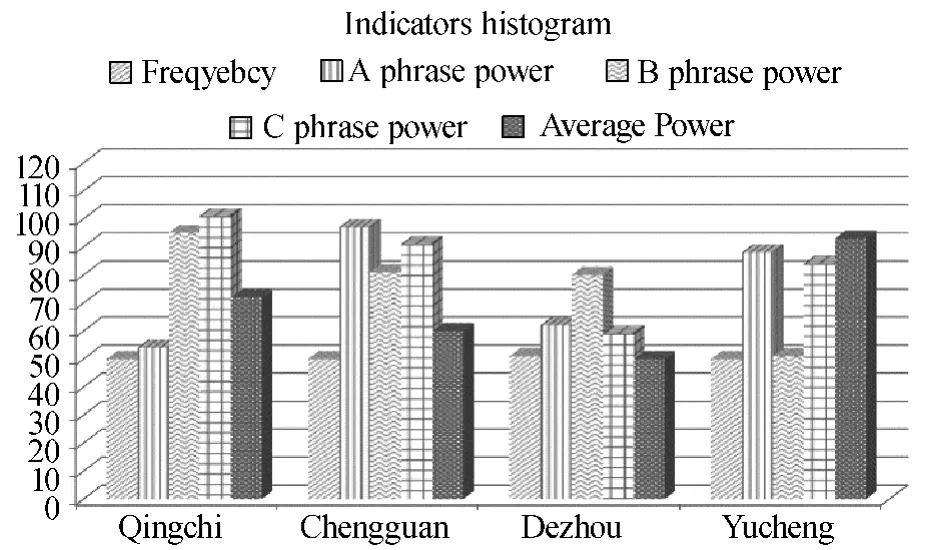
Fig.4 Real-time data of monitoring station visualization-histogram
4)Real-time trend chart
Real-time tendency chart is a visual presentation of the power quality data in the forms of curve mapping,scatter diagrams or square wave graphs.Figure 5is the real-time trend graph which provides a configuration window,where the user can choose multiple monitoring stations.As it is meaningless to compare different energy indicators,the designed remote visualization client provides the user with only one monitor power indicator choice at one time.
5)Indicators dashboard
Indicators dashboard(Fig.6)is used to visualize power quality data in the form of dashboard displaying.Users are allowed to select a monitoring station and a power indicator on the dashboard configuration panel.Dashboard marks alarm limit monitoring stations and monitoring power indicator data with different colors range.Indicators dashboard gets the historic configuration or the user selected monitoring stations and indicators to create visual graphics.Likewise,in order to meet the real-time functional requirements,dashboard window applies a 3stimer to calling the event handler at regular time.In the timer event handler,the dashboard finished reading the different areas of power quality monitoring indicators and dividing the dashboard into different zones(low alarm limit zone,high alarm limit zone,and normal zone).
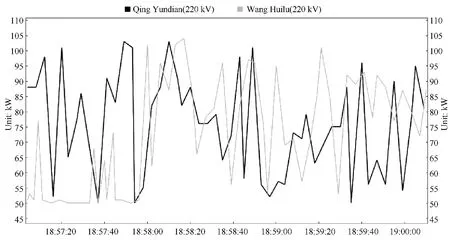
Fig.5 Real-time data of monitoring station visualization-total power trend graph
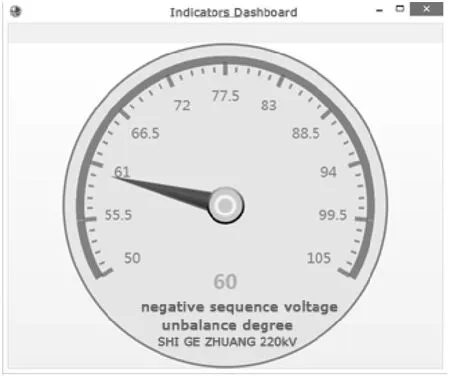
Fig.6 Real-time power quality indicators(spectrum)dashboard
3.2 Alarms,analysis,and display of ultra-threshold power quality data
The remote visualization client in this case is also able to ob-tain and analyze information from the alarm OPC server and then accurately display the information.The high and low alarm thresholds of monitoring stations and power quality indicators set by the user are written into the data acquisition devices via OPC standard method.When abnormal power quality data occur,the information is uploaded to the central alarm data server in the monitoring station,and the remote visualization client accesses to the alarm data center and reads related information on the server.The original information of alarm mainly contains alarm time,alarm monitoring stations,alarm power indicator,alarm type,and other alarm contents.For instance,apiece of common alarm information is usually a long sentence consisted of several short strings separated by the token“;”,from which we can get the alarm monitoring station ID,alarm power indicator identification,and other information by lexical analysis.Then we query the database with the monitoring stations ID and power indicators,combine the corresponding results into the final alarm information,and display it in time.
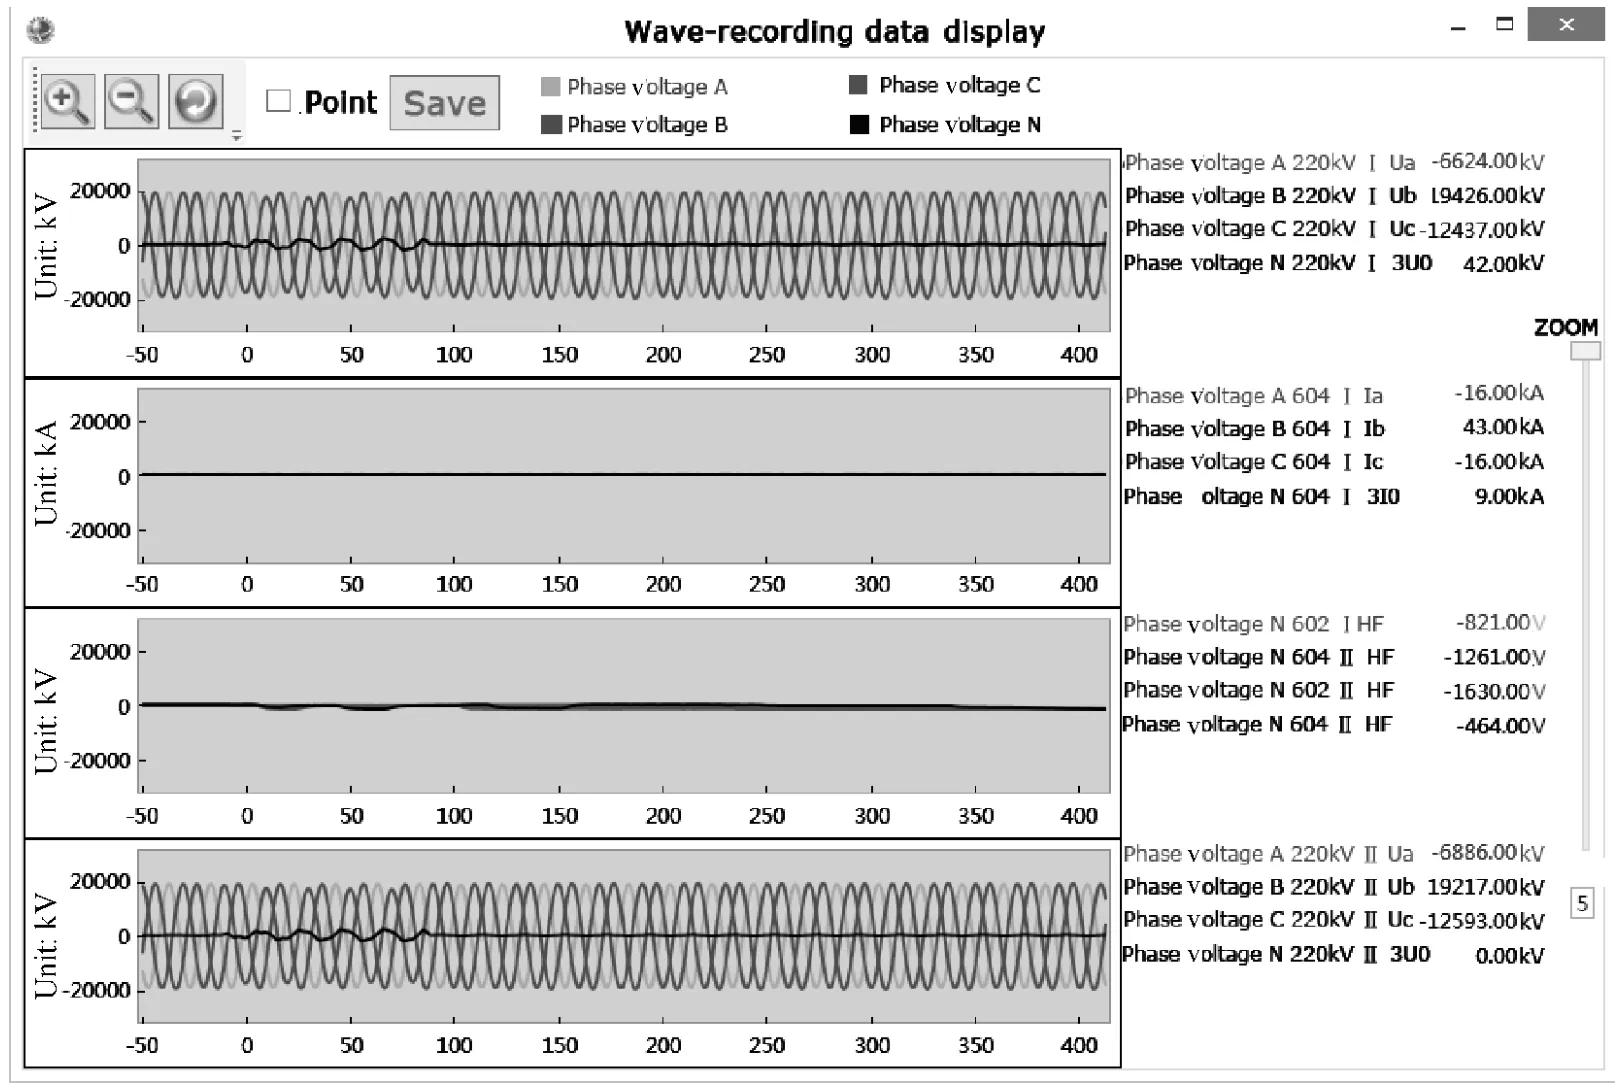
Fig.7 FTP wave-recording files incurred by real-time alarm
The remote visualization client we have designed provides an audible alarm when it receives a piece of alarm information,and then opens the wave-recording analysis module after automatically downloading the wave-recording files via FTP client according to the specified monitoring stations,indicators,and time set by the user.From Fig.7,we see that the application uses events warning to inform the wave-recording analysis module to give graphical display of the wave recording files.
The remote visualization client calls GIS maps after receiving real-time and historical alarm data,informing the remote user of the accurate alarming location and other detailed information by flashing GIS map data labels.An FTP file request and the subscription of download completion events will be created by users'double clicks on the alarm information at the alarm window.Then the event handler will be called to deal with wave-recording data through viewing graphics of wave-recording files.
4 Conclusions
The solutions are proposed for remote visualization of high-speed rail power quality monitoring system.A study case of design and implementation for remote visualization client of power quality monitoring for the Beijing-Shanghai high-speed rail is also given.The main contributions include:
1)design and implementation of offline vector maps and real-time simulation of train operation,which supports real-time GIS map showing power quality data and real-time location of alarm monitoring stations;
2)the visualization solutions provide power quality data in a variety of visual display forms,and users can view realtime quality data through histograms,trend charts,dashboards,data reports and 3D maps;
3)be able to receive uploading data of alarm monitoring stations and locate the alarming points,download,and analyze wave-recording file of alarming sites.
However,there are also some shortcomings for the tools introduced in this paper.It still needs to be improved.The further research might focus on how to improve data efficiency of the real-time visual display of power quality.Our future work will cover two improvements:one is to improve the overall data flow management process from the data center to the live display,the other is to use MVC data binding technology to improve the efficiency of data display.
[1]Xiao X N.Power Quality Analysis and Control[M].Beijing:China Electric Power Press,2004.(in Chinese)
[2]Cui Y B,Lin T.Online Power Quality Monitoring System Based on Virtual Instrument:Summary of Power Quality Monitoring System [C].The 22nd Annual Conference Proceedings of Professional Committee of the Power System in Seven Provinces South,Wuhan,2007.(in Chinese)
[3]Chen X Y.Research of Power Quality Monitoring Network Based on Virtual Instrument Technology [D].Hangzhou:Zhejiang University,2006.(in Chinese)
[4]Yang J,Xiao X N.New Trends of Power Quality Monitoring Developments—Networking,Information Technology,Standardization[J].Electric Power Automation Equipment,2004,24(11):82-86.
[5]OPC Server at MatrikonOPC.com [EB/OL].http://matrikonopc.com/opc-server/.GB/T19862-2005.General Requirements of power quality monitoring equipment.2005.
[6]Luo J B,Xu J,Zuo P,et al.Power Quality Monitoring System Design Scheme of Electrified Railway[J].Jiangsu Electrical Engineering,2010,29(4):22-31.(in Chinese)
[7]GMap.NET-Great Maps for Windows Forms &Presentation–Documentation[EB/OL].http://greatmaps.codeplex.com/discussions/topics/4899/help.
[8]WPF Toolkit Document[EB/OL].http://wpf.codeplex.com/releases/view/40535.
[9]GMap.NET-Great Maps for Windows Forms &Presentation–Documentation[EB/OL].http://greatmaps.codeplex.com/discussions/topics/4899/help.
[10]Li X.Canon-WPF Handbook[M].Beijing:Electronic Industry Press,2010.(in Chinese)
[11]OPC Server at MatrikonOPC.com [EB/OL].http://matrikonopc.com/opc-server/com .
[12]Component Object Model[EB/OL].http://en.wikipedia.org/wiki/Component_Object_Model.
[13]WPF Apps with the Model-View-View Model Design Pattern[EB/OL].http://msdn.microsoft.com/en-us/magazine/dd419663.aspx.
[14]Simplifying the WPF Tree View by Using the View Model Pattern [EB/OL].http://www.codeproject.com/Articles/26288/Simplifying-the-WPF-TreeView-by-Using-the-View-Mode.
[15]Google Maps API Web Services,Encoded Polyline Algorithm Format [EB/OL].https://developers.google.com/maps/documentation/utilities/polylinealgorithm.
[16]Map View Draw Directions Using Google Directions API-Decoding Polylines[EB/OL].http://stackoverflow.com/questions/6708408/map-view-draw-directions-using-google-directions-api-decoding-polylines.
猜你喜欢
中国储运(2022年6期)2022-06-18
大众文艺(2021年12期)2021-07-19
大众文艺(2021年12期)2021-07-19
歌海(2021年1期)2021-04-02
宝藏(2021年1期)2021-03-10
学苑创造·A版(2018年12期)2018-03-04
文史春秋(2017年10期)2017-11-29
下一代英才(酷炫少年)(2017年9期)2017-11-27
小主人报(2015年1期)2015-03-11
科学中国人(2015年25期)2015-02-28
 Journal of Donghua University(English Edition)2015年2期
- Journal of Donghua University(English Edition)的其它文章
- Analysis of Co3O4/ Mildly Oxidized Graphite Oxide (mGO )Nanocomposites of Mild Oxidation Degree for the Removal of Acid Orange 7
- Ontology-Based Semantic Multi-agent Framework for Micro-grids with Cyber Physical Concept
- A Motivation Framework to Promote Knowledge Translation in Healthcare
- Aircraft TrajectoryPrediction Based on Modified Interacting Multiple Model Algorithm
- Two Types of Adaptive Generalized Synchronization of Chaotic Systems
- A Dependent-Chance ProgrammingModel for Proactive Scheduling