
Change of Arctic sea-ice volume and its relationship with sea-ice extent in CMIP5 simulations
2016-11-23 01:12SONGMiRong
SONG Mi-Rong
State Key Laboratory of Numerical Modeling for Atmospheric Sciences and Geophysical Fluid Dynamics, Institute of Atmospheric Physics,Chinese Academy of Sciences, Beijing, China
Change of Arctic sea-ice volume and its relationship with sea-ice extent in CMIP5 simulations
SONG Mi-Rong
State Key Laboratory of Numerical Modeling for Atmospheric Sciences and Geophysical Fluid Dynamics, Institute of Atmospheric Physics,Chinese Academy of Sciences, Beijing, China
The future change of September Arctic sea-ice volume, simulated by 30 state-of-the-art climate models from the Coupled Model Intercomparison Project Phase 5 (CMIP5), is examined, which depends on both ice extent and ice thickness. In comparison with the September sea-ice extent,the September sea-ice volume has larger spread in the historical simulation but faster convergence in the projection simulation, especially in the context of increasing greenhouse gas emissions. This indicates that the ice volume might be more sensitive to external forcings than the ice extent. Using the averaged projection of those climate models from the 30 CMIP5 models that can better reflect the ‘observed' sea-ice volume climatology and variability, it is shown that the September sea ice volume will decrease to ~3000 km3in the early 2060s, and then level off under a medium-mitigation scenario. However, it will drop to ~3000 km3in the early 2040s and reach a near-zero ice volume in the mid-2070s under a high-emission scenario. With respect to the historical condition, the reduction of the ice volume, associated with increasing greenhouse gas emissions, is more rapid than that of the ice extent during the twenty-first century.
ARTICLE HISTORY
Accepted 11 August 2015
Sea-ice volume; sea-ice extent; sea-ice thickness;CMIP5
由于对未来北极海冰体积的变化研究相对较少,本文利用多模式比较计划模拟的海冰结果,对北极9月海冰体积及其与海冰覆盖范围的关系进行了分析。结果发现,相对于海冰覆盖范围,多模式模拟得到的北极海冰体积的差异跨度更大,但这种差异跨度随着时间的演变迅速减小,表明海冰体积可能是比海冰覆盖范围更为敏感的因子。同时少数几个能够更加合理反映观测的海冰特征与变化的模式的模拟结果显示,在高排放情景下,北极海冰在本世纪70年代时,基本达到了无冰的状态。
Introduction
The Arctic sea-ice volume (area multiplied by thickness)is an important indicator of climate change. In general,sea-ice volume is less susceptible to particular weather events (i.e. storms) than sea-ice extent (Schweiger et al. 2011; Zygmuntowska et al. 2014). Moreover, sea-ice volume might be more closely tied to climate forcings than sea-ice extent, i.e. sea-ice extent may still have considerable variability even when the Arctic Ocean reaches near ice-free conditions, whereas sea-ice volume variability is small. Associated with the rapid decline of summer Arctic sea-ice extent in the past three decades (Serreze,Holland, and Stroeve 2007; Comiso et al. 2008), the combined records from submarine measurements and the Ice, Cloud, and land Elevation Satellite (ICESat) show that mean summer Arctic sea-ice thickness has decreased by about 1.65 m (from 2.80 m in 1980 to 1.15 m in 2007)(Rothrock, Yu, and Maykut 1999; Kwok and Rothrock 2009;Kwok and Untersteiner 2011). Moreover, the abrupt seaice reductions since 2007 have further contributed to the overall dramatic decrease in the ice thickness. This is reflected by the pronounced decrease of the perennial(multi-year) sea ice and the increasing coverage of seasonal (first-year) sea ice in the Arctic Ocean (Maslanik et al. 2007, 2011; Giles et al. 2008). Decline in sea-ice extent and thickness leads to a reduction of sea-ice volume. Arctic sea-ice volume estimated from the Pan Arctic Ice Modeling and Assimilation System (PIOMAS, Schweiger et al. 2011) shows that the September ice volume has decreased by ~75% from 1979 to 2011 (thick black line in Figure 1), which outpaces the decrease of September ice extent (~36% from 1979 to 2011). This indicates that seaice volume may be a more sensitive indicator of climate change than sea-ice extent.
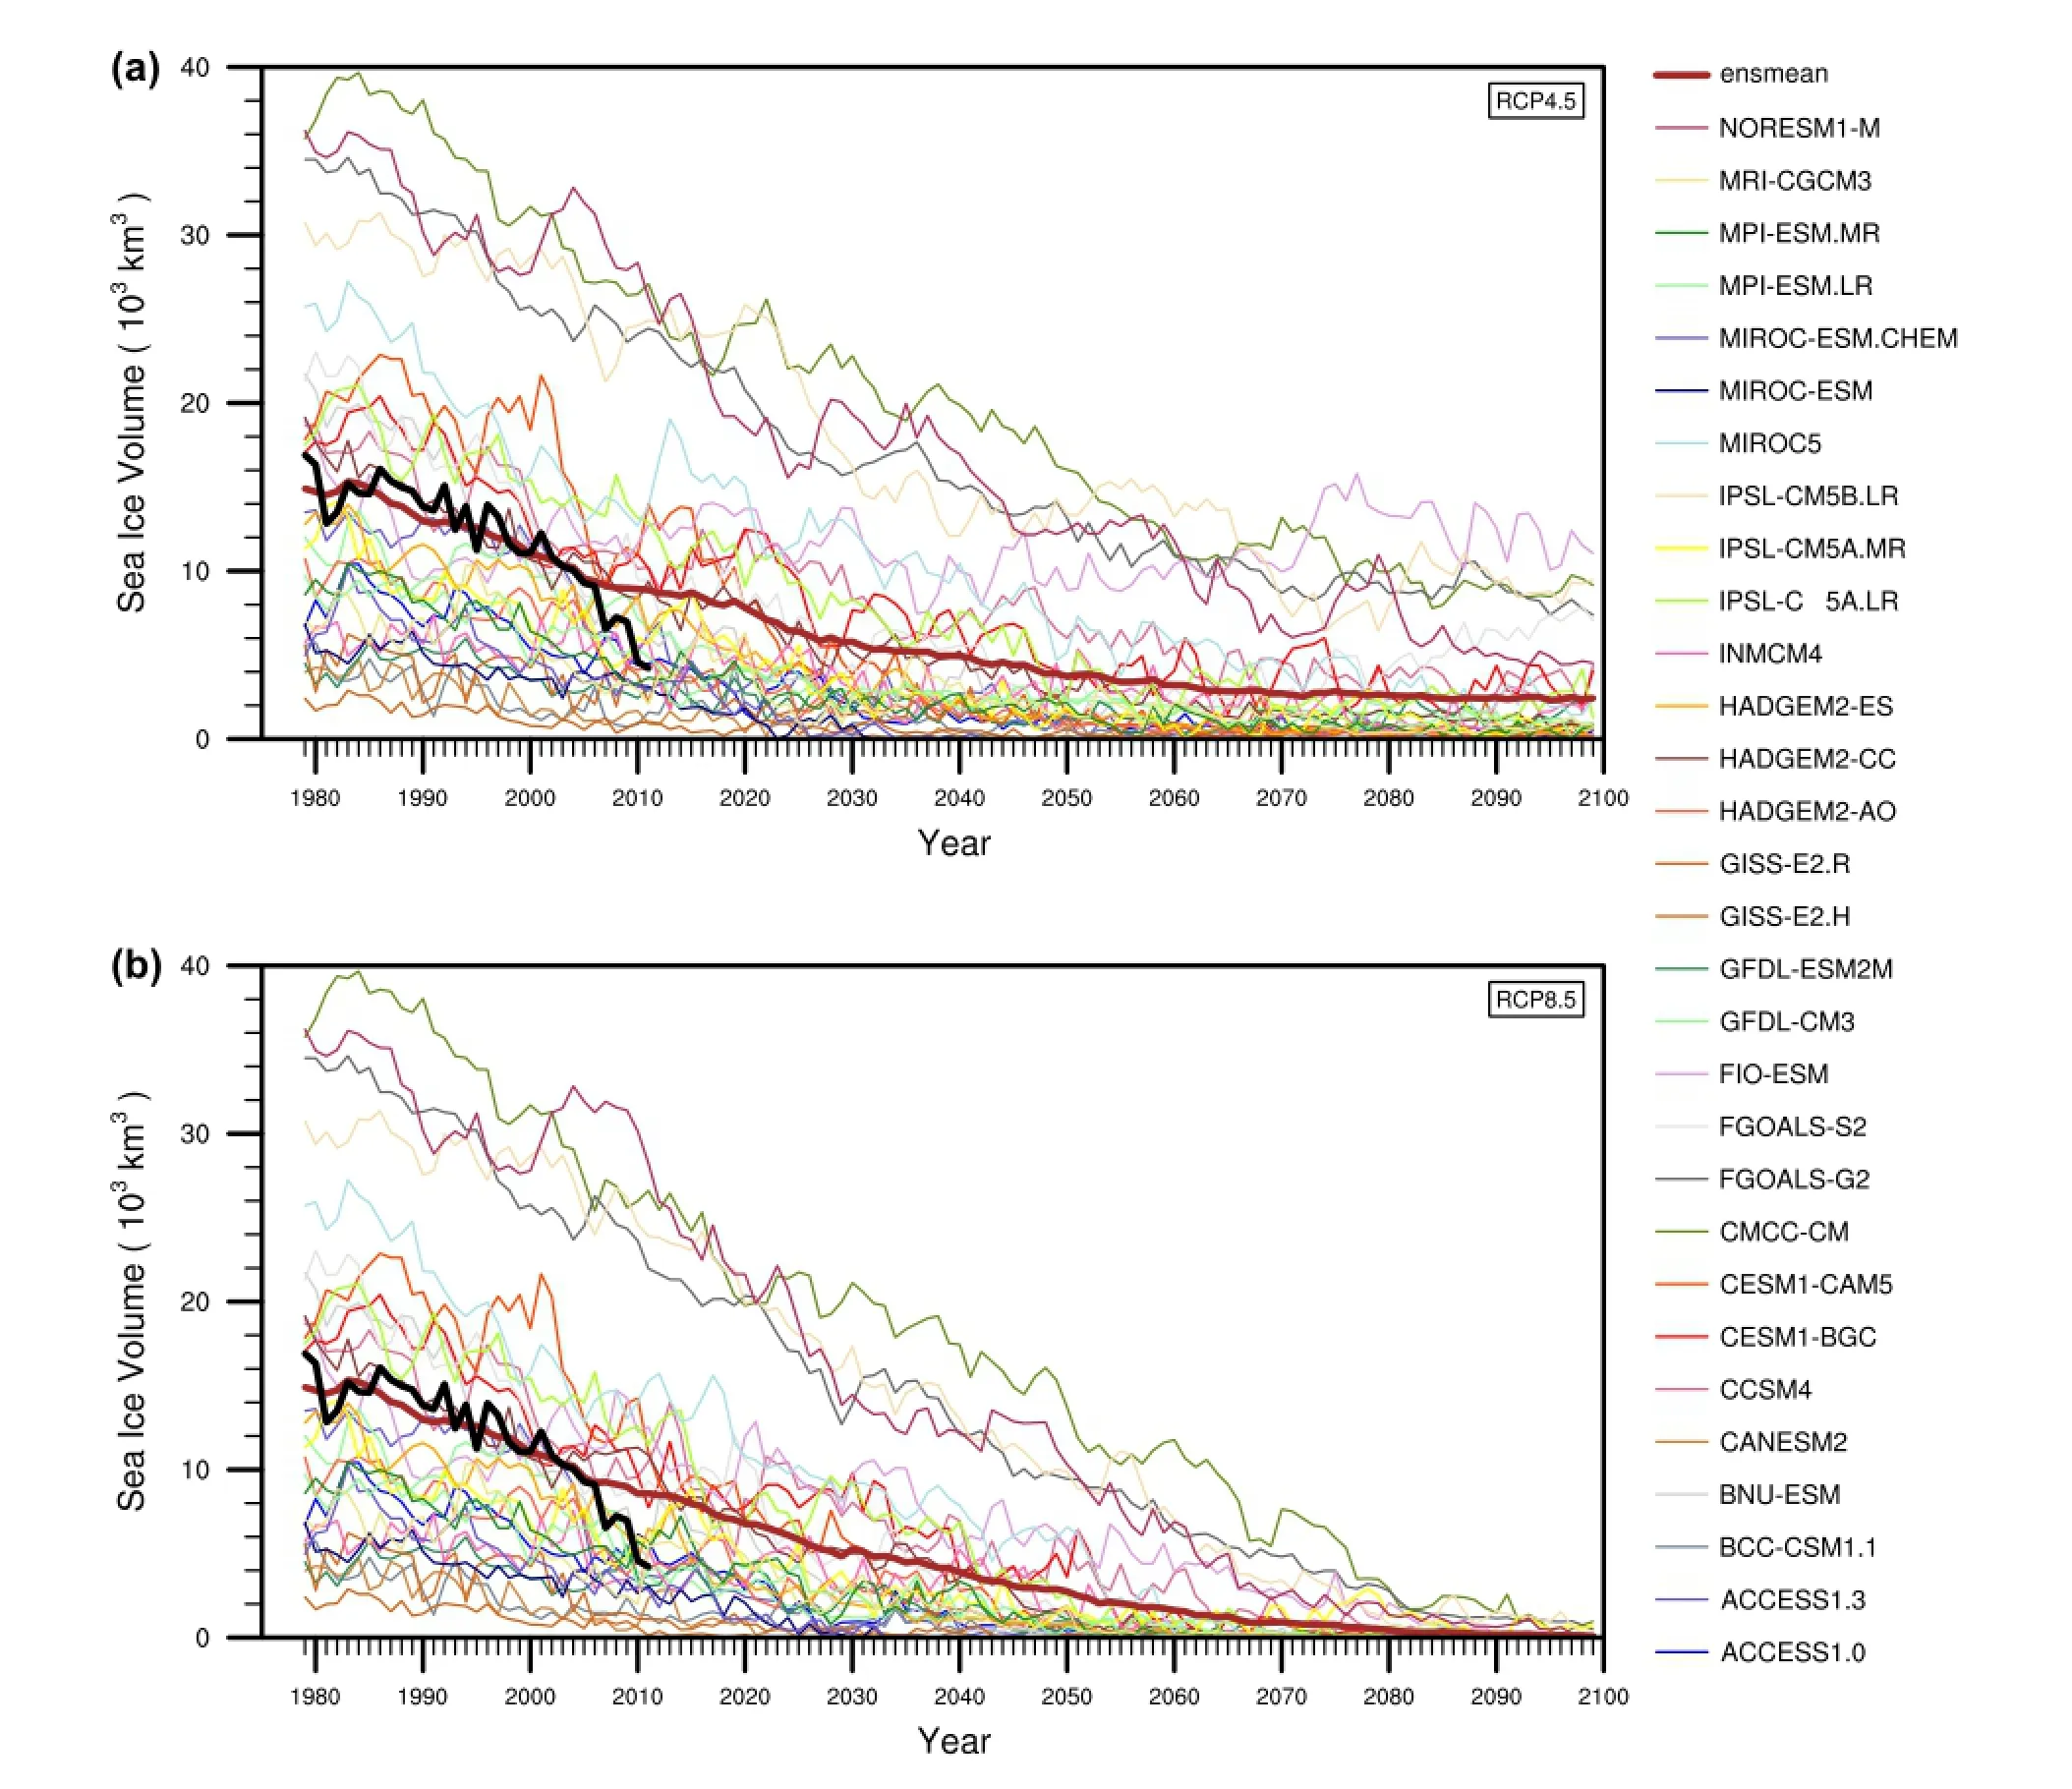
Figure 1.Time series of the observed (thick black line) and simulated (colored lines) September sea-ice volume of 30 CMIP5 models from 1979 to 2005 in the historical simulation and from 2006 to 2099 under the (a) RCP4.5 and (b) RCP8.5 scenarios (the thick brown line is the multi-model ensemble mean).
Several studies have been conducted recently describing the future change of Arctic sea-ice extent during the twenty-first century using the recent available simulations from Coupled Model Intercomparison Project Phase 5(CMIP5) (e.g. Massonnet et al. 2012; Stroeve et al. 2012;Wang and Overland 2012; Liu et al. 2013). A few studies have looked into Arctic sea-ice thickness; for instance,Langehaug et al. (2013) evaluated the Fram Strait ice area export and its influence on Arctic sea-ice area and thickness using historical simulations of six CMIP5 models. However,relatively little attention has been paid to the simulated ice volume in CMIP5. The present study focuses mainly on the future change of Arctic sea-ice volume and its relationship with Arctic sea-ice extent, providing insights to further our understanding of sea-ice simulations and projections in CMIP5.
Data

Figure 2.Evolution of 30 CMIP5 models' spread for the September Arctic sea-ice volume and extent during 1979-2005.
This study focuses on September sea ice (all the grid cells covered by sea ice in the Northern Hemisphere are included), given that the seasonal minimum of Arctic sea ice is in September, and Arctic shipping has increased as sea ice has decreased dramatically. The coordinated CMIP5 climate change experiments (Taylor, Stouffer, and Meehl 2012; Knutti and Sedláček 2013; Sillmann et al. 2013) provide new perspectives that aid understanding and studies of present and future climate. Here, 30 CMIP5 models are analyzed (the first ensemble member for each model achieved on the Program for Climate Model Diagnosis and Intercomparison (PCMDI) data portal), including both historical simulations that end in 2005 and projection simulations under the +4.5 and +8.5 W m-2Representative Concentration Pathway (RCP4.5 and RCP8.5, respectively)scenarios from 2006 to 2099. The reanalysis of sea-ice volume during 1979-2011 from the recently updated PIOMAS is used in this study as the ‘observation', since there are no long-term and spatially homogenous sea-ice thickness observations, which improves on prior versions by assimilating sea surface temperatures for ice-free areas and by using a different parameterization for the strength of the ice (Schweiger et al. 2011). Note that the PIOMAS ice volume has uncertainty (a coupled sea-ice-ocean model constrained by the assimilation of sea-ice concentration and sea surface temperature), even though the spatial pattern of the PIOMAS ice thickness resembles the ICESat observation (Schweiger et al. 2011), and the seasonal cycle of the PIOMAS ice volume is largely consistent with the recent CryoSat2 observation (Laxon et al. 2013). Seaice extent data are from the National Snow and Ice Data Center (NSIDC) (Fetterer et al. 2009). Since most of the historical simulations end in 2005, the data for 2006-11 from the RCP4.5 runs are used to extend the time series where necessary.
Results and discussion
Figure 1 shows the evolution of September sea-ice volume from 1979 to 2099 simulated by 30 CMIP5 models. The inter-model spread in the simulated September sea-ice volume is very large (i.e. from 2.42 × 10³to 36.21 × 10³km3in 1979). Some individual models (e.g. ACCESS1.3, CESM1-BGC) capture the rapid decline of the Arctic September sea-ice volume after 2007. The September sea-ice volume trend of the multi-model mean during 1979-2011 is -7.22 × 10³km3, and the corresponding observed ice volume trend is -10.28 × 10³km3. Since the multi-model mean primarily represents the external forcing effect (Kay et al. 2011), it gives a rough estimate of 70% of the anthropogenic contribution to the September ice volume decline rate from 1979 to 2011. This forced contribution factor is close to 97% for the September sea-ice volume from 1979 to 2005, which is much stronger than the forced contribution of 56% for the September sea-ice extent during 1979-2005 (Kay, Holland, and Jahn 2011).
For each year in the historical simulation (1979-2005;CMIP5 historical simulation ends in 2005), the absolute bias is calculated for the September sea-ice volume between the simulation of each individual CMIP5 model and the observation, and the 30 biases are averaged. The standard deviation of the observed sea-ice volume during 1979-2005 is also calculated. Then, the averaged bias is divided by the observed standard deviation, which represents the modeled ice volume spread in CMIP5. The calculation is also repeated for the simulated and observed September sea-ice extent. Note that the spreads of the simulated ice volume and extent are normalized so that they can be compared directly.
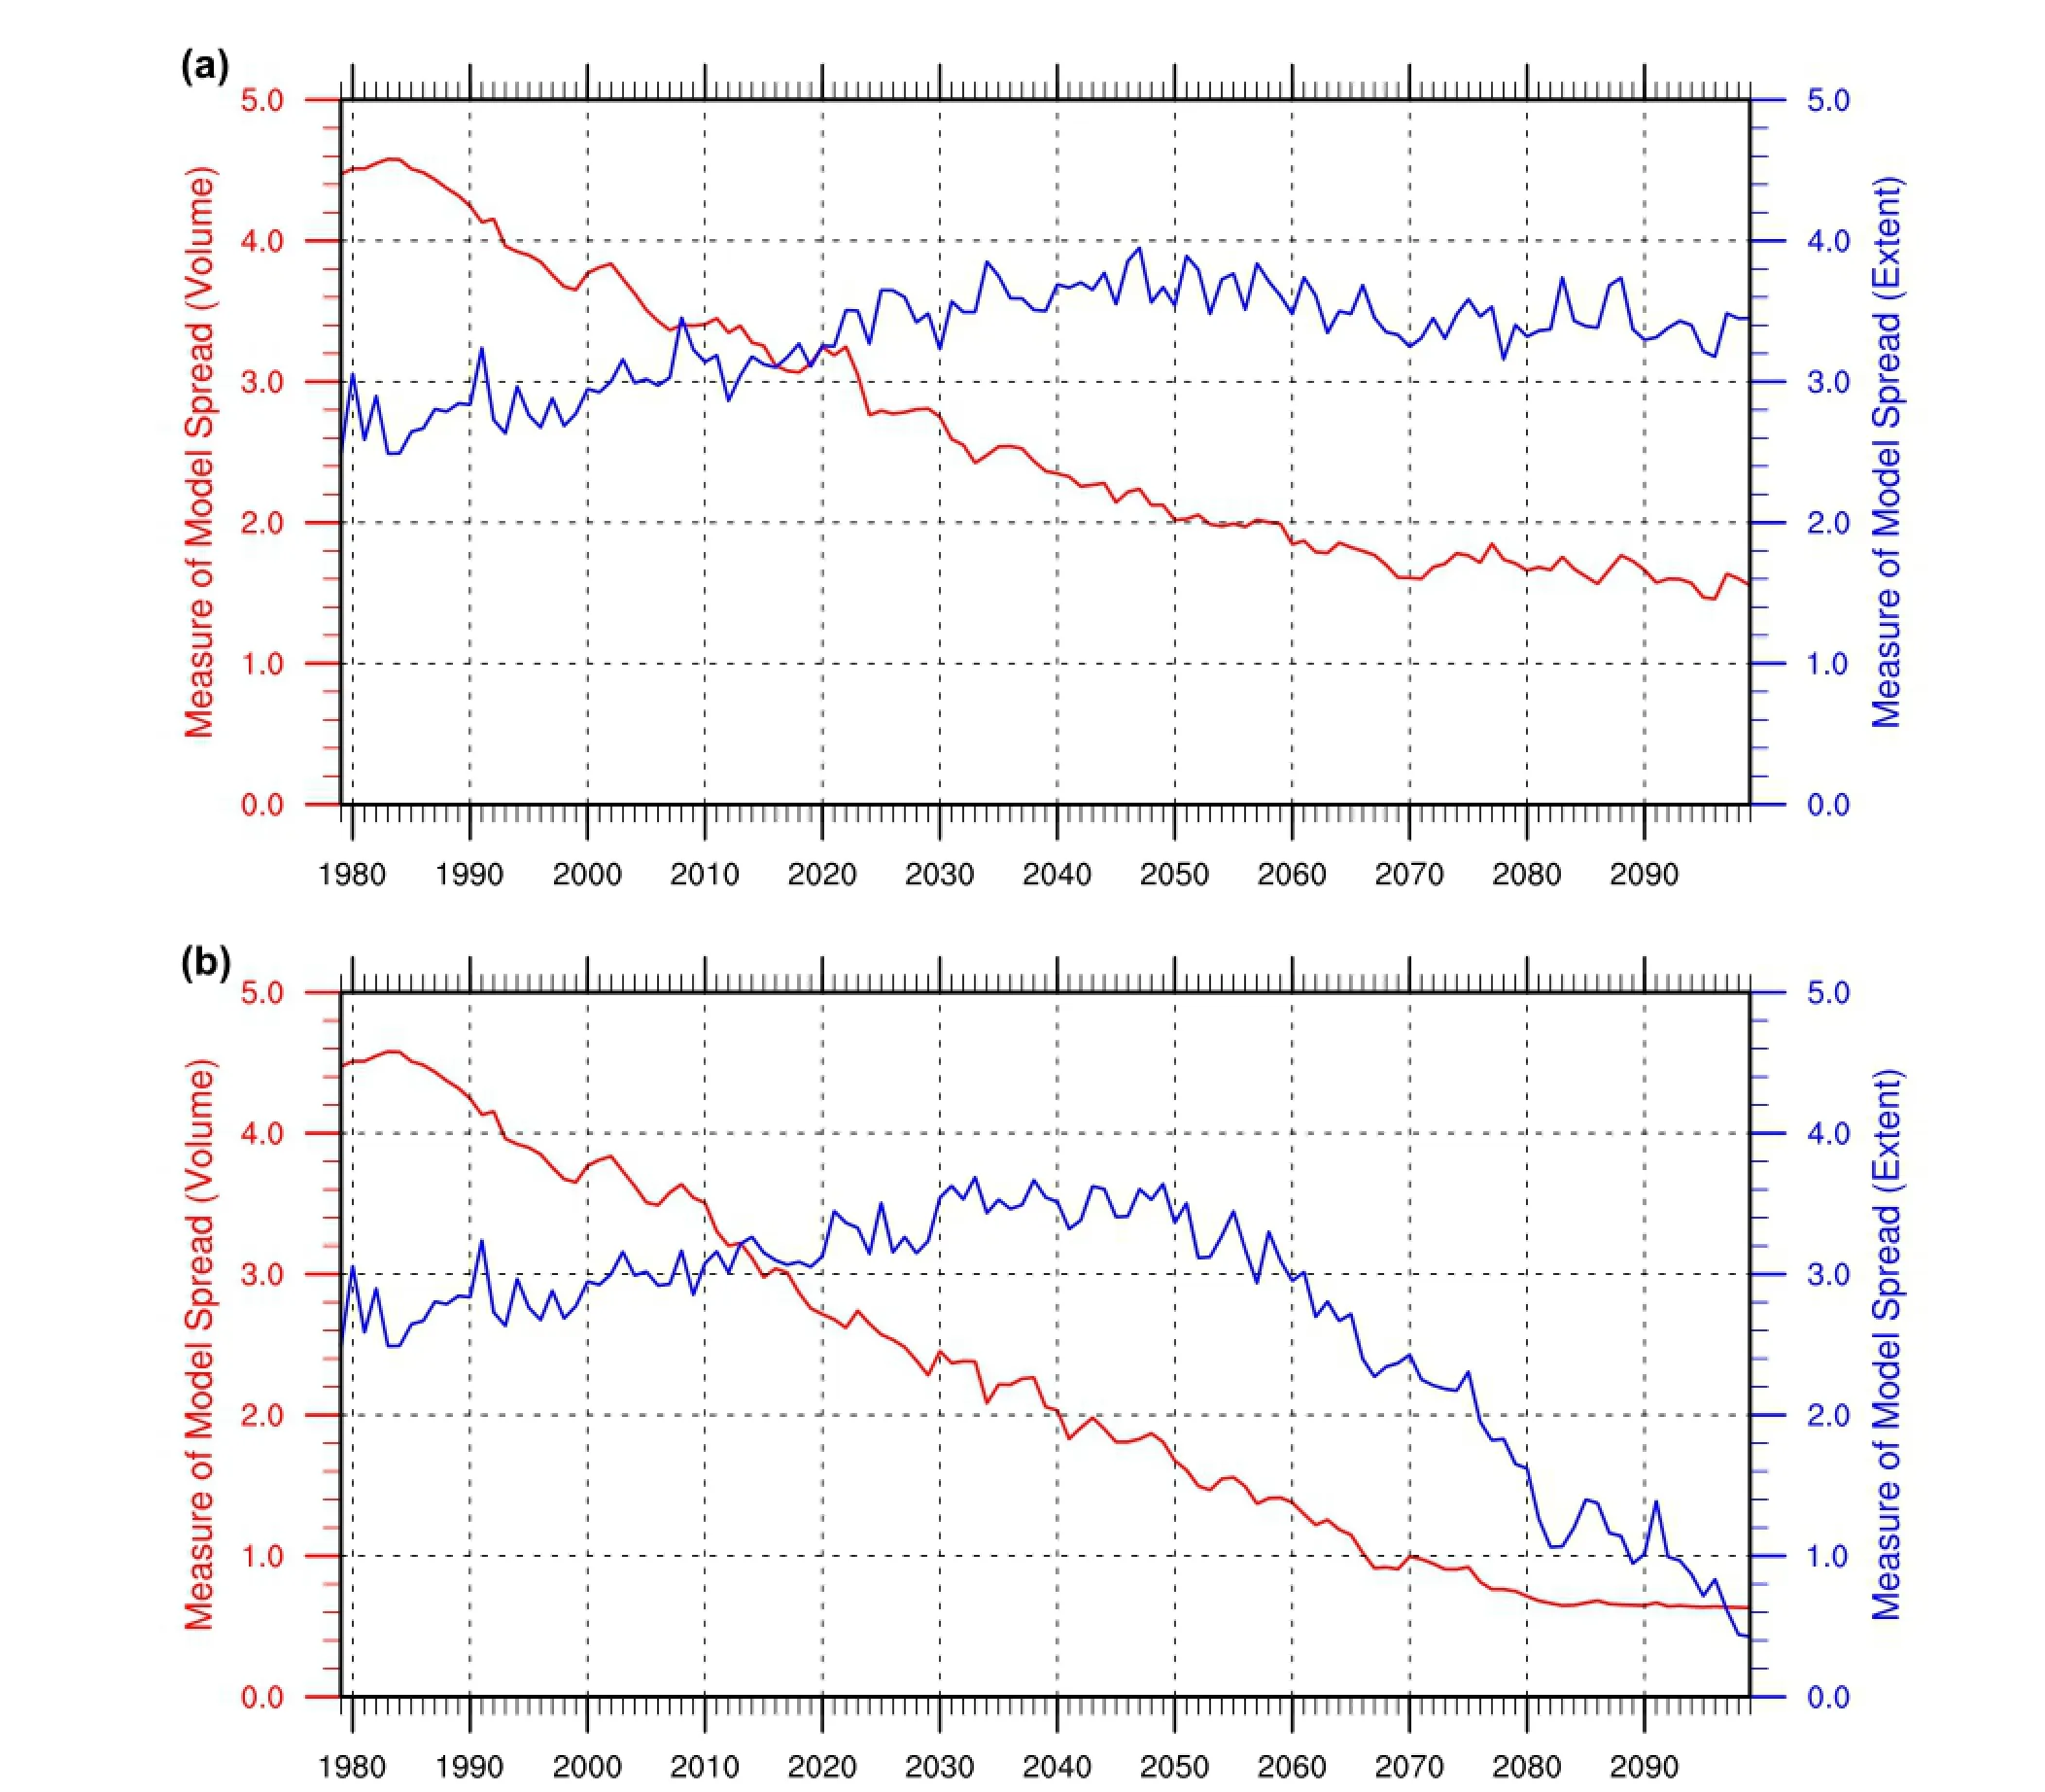
Figure 3.Evolution of the standard deviation of the simulated September sea-ice volume (SepSIV, red) and extent (SepSIE, blue) for 30 models during 1979-2099 with respect to PIOMAS SepSIV and NSIDC SepSIE standard deviation of 1979-2005, respectively, under (a)RCP4.5 and (b) RCP8.5.
As shown in Figure 2, the averaged difference between the simulated September ice volume and observed September ice volume is four times the interannual variability of the volume observation at the beginning (the late 1970s). By contrast, the averaged difference between the simulated September ice extent and observed September sea-ice extent is two times the interannual variability of the extent observation at the beginning. Compared with the September sea-ice extent, the September sea-ice volume has larger spread in the historical simulations of the 30 CMIP5 models, which is mainly attributed to the large spread of simulated sea-ice thickness. With time, the averaged difference of the ice volume gradually decreases and,in 2005, the difference is ~2.8 times the observed interannual variability, but no obvious change is found for the averaged difference of the ice extent during 1979-2005. This implies that the thinning of sea-ice thickness during 1979-2005 tends to reduce the spread in the simulated sea-ice thickness, which is not the case for sea-ice extent. Given that the models could not capture the observed year-to-year variability in an uninitialized long-term simulation, the simulated September ice volume standard deviation of the 30 CMIP5 models is also calculated for each year (i.e. 1979, 1980, 1981, … , 2099), and divided by the standard deviation of PIOMAS September sea-ice volume during 1979-2005, as illustrated in Figure 3. The calculation is also repeated for the simulated and observed September ice extent. It almost reproduces the evolution in Figure 2 when using a different definition to quantify the model spread, which certifies a robust result for evaluating the model spread.
Additionally, the simulated September ice volume shows a faster convergence towards the late twenty-first century than that of the September ice extent for both RCP4.5 and RCP8.5 (Figure 3). The anthropogenic forcing steadily increases from 2005 to 2069 and then becomes stabilized for the RCP4.5 runs, while it shows a sustained increase for the RCP8.5 runs (also Hezel et al. (2014), Figure 1). As shown in Figure 3, from the late 1970s to 2040s, the model spread of the projected September sea-ice extent expands gradually as the Arctic sea ice declines, which shows good agreement with the anthropogenic forcing change for both emissions scenarios, while the modeledSeptember sea-ice volume spread continues to shrink rapidly. By contrast, from the 2050s, the ice extent spread tends to oscillate around 3.5 for RCP4.5, and turns to converge for RCP8.5, while the ice volume spread continues to decrease until ~2070 (~2080) under the RCP4.5 (RCP8.5) scenario, and then oscillates slightly toward the end of the twenty-first century. Thus, the decrease of the ice volume spread is a consequence of both the declining ice extent spread and ice thickness spread. Meanwhile, the consistent signal of shrinking spread under both the RCP4.5 andRCP8.5 scenarios indicates that the September ice volume is a more robust sensor to the forcings.
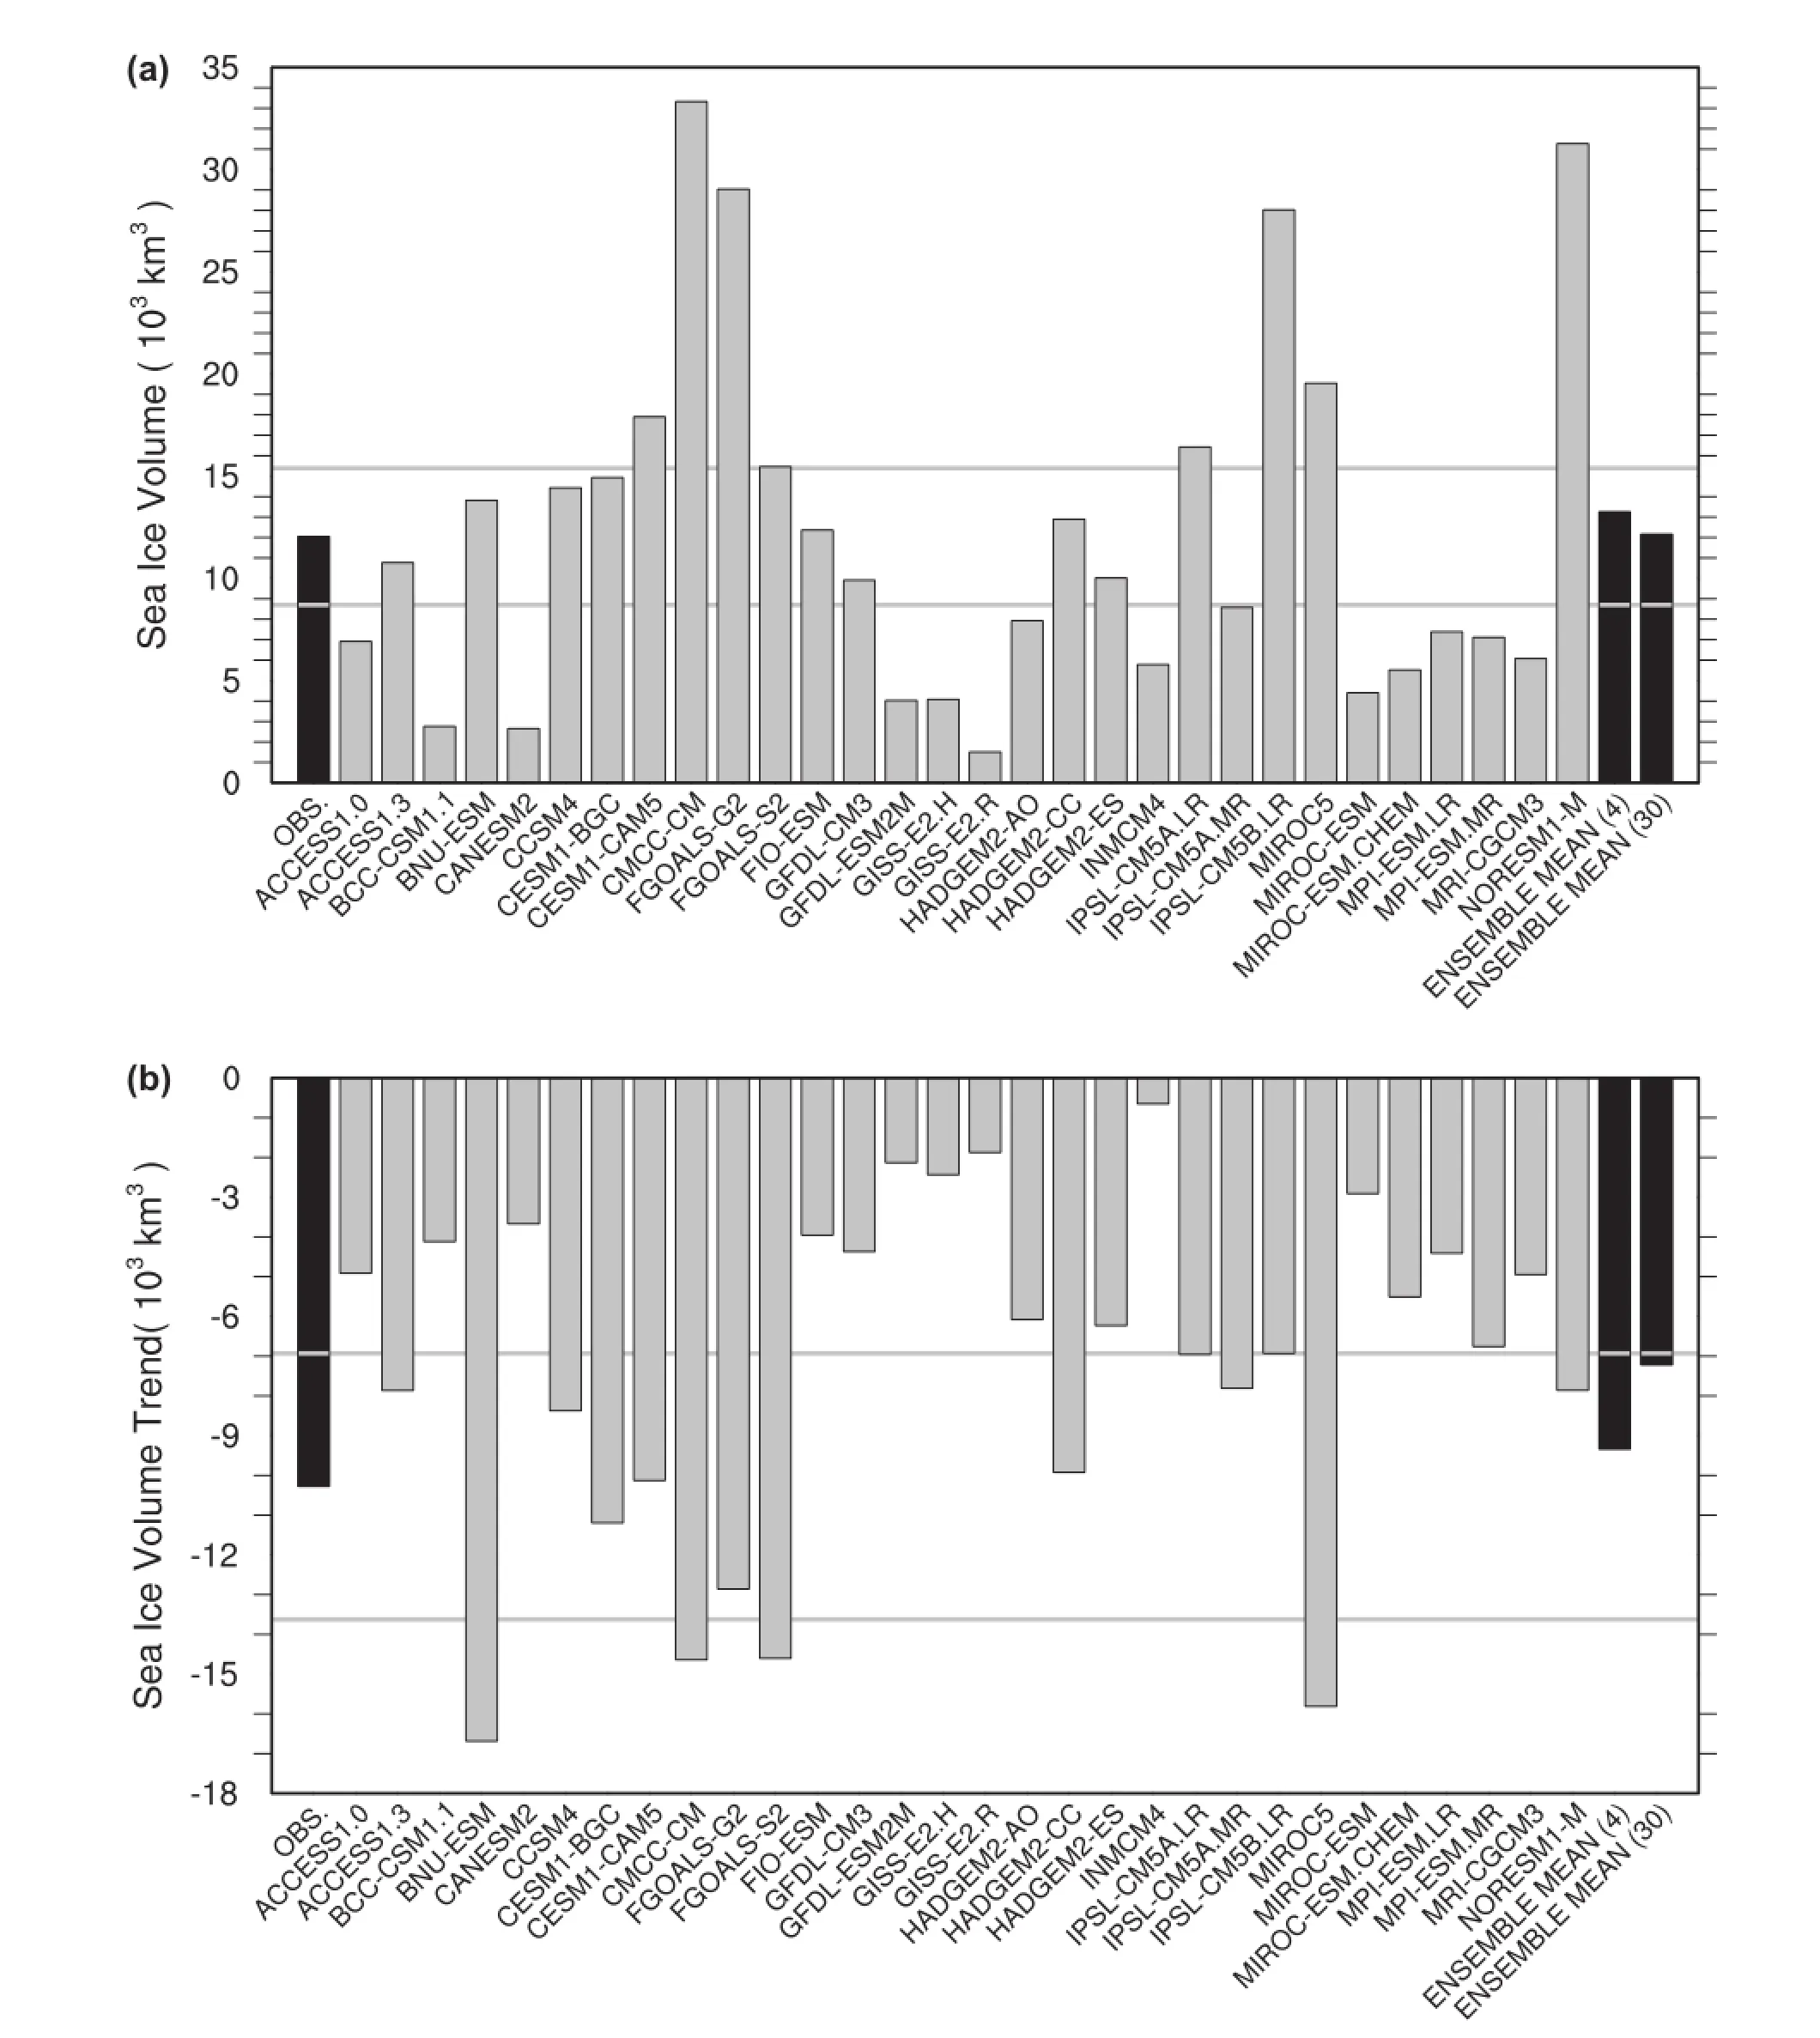
Figure 4.(a) Climatology (average) and (b) linear trend of September sea-ice volume for the ‘observation' (black bar on left) and each CMIP5 model (gray bars) during 1979-2011 (the second to last black bar on right-hand side is the ensemble mean of the four selected models, while the right-most bar is the ensemble mean of all 30 models).
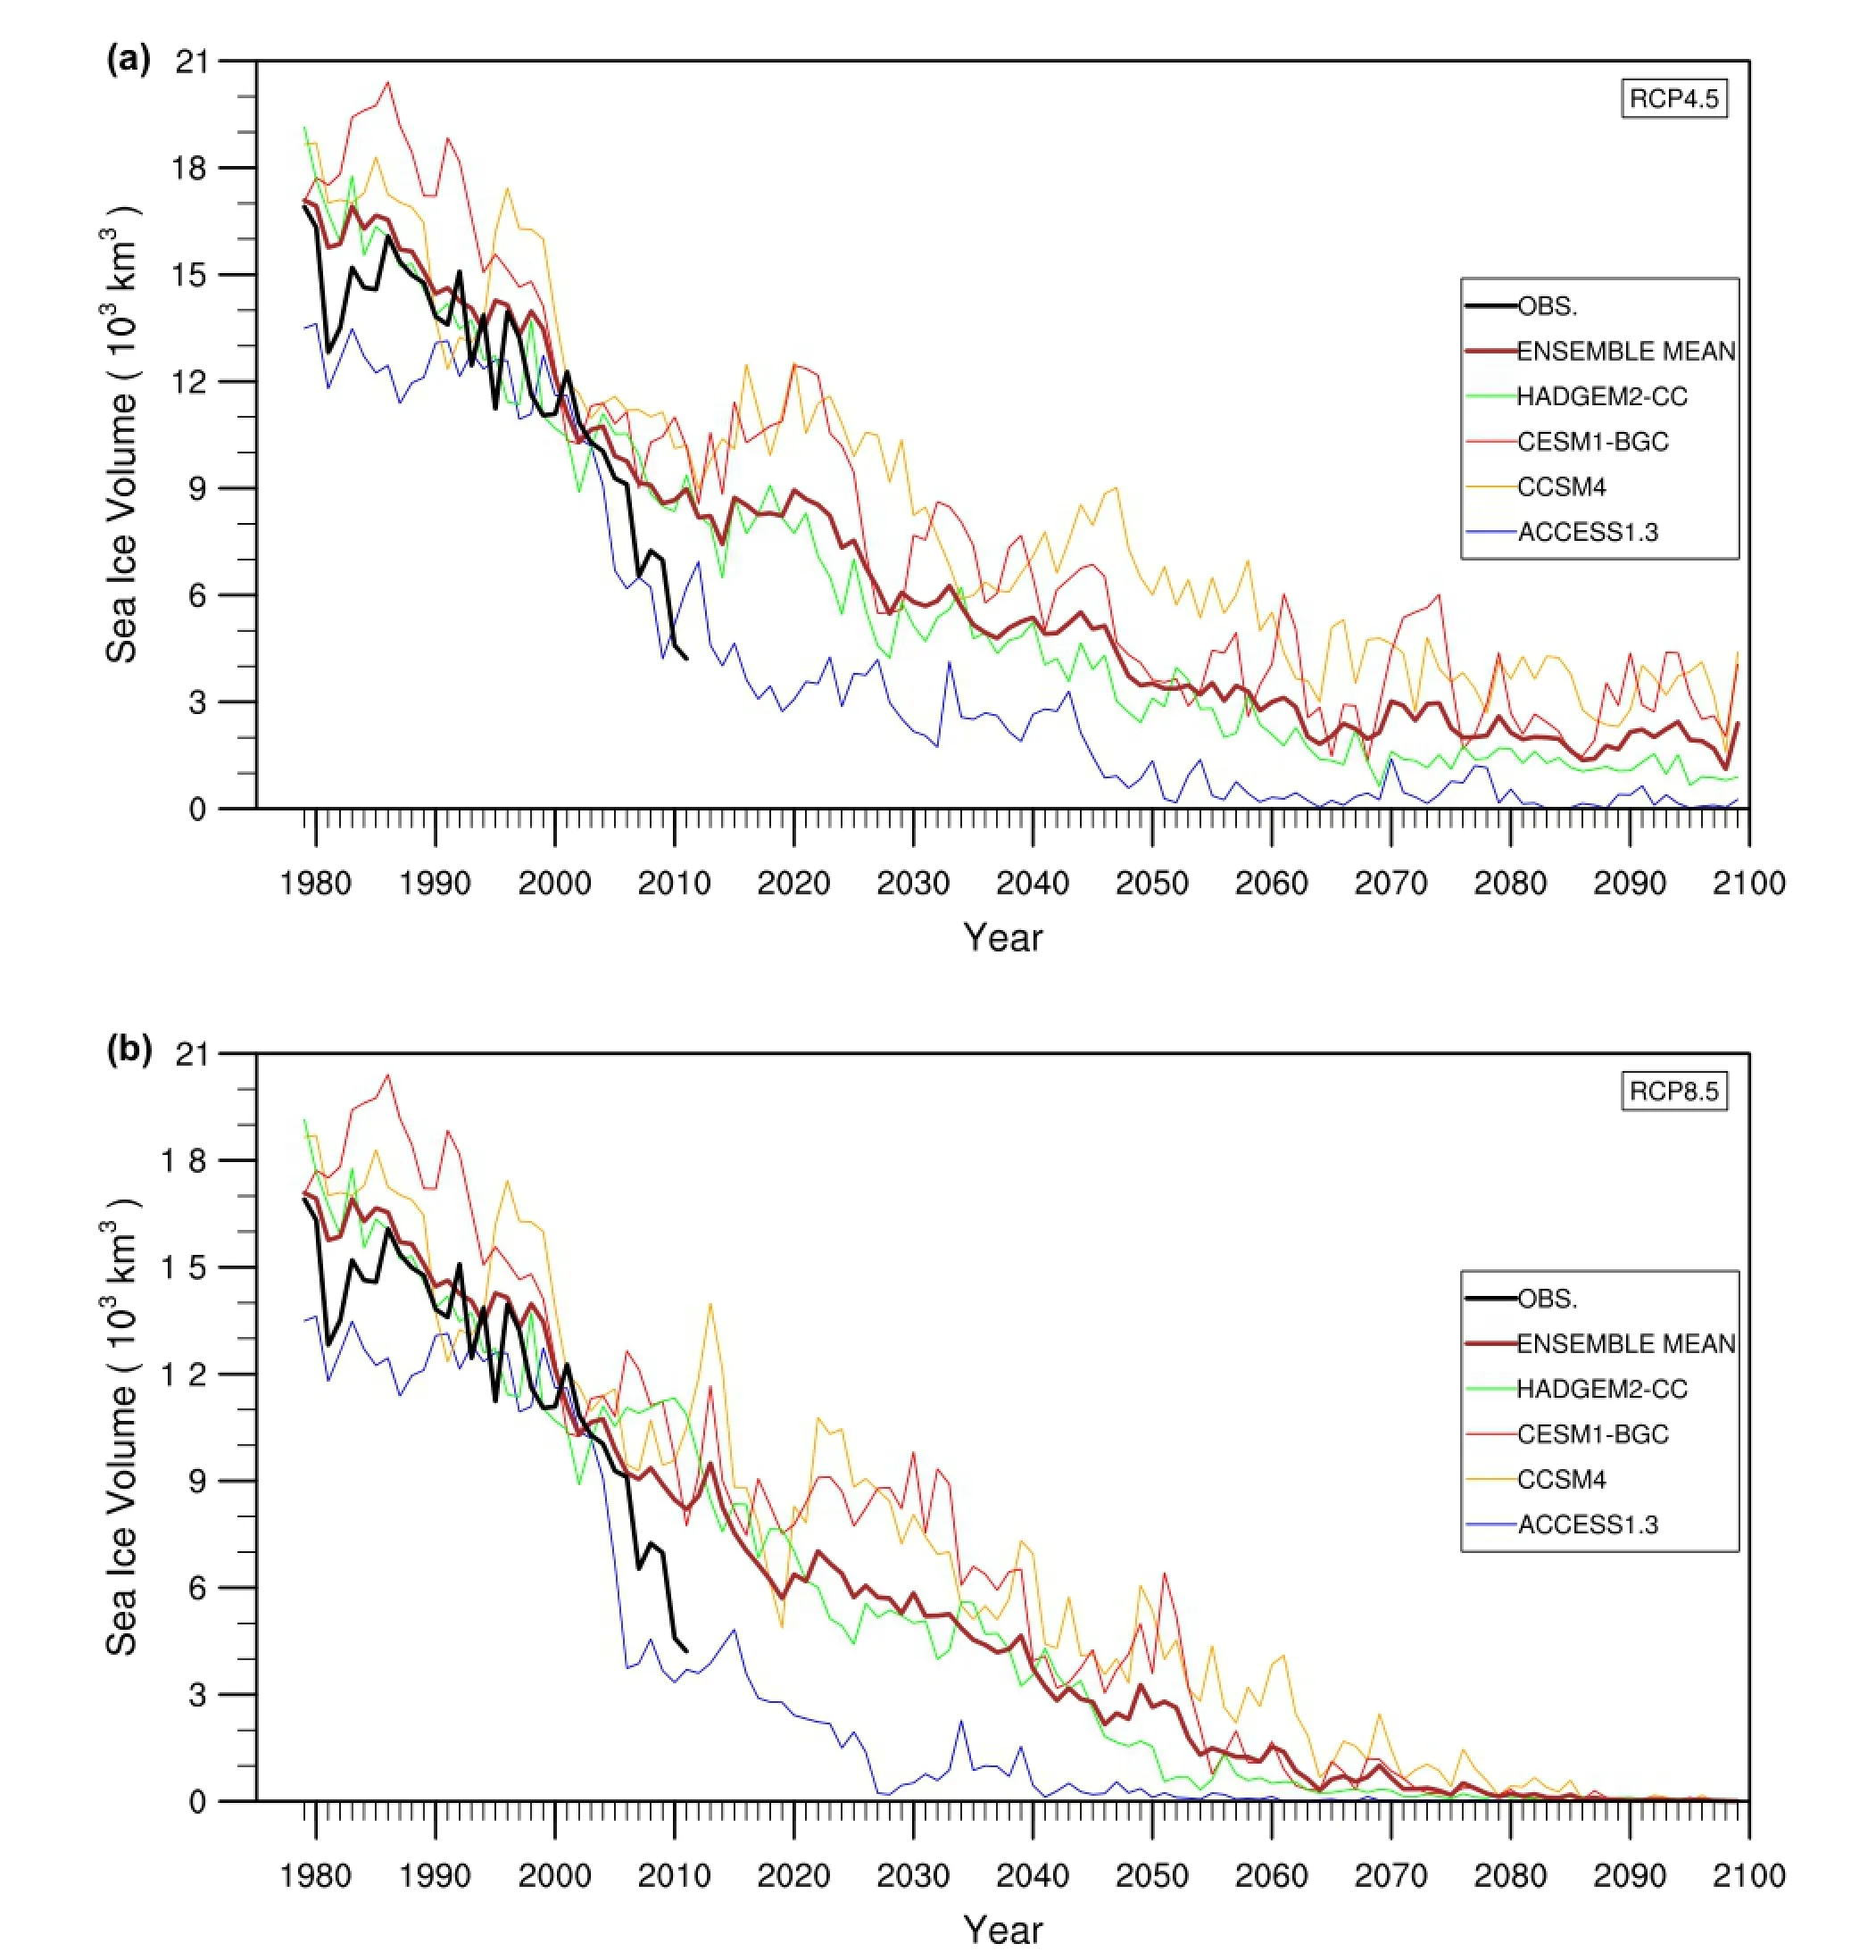
Figure 5.Time series of the observed (thick black line) and simulated (colored lines) September sea-ice volume of four selected CMIP5 models from 1979 to 2005 in the historical simulation and from 2006 to 2099 under the (a) RCP4.5 and (b) RCP8.5 scenarios (the thick brown line is the four-model ensemble mean).
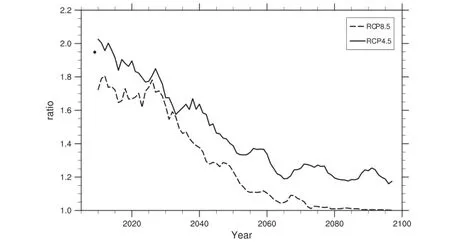
Figure 6.Evolution of the ratio between the proportional reduction in the simulated September sea-ice volume and extent (averaged for the sliding five-year windows) with respect to 1979 for the four selected models under the RCP4.5 (solid line) and RCP8.5 (dashed line)scenarios. The black dot is the ratio for the present state (2007-11) with respect to 1979.
Nonetheless, large spread exists regarding the simulation of September Arctic sea-ice volume. Credible projection of future change in Arctic sea-ice volume is strongly built on the CMIP5 models' abilities to reproduce the observed climatology and variability of sea-ice volume. Using similar methods to those proposed by Liu et al. (2013), the models with the simulated September sea ice volume falling within one standard deviation of the observed September ice volume during 1979-2011 (two gray lines in Figure 4a) are first selected. The corresponding time range is the combination of 1979-2005 for the historical simulation and 2006-11 under the medium-mitigation scenario. Eight of the 30 CMIP5 models satisfy that requirement (ACCESS1.3, BNU-ESM, CCSM4, CESM1-BGC, FIO-ESM, GFDL-CM3, HADGEM2-CC and HADGEM2-ES; Figure 4a). Furthermore, those models with the simulated trend of September sea-ice volume falling within one standard deviation of the observed September ice volume during 1979-2011 are retained and superimposed on the observed trend (two gray lines in Figure 4b). Nine of the 30 CMIP5 models satisfy that requirement (ACCESS1.3, CCSM4,CESM1-BGC, CESM1-CAM5, FGOALS-G2, HADGEM2-CC,IPSL-CM5A.LR, IPSL-CM5A.MR, and NORESM1-M; Figure 4b). The four models that meet both the climatology and trend criteria are ultimately retained. They are: ACCESS1.3,CCSM4, CESM1-BGC, and HADGEM2-CC. The climatology and trend of September sea-ice volume for the ensemble mean of the four models during 1979-2011 are in good agreement with the observation. Compared with the result from the 30-model ensemble mean, an obvious improvement based on the four selected models is reflected in the simulated Arctic sea-ice volume trend in September. Note that, using similar methods to those proposed by Liu et al. (2013), three models (ACCESS1.3, CESM1-BGC, and HADGEM2-CC) of the four selected models in this study based on the ice volume are the same as those in Liu et al.(2013) based on the ice extent. This suggests that the ice volume and extent reflect different ice state evolutions,although they are interrelated.
The ensemble mean of the four models shows that,under the RCP4.5 scenario, the simulated September seaice volume decreases to ~3000 km3(~25% of the observed September ice volume averaged during 1979-2011) in the early 2060s, and then tends to level off towards the end of the twenty-first century after the forcing stabilizes. By contrast, under RCP8.5, the simulated September seaice volume drops to ~3000 km3in the early 2040s, which is almost two decades earlier than under RCP4.5, and approaches zero in the mid-2070s (Figure 5). This is consistent with recent studies showing that the Arctic may reach an ice-free state in the middle of the twenty-first century under RCP8.5 (Massonnet et al. 2012; Liu et al. 2013), while under RCP4.5 the September Arctic sea ice decreases until early in the 2060s when it starts to level off.
Since 2007, the observed September Arctic sea-ice volume has decreased much faster (thick black line in Figure 1) than that of 1979-2006. The PIOMAS estimate shows that the averaged September sea-ice volume for the new low ice-cover state (2007-2011) has decreased by~65.1% with respect to 1979, which is double the speed of decrease of the September sea-ice extent (the averaged September ice extent for 2007-2011 has decreased by~33.4% with respect to 1979). As shown in Figure 6, the relationship between the proportional reduction in simulated September sea-ice volume and extent throughout the twenty-first century is not linear. Here, the proportional reduction is defined as follows: (1) Compute the mean September sea-ice volume (extent) of the four selected models for each year from 2008 to 2099. (2) Based on the results from (1), compute the five-year mean of 2008-12,2009-13, 2010-14, and so on. (3) Compute the rate of decrease of the five-year mean ice volume (extent) relative to 1979. (4) Finally, compute the ratio of the ice volume rate of decrease to the ice extent rate of decrease. Under the RCP4.5 scenario, the proportional reduction of the ice volume is nearly two times that of the ice extent at thebeginning of the twenty-first century, which is consistent with the observation. The ratio decreases to ~1.2-1.3 in the early 2060s, and then tends to oscillate around ~1.2-1.3 towards the end of the twenty-first century. It reflects a more rapid decline of the ice volume than that of the ice extent before the early 2060s. Since the ratio primarily reflects the ensemble mean evolution of the ice thickness,it implies that the basin-wide average ice thickness tends to level off in the early 2060s. By contrast, under the RCP8.5 scenario, the ratio decreases to ~1.2-1.3 in the early 2040s,and approaches ~1 in the early 2070s. The timings of these ratio changes (Figure 6, which mainly reflects the averaged sea-ice thickness change) are in good agreement with the aforementioned spread variations (Figure 3) in RCP4.5 and RCP8.5.
Conclusions
This study identifies (1) significantly larger spread regarding September sea-ice volume forced by anthropogenic and natural forcings, as compared to September sea-ice extent, as shown in the historical simulations, and (2)greater sensitivity regarding September sea-ice volume in response to the increase in greenhouse gas emissions relative to September sea-ice extent, as shown in the projection simulations. These impose further challenges to achieve accurate simulation of Arctic sea-ice volume as the climate warms.
The model selection described in this study reduces the spread in the projected September sea-ice volume under both emissions scenarios. A quantitative analysis of the ice volume and extent reduction using the selected models is implemented, and it indicates that, with respect to the historical condition, the reduction of the ice volume,associated with increasing greenhouse gas emissions, is more rapid than that of the ice extent during the twenty-first century. The ratio evolution (expressing the relation between the reduction in sea-ice volume and sea-ice extent) is in quite good agreement with the anthropogenic forcing variations in both RCP4.5 and RCP8.5. Firstly, the ratio decreases from ~2.0 in the early 2010s to 1.2-1.3 in the early 2060s, then becomes persistent around 1.2,under the RCP4.5 scenario. Secondly, the ratio decreases from ~1.9 at the beginning of the 2010s to near 1 by the end of twenty-first century, under the RCP8.5 scenario. The transition from large to small ratio indicates that the Arctic sea-ice state is changing. Thus, better understanding the evolution of the ratio between the proportional reduction of observed September sea-ice volume and extent may provide us with further clues on the future change of Arctic sea ice.
Moreover, the rapid loss of Arctic sea ice in recent years provides further evidence that Arctic sea ice has entered a new regime of thinner and predominantly first-year ice. Given the discrepancy between the simulated and observed ice volume and rapid change of sea ice, we need to improve the radiative interactions among the atmosphere, sea ice and ocean (positive feedbacks),and poleward oceanic and atmospheric heat transports(potential negative feedback) in climate models, as they play important roles in the simulation of Arctic sea-ice volume. Better representation of these processes, leading to reasonable simulation of Arctic sea-ice volume in response to anthropogenic and natural forcings, is a priority for the accurate prediction of how Arctic sea ice might change in the near future.
Acknowledgments
Thanks and appreciation are extended to the climate modeling groups all across the world, the WCRP Working Group on Coupled Modeling, and the Program for Climate Model Diagnosis and Intercomparison, for making the CMIP5 model outputs available.
Funding
This research was supported by the National Natural Science Foundation of China [grant numbers 41305097 and 41176169],the National Basic Research Program of China [973 program,grant number 2011CB309704].
References
Comiso, J. C., C. L. Parkinson, R. Gersten, and L. Stock. 2008.“Accelerated Decline in the Arctic Sea Ice Cover.” Geophysical Research Letters 35: L01703.
Fetterer, F., K. Knowles, W. Meier, and M. Savoie. 2009. Sea Ice Index [1979-2011]. Boulder, CO: National Snow and Ice Data Center. http://nsidc.org/data/G02135.
Giles, K. A., S. W. Laxon, and A. L. Ridout. 2008. “Circumpolar Thinning of Arctic Sea Ice following the 2007 Record Ice Extent Minimum.” Geophysical Research Letters 35: L22502.
Hezel, P. J., T. Fichefet, and F. Massonnet. 2014. “Modeled Arctic Sea Ice Evolution through 2300 in CMIP5 Extended RCPs.” The Cryosphere 8: 1195-1204.
Kay, J. E., M. M. Holland, and A. Jahn. 2011. “Inter-annual to Multi-decadal Arctic Sea Ice Extent Trends in a Warming World.” Geophysical Research Letters 38: L15708.
Knutti, R., and J. Sedláček. 2013. “Robustness and Uncertainties in the New CMIP5 Climate Model Projections.” Nature Climate Change 3: 369-373.
Kwok, R., and D. Rothrock. 2009. “Decline in Arctic Sea Ice Thickness from Submarine and ICESat Records: 1958-2008.”Geophysical Research Letters 36: L15501.
Kwok, R., and N. Untersteiner. 2011. “The Thinning of Arctic Sea Ice.” Physics Today 64 (4): 36-41.
Langehaug, H. R., F. Geyer, L. H. Smedsrud, and Y. Gao. 2013.“Arctic Sea Ice Decline and Ice Export in the CMIP5 Historical Simulations.” Ocean Modelling 71: 114-126.
Laxon, S. W., K. A. Giles, A. L. Ridout, D. J. Wingham, R. Willatt, R.Cullen, R. Kwok, A. Schweiger, J. Zhang, and C. Haas. 2013.“CryoSat-2 Estimates of Arctic Sea Ice Thickness and Volume.”Geophysical Research Letters 40 (4): 732-737.
Liu, J. P., M. R. Song, R. M. Horton, and Y. Y. Hu. 2013. “Reducing Spread in Climate Model Projections of a September Ice-Free Arctic.” Proceedings of the National Academy of Sciences of the United States of America 110: 12571-12576.
Maslanik, J., C. Fowler, J. Stroeve, S. Drobot, J. Zwally, D. Yi, and W. Emery. 2007. “A Younger, Thinner Arctic Ice Cover: Increased Potential for Rapid, Extensive Sea-Ice Loss.” Geophysical Research Letters 34: L24501.
Maslanik, J., J. Stroeve, C. Fowler, and W. Emery. 2011.“Distribution and Trends in Arctic Sea Ice Age through Spring 2011.” Geophysical Research Letters 38: L13502.
Massonnet, F., T. Fichefet, H. Goosse, C. M. Bitz, G. Philippon-Berthier, M. M. Holland, and P. Y. Barriat. 2012. “Constraining Projections of Summer Arctic Sea Ice.” Cryosphere 6: 1383-1394. Rothrock, D. A., Y. Yu, and G. A. Maykut. 1999. “Thinning of the Arctic Sea-Ice Cover.” Geophysical Research Letters 26: 3469-3472.
Schweiger, A., R. Lindsay, J. L. Zhang, M. Steele, H. Stern, and R. Kwok. 2011. “Uncertainty in Modeled Arctic Sea Ice Volume.”Journal of Geophysical Research-Oceans 116: C00D06.
Serreze, M. C., M. M. Holland, and J. Stroeve. 2007. “Perspectives on the Arctic's Shrinking Sea-Ice Cover.” Science 315: 1533-1536.
Sillmann, J., V. V. Kharin, X. Zhang, F. W. Zwiers, and D. Bronaugh. 2013. “Climate Extremes Indices in the CMIP5 Multimodel Ensemble: Part 1. Model Evaluation in the Present Climate.”Journal of Geophysical Research-Atmospheres 118: 1716-1733. Stroeve, J. C., V. Kattsov, A. Barrett, M. Serreze, T. Pavlova, M. Holland, and W. N. Meier. 2012. “Trends in Arctic Sea Ice Extent from CMIP5, CMIP3 and Observations.” Geophysical Research Letters 39: L16502.
Taylor, K. E., R. J. Stouffer, and G. A. Meehl. 2012. “An Overview of CMIP5 and the Experiment Design.” Bulletin of the American Meteorological Society 93: 485-498.
Wang, M. Y., and J. E. Overland. 2012. “A Sea Ice Free Summer Arctic within 30 Years: An Update from CMIP5 Models.”Geophysical Research Letters 39: L18501.
Zygmuntowska, M., P. Rampal, N. Ivanova, and L. H. Smedsrud. 2014. “Uncertainties in Arctic Sea Ice Thickness and Volume: New Estimates and Implications for Trends.” The Cryosphere 8: 705-720.
7 May 2015
CONTACT SONG Mi-Rong songmirong@lasg.iap.ac.cn
© 2016 The Author(s)
This is an Open Access article distributed under the terms of the Creative Commons Attribution License (http://creativecommons.org/licenses/by/4.0/), which permits unrestricted use, distribution, and reproduction in any medium, provided the original work is properly cited.
猜你喜欢
海洋通报(2021年3期)2021-08-14
成都信息工程大学学报(2021年2期)2021-07-22
智富时代(2017年5期)2017-06-22
智富时代(2017年5期)2017-06-22
电子技术与软件工程(2016年24期)2017-02-23
电脑知识与技术(2016年7期)2016-05-19
科技视界(2016年9期)2016-04-26
中国学术期刊文摘(2016年8期)2016-02-13
中国学术期刊文摘(2016年8期)2016-02-13
中国学术期刊文摘(2016年8期)2016-02-13
 Atmospheric and Oceanic Science Letters2016年1期
- Atmospheric and Oceanic Science Letters的其它文章
- Study on the dependence of the two-dimensional Ikeda model on the parameter
- Aerosol absorption optical depth of fine-mode mineral dust in eastern China
- Characteristics of air quality in Tianjin during the Spring Festival period of 2015
- Calculation of stratosphere-troposphere exchange in East Asia cut-off lows: cases from the Lagrangian perspective
- Evaluation of the individual allocation scheme and its impacts in a dynamic global vegetation model
- Unrealistic treatment of detrained water substance in FGOALS-s2 and its influence on the model's climate sensitivity