
Comparison of satellite-estimated and model-forecasted rainfall data during a deadly debris-flow event in Zhouqu, Northwest China
2016-11-23 01:55WANGJunWANGHuiJunndHONGYng
WANG Jun, WANG Hui-Junnd HONG Yng
aNansen-Zhu International Research Centre, Institute of Atmospheric Sciences, Chinese Academy of Sciences, Beijing, China;bSchool of Civil Engineering and Environmental Science, University of Oklahoma, Norman, OK, USA;cDepartment of Hydraulic Engineering, Tsinghua University,Beijing, China
Comparison of satellite-estimated and model-forecasted rainfall data during a deadly debris-flow event in Zhouqu, Northwest China
WANG Juna, WANG Hui-Junaand HONG Yangb,c
aNansen-Zhu International Research Centre, Institute of Atmospheric Sciences, Chinese Academy of Sciences, Beijing, China;bSchool of Civil Engineering and Environmental Science, University of Oklahoma, Norman, OK, USA;cDepartment of Hydraulic Engineering, Tsinghua University,Beijing, China
The data of several rainfall products, including those estimated from satellite measurements and those forecasted via numerical weather modeling, for a severe debris-flow event in Zhouqu,Northwest China, are compared and analyzed in this paper. The satellite products, including CPC MORPHing technique (CMORPH), TMPA-RT, and PERSIANN are all near-real-time retrieved with high temporal and spatial resolutions. The numerical weather model used in this paper for precipitation forecasting is WRF. The results show that all three satellite products can basically reproduce the rainfall pattern, distribution, timing, scale, and extreme values of the event, compared with gauge data. Their temporal and spatial correlation coefficients with gauge data are as high as about 0.6,which is statistically significant at 0.01 level. The performance of the forecasted results modeled with different spatial resolutions are not as good as the satellite-estimated results, although their correlation coefficients are still statistically significant at 0.05 level. From the total rainfall and extreme value time series for the domain, it is clear that, from the grid-to-grid perspective, the passive microwave-based CMORPH and TRMM products are more accurate than the infrared-based PERSIANN, while PERSIANN performs very well from the general point of view, especially when considering the whole domain or the whole convective precipitation system. The forecasted data— especially the highest resolution model domain data — are able to represent the total or mean precipitation very well in the research domain, while for extreme values the errors are large. This study suggests that satellite-retrieved and model-forecasted rainfall data are a useful complement to gauge data, especially for areas without gauge stations and areas not covered by weather radars.
ARTICLE HISTORY
Revised 11 December 2015
Accepted 25 December 2015
Rainfall; remote sensing;
numerical weather model;
Zhouqu; debris-flow event;high-resolution data
本文比较了三种卫星遥感资料和三层嵌套WRF模式预报降水在舟曲泥石流事件前后相对观测降水的准确度、误差等。结果表明,卫星遥感资料能从降水分布型、降水量值等方面反映出实际的降水特征,尤其是CMORPH和TRMM,更是基本接近实际降水的情况。PERSIANN资料虽然有相对大一些的误差,但区域降水总量、降水区分布型以及最大降水的时空再现已经比较精确。数值预报降水对区域总降水以及降水的分布形态能比较好的预报,高分辨率的模式甚至能较好地预报降水极值的时间和位置,因此在灾害预警方面有较高的应用价值。
1. Introduction
At around midnight on 8 August 2010, local time, sudden heavy rain fell in the mountain area to the northeast of Zhouqu, Gansu Province, Northwest China, triggering a massive debris-flow event in the Sanyanyu and Luojiayu gullies. The debris flow was about 5000 m long, 300 m wide, averaged 5 m thick, and led to 1492 deaths and a reported 272 missing persons. It then flooded into the Bailongjiang River, jamming it to form a barrier lake, which flooded 1/3 of the area of the whole city, destroyed 233.4 acres of farmland, and damaged 5508 rooms, amongst other disastrous consequences and losses (according to the Ministry of Civil Affairs).
The cause of this disaster is very complicated. Several countermeasures against this type of event happening again in the future have been presented on the basis of its factors of influence, characteristics, and trends (Hu et al. 2010; Yan et al. 2010; Liu et al. 2011). However, under the same conditions, the likelihood of fatal flows occurring when it rains heavily remains high (Yu et al. 2010).
Field investigations and remote sensing images indicate that the debris flows were formed by upstream flooding, and the flash flood was triggered by a severe convective weather process with heavy rainfall (Qu et al. 2010). However, because of the challenging terrain of the region, there are few routine weather stations(gauges) and the visual angle and data coverage of radar is restricted. Fortunately, satellites cover almost all of Earth's surface, meaning QPE retrieved from their measurements can compensate for the disadvantages of gauges and radars. Furthermore, numerical weather models can also offer coverage for mountainous areas and, moreover, can provide real-time quantitative precipitation forecasts. The qualities of both satellite-derived and numerical weather model—forecasted rainfall during this debris-flow event in Zhouqu are validated and discussed in this paper.
2. Data and methods
Routine observations of rainfall from weather stations,rainfall data retrieved from satellite instruments, and rainfall forecasted via numerical weather modeling, are used in this paper.
The main research domain, located in the west of China,is domain d03 indicated in Figure 1(a); the terrain is shown in Figure 1(b). From Figure 1(b), it is clear that the terrain of this domain is complex, with elevation ranging from 200 to 4600 m. The black dots represent the gauges from where the data used in this paper originated; the red circled one is the gauge at Zhouqu.
The study period is from 0000 UTC 6 August 2010 to 2300 UTC 9 August 2010. The debris flow event happened at 1602 UTC 7 August 2010, after which it rained twice in the area. This triggered floods and the formation of barrier lakes, which led to additional problems with disastrous consequences.
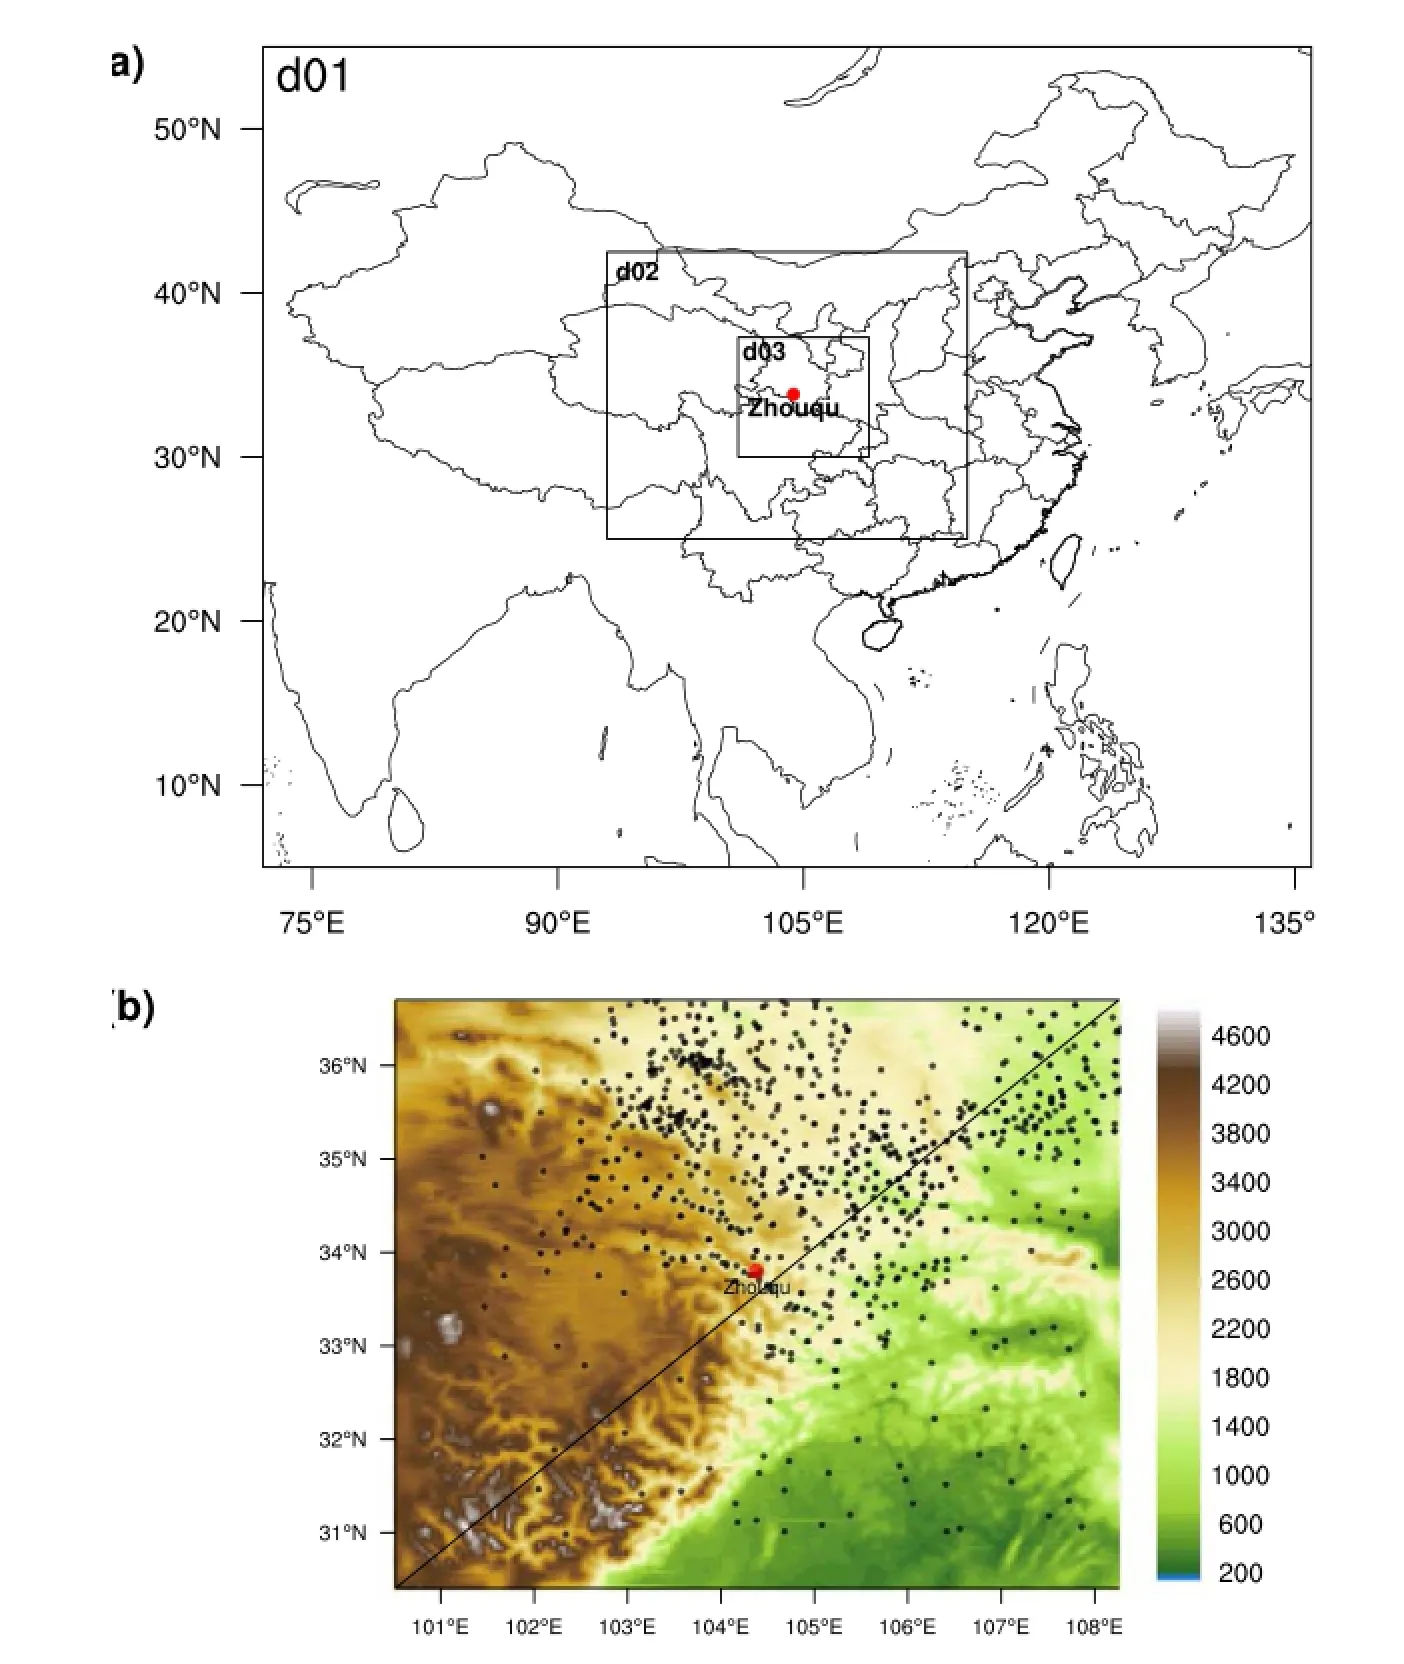
Figure 1.Research domain and its terrain: (a) the three two-way coupled domains of the WRF model; (b) the terrain (color shading) and weather stations (block dots) in domain 03.
2.1. Data
The gauge data from routine and automatic weather stations shown in Figure 1(b) are all six-hourly data with some missing values. The missing values were all eliminated for the following analyses. The distances between stations are unequal, varying from kilometers to hundreds of kilometers. The numbers of gauges near Zhouqu is quite small.
The satellite rainfall data used in this paper derive from three of the world's most well-known, good quality,and most representative products: TRMM-RT (RT stands for real-time), CPC MORPHing technique (CMORPH), and PERSIANN. TRMM is mainly developed at NASA and comprises merged data from passive microwave (PMW) and infrared sensors (Huffman et al. 2007). CMORPH is from NOAA CPC and mainly based on PMW sensors, combined with some infrared information (Joyce et al. 2004, 2010). PERSIANN is from the University of California, Irvine,mainly developed from the data of infrared sensors and calibrated with PMW data (Hong et al. 2004, 2005, 2007). Table 1 shows the basic information of these products,including their temporal and spatial resolutions, revealing that the temporal and spatial resolutions of CMORPH and PERSIANN are rather high, but relatively low for TRMM.
The numerical weather model used in this paper is WRF-ARW V3.2.1, which is a next-generation mesoscale numerical weather prediction system designed to serve both operational forecasting and atmospheric research needs and is suitable for multiple scales ranging from meters to thousands of kilometers (Michalakes et al. 2005;Pattanayak and Mohanty 2008; Skamarock et al. 2008;Coniglio et al. 2010). A number of studies have evaluated WRF-simulated precipitation, snowfall, or wind speed in China, but only a few have examined WRF-forecasted rainfall in China — especially in mountain areas (Wang, Yu, and Song 2011; Wang, Yu, and Wang 2012; Wang and Wang 2013; Yu 2013; Yu, Sun, and Xiang 2013).
The WRF model was set up with three fully coupled domains (Figure 1(a)) and was forced with GFS real-time output every day at 0000 UTC, running 72 h to forecast three days' weather with hourly results outputted. The horizontal spatial resolution of the outer domain (domain 01,d01) was approximately 36 × 36 km, and the ratio of each domain was 1:3. Thus, the horizontal spatial resolution of the inner domain (domain 03, d03) was approximately 4 × 4 km, which is similar to the PERSIANN data. Domain 03 is the main research domain for this paper, covering an area of hundreds of kilometers around Zhouqu. Within this domain, the elevation decreases sharply from west to east,varying from 5227 to 244 m (Figure 1(b)), and the sharpest change is in the middle of the domain where Zhouqu is located. The weather stations in this domain are irregularly distributed, with high density in the northeastern plains and low density in the western mountains (Figure 1(b)).
2.2. Methods
Given the irregular distribution of the stations, the gauge data needed to be interpolated to regular grid boxes in order to compare with the satellite data. Different methods of interpolation may lead to slightly different results(Accadia et al. 2003), but the methods adopted in this paper are all mature, having been tested many times. They include: bi-linear interpolation, Cressman object analysis(Cressman 1959; Vollbrecht and Stahnkejungheim 1978),and weighted area average interpolation.
There are many methods available to evaluate and validate precipitation, among which the ‘threat score' or ‘critical success index' method is the most popular. However,this method can only determine the scales of different products. Since the third Precipitation Intercomparison Project, many new methods have been developed for comparing precipitation at high resolution, but none has stood out over the others as superior (Adler et al. 2001; Kubota et al. 2006; Ebert et al. 2007; Wernli et al. 2008; Jobard et al. 2011). Thus, traditional methods including the Taylor diagram (Taylor 2001), correlation coefficients, and RMSE,are used in this paper for the quantitative assessment of the rainfall data.
3. Results
3.1. Accumulated rainfall
Figure 2 shows the accumulated rainfall over 96 h of the different products in their original spatial resolution (thegauge data were interpolated to 0.25° longitude × 0.25° latitude grids via the Cressman object analysis method). Although both the temporal and spatial resolutions are different, and the source of the data and methods of rainfall estimation are also quite different, the basic spatial patterns of the accumulated rainfall look quite similar. All products show the basic pattern feature that it rains heavily in the middle and northwest part of this domain (mountains), while it rains little in the southeast part (plains), and all products show similar scales and ranges of accumulated rainfall.
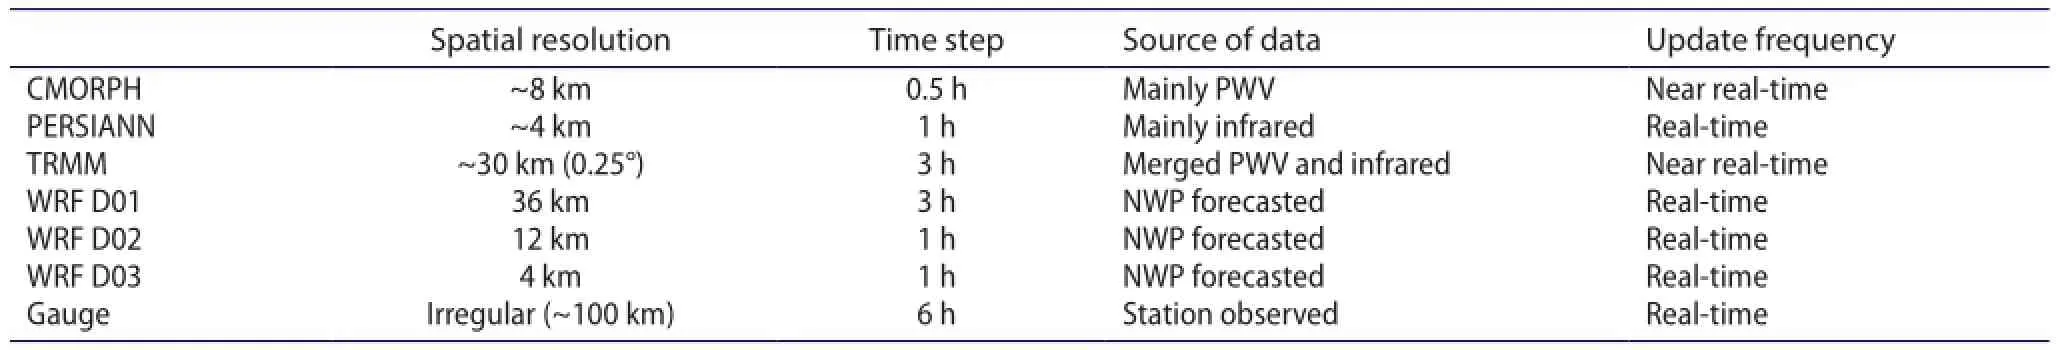
Table 1.Basic information for each product.
In more specific terms, however, there are many differences between each product. The gauge data indicate four rainfall hotspots, among which the middle rainfall belt is the largest rainfall area with the largest rainfall amount across the domain from north to south. The areas of the other hotspots are much smaller, as are their scales. Besides these rainfall hotspots, there are two minor rainfall centers in the southeast and east in the gauge data. There are four rainfall hotspots in the CMORPH data too, albeit connected closely and barely distinguishable as separate. The values of each hotspot are higher than those in the gauge data,and the areas of all the hotspots except the middle one are larger than the gauge data too. The distribution of the PERSIANN data is more similar to the gauge data than CMORPH, but the area of the middle hotspot is smaller than in the gauge data and the position of the northwest hotspot is a little to the east. Incidentally, no rain is indicated in the eastern region by the PERSIANN data, which is quite different from the gauge data and other remote sensing data. The spatial resolution of both CMORPH and PERSIANN is much higher than that of the gauge data,meaning they can provide much more detailed information. The spatial resolution of the TRMM data is the same as the gridded gauge data, but reveals only one rainfall center that covers almost all of the four hotspots found in the gauge data. Like CMORPH, the accumulation values of TRMM are larger than in the gauge data, but the resolution is much lower than that of CMORPH. The rainfall patterns of the three different domains produced by the WRF model are basically the same, just with different spatial resolutions, and the detailed distribution is not identical with that of the gauge data. The rainfall forecasted in the southwest and northeast corners of the three domains is heavier than in the gauge data, and there is no rain at all in the southeast corner in the WRF-forecasted data.
In general, most of the rainfall products can capture the basic information in terms of the spatial pattern and scale of the observed rainfall, but they overestimate the rainfall in the western mountainous areas compared with the gauge data. It is unknown whether it is really overestimated or just because of the lack of observations in thegauge data in those areas. The remote sensing data are more accurate than the model-forecasted data according to the accumulation results.
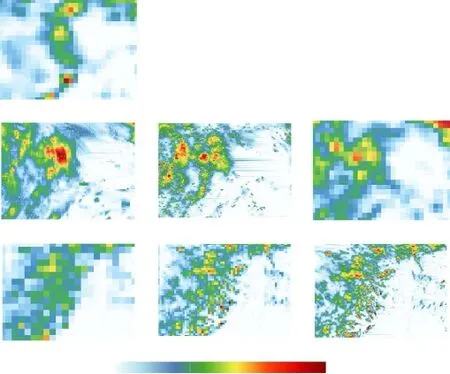
Figure 2.Accumulated rainfall of domain 03 in Figure 1 from 0000 UTC 6 August 2010 to 2300 UTC 9 August 2010 for each rainfall product at their original spatial resolutions.
3.2. Spatiotemporal quantitative comparison
In order to obtain more precise comparison information,the different rainfall products are compared quantitatively in the following Sections 3.2.1 and 3.2.2 with unique temporal and spatial resolution. To facilitate the comparison,all of the data products were first regridded or interpolated to unified grids of 0.25° longitude × 0.25° latitude, and then accumulated to six-hourly data (the same as the gauge observation interval).
3.2.1. Taylor diagram
The RMSE measures the differences between values predicted by a model and/or estimator and the values actually observed. It is a good measure of accuracy. Meanwhile, the correlation coefficient is a measure of the correlation (linear dependence) between two variables. It is widely used as a measure of the strength of linear dependence (or pattern similarity) between two variables. Taylor (2001) introduced a single diagram to summarize multiple aspects,including RMSE and correlation coefficient information, in the evaluation of model performance. Figure 3 shows the Taylor diagram of the regridded data of all the products examined in the present paper.
More specifically, the Taylor diagram in Figure 3 compares the six-hourly satellite- and model-derived rainfall data with the gauge data. The radius of the sector is the normalized standard deviation (the standard deviation of the gauge data is treated as (1), and the angle of the sector indicates the correlation coefficient between the estimated or forecasted data and the gauge data. The distance between the satellite data or model data and the gauge data is the RMSE. The diagram shows that the RMSEs of the remote sensing data are smaller than the WRF-forecasted data, which is quite reasonable. The RMSEs of CMORPH and PERSIANN are smaller than for the TRMM data, indicating higher resolution data are more accurate than lower resolution data. It also shows that the correlation coefficients of CMORPH and TRMM are higher than for PERSIANN; however, the standard deviations are also higher than for PERSIANN, meaning their positioning is better than for PERSIANN while the scale errors are a little higher. The RMSEs of the WRF model forecasted rainfall at different resolutions are much larger than for the satellite data. The higher the resolution of the WRF model, the larger the RMSEs. Although the standard deviation of the higher resolution model is closer to the gauge data, the correlation coefficient is lower, which indicates a higher resolution can forecast the scale accurately but the positioning and spatial pattern is somehow questionable in this area of complex terrain.
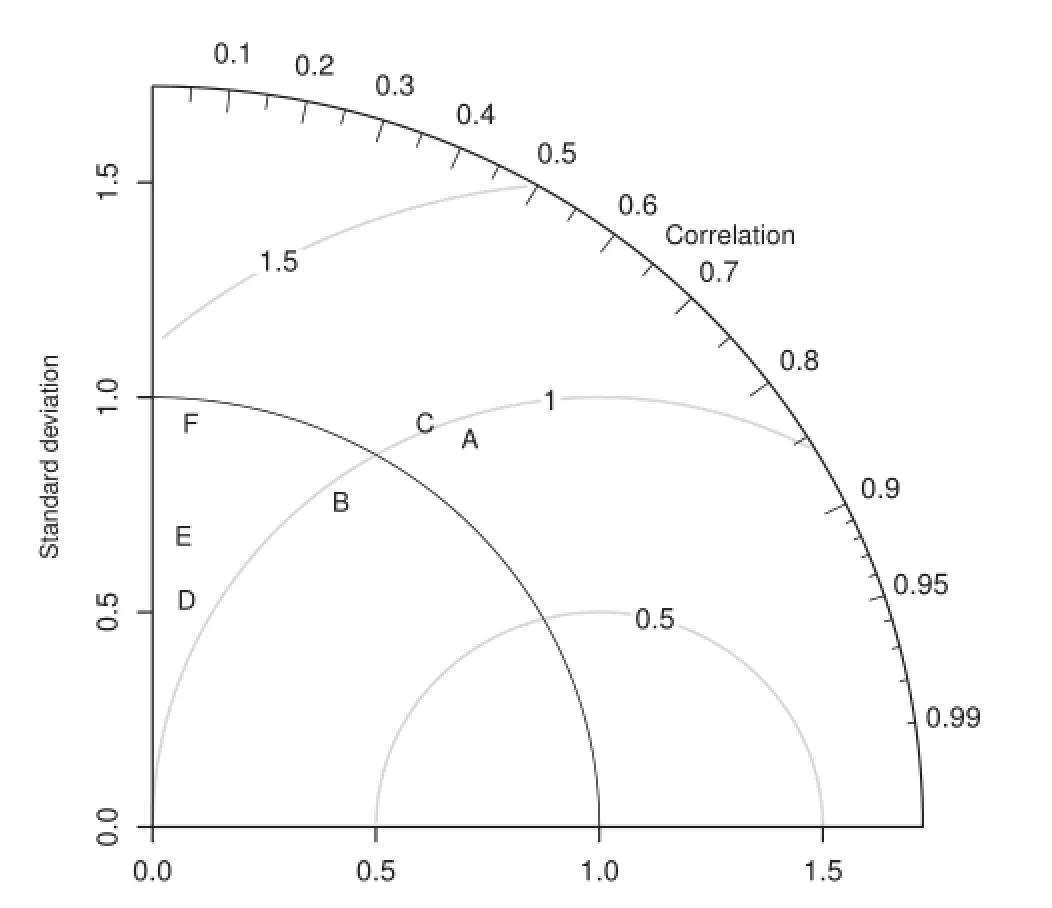
Figure 3.Taylor diagram comparing the six-hourly precipitation of each product: (A) CMORPH; (B) PERSIANN; (C) TRMM; (D) WRF d01; (E) WRF d02; and (F) WRF d03.
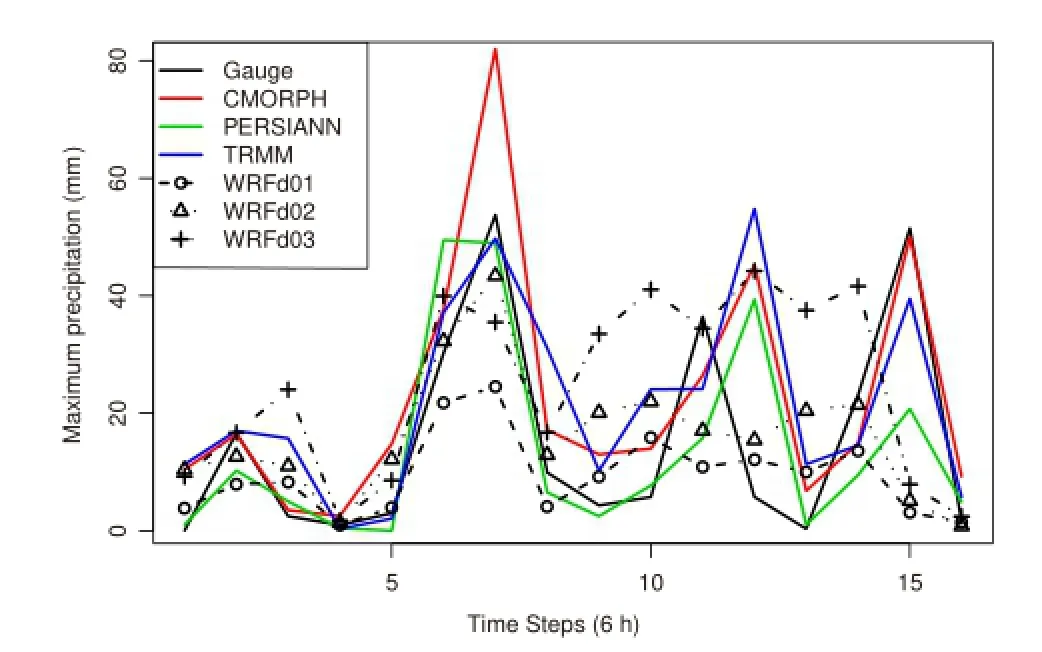
Figure 4.Time series of maximum rainfall in domain 03 of each rainfall product.
3.2.2. Mean and maximum time series
In order to compare the performances of all the products in different periods of the lifespan of the rainfall, maximum rainfall within the research domain at each time step is plotted in Figure 4.
Figure 4 shows three local extreme values at the 7th,11th, and 15th time steps in the gauge data time series,and most of the other data also have those extreme values. The 7th time step extreme is the largest during the whole period in the gauge data, which is also the case in all of the other products apart from TRMM. In the first time step with extreme values (the 7th time step),the CMORPH data are vastly higher than the gauge data,while TRMM and PERSIANN are rather close to the gaugedata. Meanwhile, the performance of the higher resolution model data, WRFD02 and WRFD03, is rather good,even as good as TRMM and PERSIANN. In the 11th time step, only CMORPH, TRMM, PERSIANN, and WRFD03 are roughly in the same scale as the gauge data; the other two model data maximum values are too small,and all of the satellite and model data lag by one time step. CMORPH and TRMM perform the best in the 15th time step, while PERSIANN produces values that are less than half of those in the gauge data. The performance of the model data is not good in this time step, as the value of maximum rainfall is much lower than in the gauge data. Generally, the CMORPH (despite it producing much higher values than the gauge data in the 7th time step) and TRMM maximum time series are the best among the regridded data.
4. Conclusion and discussion
From the above results, it is clear that all of the products, i.e. satellite-retrieved data and numerical model—forecasted data, can capture the main features of mesoscale convective system rainfall, including the distribution, scales,timing, total accumulation, and extreme values. In general, the performance of satellite-derived rainfall is better than model-forecasted data (within which the microwaveretrieved data are better than the infrared data); and basically, the higher resolution model data are better than the lower resolution data.
This paper reveals that real time high-resolution satellite data can reproduce observed rainfall, even in mountainous areas with high altitude and complicated terrain,while there are still considerable errors and uncertainties in both microwave and infrared-based rainfall retrieval. One possible reason for the errors is the basic theory and rationale of the estimation. Another is that the algorithms involved are developed and calibrated mainly based on data from the plains where there is an abundance of gauge stations, while in mountainous areas the algorithms are poorly calibrated. To improve the performance of satellite-derived rainfall, better sensors, algorithms, and more calibrations are needed.
The WRF model, especially at high resolution, can to a certain extent forecast the basic features of rainfall, including the basic distribution, rough position, and time of rainfall; but for precise usage, like monitoring rainfall induced hazards, the model needs to be improved.
Disclosure statement
No potential conflict of interest was reported by the authors.
Funding
This work was supported by the National Natural Science Foundation of China [grant numbers 41421004 and 41210007]; and the International Innovation Team project of the Chinese Academy of Sciences entitled ‘High Resolution Numerical Simulation of Regional Environment'.
References
Accadia, C., S. Mariani, M. Casaioli, A. Lavagnini, and A. Speranza. 2003. “Sensitivity of Precipitation Forecast Skill Scores to Bilinear Interpolation and a Simple Nearest-neighbor Average Method on High-resolution Verification Grids.”Weather and Forecasting 18 (5): 918—932.
Adler, R. F., C. Kidd, G. Petty, M. Morissey, and H. M. Goodman. 2001. “Intercomparison of Global Precipitation Products: The Third Precipitation Intercomparison Project (PIP-3).” Bulletin of the American Meteorological Society 82 (7): 1377—1396.
Coniglio, M. C., K. L. Elmore, J. S. Kain, S. J. Weiss, M. Xue, and M. L. Weisman. 2010. “Evaluation of WRF Model Output for Severe Weather Forecasting from the 2008 NOAA Hazardous Weather Testbed Spring Experiment.” Weather and Forecasting 25 (2): 408—427.
Cressman, G. P. 1959. “An Operational Objective Analysis System.” Monthly Weather Review 87 (10): 367—374.
Ebert, E. E., J. E. Janowiak, and C. Kidd. 2007. “Comparison of Near-real-time Precipitation Estimates from Satellite Observations and Numerical Models.” Bulletin of the American Meteorological Society 88 (1): 47—64.
Hong, Y., K.-L. Hsu, S. Sorooshian, and X. G. Gao. 2004.“Precipitation Estimation from Remotely Sensed Imagery Using an Artificial Neural Network Cloud Classification System.” Journal of Applied Meteorology 43 (12): 1834—1853.
Hong, Y., K.-L. Hsu, S. Sorooshian, and X. G. Gao. 2005. “Improved Representation of Diurnal Variability of Rainfall Retrieved from the Tropical Rainfall Measurement Mission Microwave Imager Adjusted Precipitation Estimation from Remotely Sensed Information Using Artificial Neural Networks(PERSIANN) System.” Journal of Geophysical Research 110: D06102. doi: 10.1029/2004JD005301.
Hong, Y., D. Gochis, J. T. Cheng, K.-L. Hsu, and S. Sorooshian. 2007. “Evaluation of PERSIANN-CCS Rainfall Measurement Using the NAME Event Rain Gauge Network.” Journal of Hydrometeorology 8 (3): 469—482.
Hu, K., Y. Ge, P. Cui, X. J. Guo, and W. Yang. 2010. “Preliminary Analysis of Extra-large-scale Debris Flow Disaster in Zhouqu County of Gansu Province.” Journal of Mountain Science 28 (5): 628—634.
Huffman, G. J., D. T. Bolvin, E. J. Nelkin, D. B. Wolff, R. F. Adler, G. J. Gu, Y. Hong, K. P. Bowman, and E. F. Stocker. 2007. “The TRMM Multisatellite Precipitation Analysis (TMPA): Quasi-global,Multiyear, Combined-sensor Precipitation Estimates at Fine Scales.” Journal of Hydrometeorology 8 (1): 38—55.
Jobard, I., F. Chopin, J. C. Berges, and R. Roca. 2011. “An Intercomparison of 10-day Satellite Precipitation Products During West African Monsoon.” International Journal of Remote Sensing 32 (9): 2353—2376.
Joyce, R. J., J. E. Janowiak, P. A. Arkin, and P. P. Xie. 2004. “CMORPH: A Method that Produces Global Precipitation Estimates from Passive Microwave and Infrared Data at High Spatial and Temporal Resolution.” Journal of Hydrometeorology 5 (3): 487—503.
Joyce, R. J., P. Xie, Y. Yarosh, J. E. Janowiak, and P. A. Arkin. 2010. “CMORPH: A ‘morphing' approach for high resolution precipitation product generation”. In Satellite Rainfall Applications for Surface Hydrology, 23—37. Dordrecht: Springer.
Kubota, T., S. Shige, H. Hashizume, K. Aonashi, N. Takahashi,S. Setoand, Y. N. Takayabu. 2006. “Global Precipitation Map using Satelliteborne MicrowaveRadiometers by the GSMaP Project: Production and Validation.” 2006 IEEE International Geoscience and Remote Sensing Symposium 1—8: 2584—2587.
Liu, C., T. Miao, H. Q. Chen, K. J. Dong, Z. H. Li, and H. J. Li. 2011.“Basic Feature and Origin of the “8·8” Mountain Torrent-debris Flow Disaster Happened in Zhouqu County, Gansu, China,Aug. 8 2010.” Geological Bulletin of China 30 (1): 141—150.
Michalakes, J., J. Dudhia, D. Gill, T. Henderson, J. Klemp,W. Skamarock, and W. Wang. 2005. “The Weather Research and Forecast Model: Software Architecture and Performance.”In Proceedings of the Eleventh ECMWF Workshop on the Use of High Performance Computing in Meteorology, edited by W. Zwieflhofer and G. Mozdzynski, 156—168. Reading, PA: Word Scientific Publishing.
Pattanayak, S., and U. C. Mohanty. 2008. “A Comparative Study on Performance of MM5 and WRF Models in Simulation of Tropical Cyclones Over Indian Seas.” Current Science 95 (7): 923—936.
Qu, X., T. Zhang, X. Liu, Q. Zhou, and X. Zhang. 2010. “Analysis on the Meteorological Causes for the 8 August 2010 Massive Mudslide in Zhouqu, Gansu Province.” Meteorological Monthly 36 (10): 102—105.
Skamarock, W. C., J. B. Klemp, J. Dudhia, D. O. Gill, D. M. Barker,M. G. Duda, X.-Y. Huang, W. Wang, and J. G. Powers. 2008. A Description of the Advanced Research WRF Version 3. NCAR Technical Note. Boulder, CO.
Taylor, K. E. 2001. “Summarizing Multiple Aspects of Model Performance in a Single Diagram.” Journal of Geophysical Research 106 (D7): 7183—7192.
Vollbrecht, C., and K. H. Stahnkejungheim. 1978. “Algorithm of Allocation and Search for an Operational and Objective Analysis System of Meteorological Fields.” Zeitschrift Fur Meteorologie 28 (6): 344—351.
Wang, J., and H. J. Wang. 2013. “Forecasting of Wind Speed in Rudong, Jiangsu Province by the WRF Model.” Climatic and Environmental Research 18 (2): 145—155 (in Chinese). doi:10.3878/j.issn.1006-9585.2013.11152.
Wang, H. J., E. T. Yu, and Y. Song. 2011. “An Exceptionally Heavy Snowfall in Northeast China: Large-scale Circulation Anomalies and Hindcast of the NCAR WRF Model.”Meteorology and Atmospheric Physics 113: 11—25.
Wang, S. Z., E. T. Yu, and H. J. Wang. 2012. “A Simulation Study of a Heavy Rainfall Process over the Yangtze River Valley Using the Two-way Nesting Approach.” Advances in Atmospheric Sciences 29 (4): 731—743.
Wernli, H., M. Paulat, M. Hagen, and C. Frei. 2008. “SAL-A Novel Quality Measure for the Verification of Quantitative Precipitation Forecasts.” Monthly Weather Review 136 (11): 4470—4487.
Yan, C., W. Shen, X. Song, Z. P. Yang, S. Li, J. L. Xie, and G. J. Pang. 2010. “Impact of Eco-environmental Change on Super Flooddebris Flow Occurred on August 8, 2010, in Zhouqu County,Gansu.” Journal of Soil and Water Conservation 24 (6): 258—262.
Yu, E. T. 2013. “High-resolution seasonal snowfall simulation over Northeast China.” Chinese Science Bulletin 58: 1412—1419.
Yu, B., Y. Yang, Y. C. Su, W. J. Huang, and G. F. Wang. 2010.“Research on the Giant Debris Flow Hazards in Zhouqu County, Gansu Province on August 7, 2010.” Journal of Engineering Geology 18 (4): 437—444.
Yu, E. T., J. Q. Sun, and W. L. Xiang. 2013. “High-resolution Hindcast of Record-breaking Rainfall in Beijing and Impact of Topography.” Atmospheric and Oceanic Science Letters 6 (5): 253—258.
Erratum
Ren, H.-L., Wu, J., Zhao, C.-B., Cheng, Y.-J. and Liu, X.-W. (2015) MJO ensemble prediction in BCC-CSM1.1(m) using different initialization schemes. Atmospheric and Oceanic Science Letters. http://dx.doi.org/10.1080/16742834.2015.1132989
When the above article was first published online, Ren Hong-Li's name was incorrected represented in the running heads of the article, and 0000 UTC was omitted from page 2. This has now been corrected in both the print and online versions.
Taylor & Francis apologises for this error.
© 2015 The Author(s). Published by Taylor & Francis
This is an Open Access article distributed under the terms of the Creative Commons Attribution License (http://creativecommons.org/licenses/by/4.0/), which permits unrestricted use,distribution, and reproduction in any medium, provided the original work is properly cited.
26 October 2015
CONTACT WANG Jun wangjun@mail.iap.ac.cn
© 2016 The Author(s). Published by Taylor & Francis
This is an Open Access article distributed under the terms of the Creative Commons Attribution License (http://creativecommons.org/licenses/by/4.0/), which permits unrestricted use, distribution, and reproduction in any medium, provided the original work is properly cited.
猜你喜欢
农业灾害研究(2022年12期)2022-02-16
黑龙江气象(2021年2期)2021-11-05
西藏艺术研究(2020年1期)2020-09-04
家教世界(2018年16期)2018-06-20
金融经济(2017年7期)2017-07-15
电子测试(2016年19期)2016-11-10
甘肃林业(2016年4期)2016-11-07
城市轨道交通研究(2015年3期)2015-02-27
统计与决策(2012年14期)2012-02-21
 Atmospheric and Oceanic Science Letters2016年2期
- Atmospheric and Oceanic Science Letters的其它文章
- Analysis of the extremely cold and heavy snowfall in North America in January 2015
- Heat budget analysis in three typical warm periods simulated by FGOALS-s2
- Cloud microphysical differences with precipitation intensity in a torrential rainfall event in Sichuan, China
- Simulated seasonal variations in nitrogen wet deposition over East Asia
- Real-data assimilation experiment with a joint data assimilation system: assimilating carbon dioxide mole fraction measurements from the Greenhouse gases Observing Satellite
- A review of recent studies on extreme heat in China