
Experimental study of hydrodynamic performance of full-scale horizontal axis tidal current turbine*
2017-03-09 09:09FengmeiJing荆丰梅WeijiaMa马伟佳LiangZhang张亮ShuqiWang王树齐XiaohangWang王晓航
水动力学研究与进展 B辑 2017年1期
关键词:张亮
Feng-mei Jing (荆丰梅), Wei-jia Ma (马伟佳), Liang Zhang (张亮), Shu-qi Wang (王树齐), Xiao-hang Wang (王晓航)
1. College of Shipbuilding Engineering, Harbin Engineering University, Harbin 150001, China, E-mail: jingfengmei@hrbeu.edu.cn
2. School of Naval Architecture and Ocean Engineering, Jiangsu University of Science and Technology, Zhenjiang 212003, China
3. Harbin Electric Machinery Company Limited, Harbin 150040, China
(Received February 15, 2015, Revised November 11, 2015)
Experimental study of hydrodynamic performance of full-scale horizontal axis tidal current turbine*
Feng-mei Jing (荆丰梅)1, Wei-jia Ma (马伟佳)1, Liang Zhang (张亮)1, Shu-qi Wang (王树齐)2, Xiao-hang Wang (王晓航)3
1. College of Shipbuilding Engineering, Harbin Engineering University, Harbin 150001, China, E-mail: jingfengmei@hrbeu.edu.cn
2. School of Naval Architecture and Ocean Engineering, Jiangsu University of Science and Technology, Zhenjiang 212003, China
3. Harbin Electric Machinery Company Limited, Harbin 150040, China
(Received February 15, 2015, Revised November 11, 2015)
In this paper, experiments of both the model turbine (1 kW) and the full scale (10 kW) turbine are carried out in a towing tank and a basin, respectively, and the test of the full scale turbine on the sea is conducted. By comparison between the model turbine (D=0.7 m)and the full scale turbine (D=2.0 m), it is shown that the maximum power coefficient increases with the increase of the diameter of the turbine. The test results on the sea are used to study the hydrodynamic performances of the horizontal axis turbine, and provide a basis for the design. Experimental results can validate the accuracy of the numerical simulation results.
Tidal current energy, horizontal axis turbine, model test, full scale test, sea trial
Introduction
The oceans cover more than 70% of the earth’s surface and offer huge energy resources for the production of electricity and/or fresh water[1-3]. The ocean energy is available in various forms, including tidal wave, tidal current, thermal energy, salinity gradients and biomass[4]. The tidal current energy technology shares many similar fundamental characteristics with the wind energy. Like a wind turbine, the tidal current turbine converts the kinetic energy of the fluid into the electrical energy. However, due to the difference ofthe working environment, there are some distinct phenomena of the tidal current turbine from the wind turbine, including cavitations, free surface, and waveinduced velocity gradient, etc.[5]. For example, compared with the wind turbine, the tidal current turbine has an advantage that those reversing gravity loads, such as the buoyancy, can be used to balance the weight, which is very important for the horizontal-axis tidal current turbine. Given these considerations, it is necessary to study the characteristics of the tidal current turbine, which is of interest for designers.
The investigation of the tidal current energy is a classic topic in recent decades and many fundamental issues were studied by both numerical and experimental approaches. In the design of the horizontal axis turbine, many parameters should be considered, including loads, depth and cavitation occurrence, so the experiment is an effective means to explore the characteristics of the horizontal axis turbine. This paper presents only the experiment work on the horizontalaxis tidal current turbines, and the experiment work on the vertical-axis tidal current turbines were described in the literature[6,7].
A number of experiments were conducted to cha-racterize the turbine performance. Bahaj et al.[8,9]conducted experiments under conditions of different airfoils, pitches and yaws, blade cavitations and twinrotor interactions, to validate blade element momentum models. Wang et al.[10]conducted experimental and numerical study under different rotor preset angles. Maganga et al.[11]conducted experiments in a closedloop water tunnel, examining the effects of the inflow turbulence intensity, varying from 8% to 25%, the yaw angle ranging from −10oto 20o, and the depth beneath the free surface, including observations at 0.94D, 1.37D and 2.04Din a channel of 3.14Ddeep. Galloway et al.[12]carried out small-scale mesh disk rotor simulators to study the structure of the wake, specifically with regard to the depth. Tests were conducted in a flume of 0.3 m deep with disk of 0.1 m in diameter. The depth, measured from the center of the disk, was set to 0.33D,0.50D,0.66Dand0.75Dand the velocity deficit was examined from a distance of 20D. The velocity deficit was found to be higher for shallow settings, and at the deepest settings the disk was considered as a submerged obstruction. Barltrop et al.[13]conducted experiments in a towing-tank using a three-bladed turbine with the diameter of 0.4 m and featuring an S814 airfoil cross-section.
To the authors’ knowledge, there are few experimental studies of the full scale turbine, which serves as a challenge. The full scale turbine experiment is very expensive while the sites that can be used to test the turbine performance are hard to find; because the loads on a full scale turbine are larger than those on a model turbine, the requirements for the test equipment are very severe, which imposes another difficulty for the full scale turbine experiment. However, the full scale turbine test data are important for the study of the horizontal axis tidal current turbine. In this paper, the model turbine experiment is conducted in a towing tank and the full scale turbine is examined in a deep basin, moreover, the full scale turbine is tested in the real sea. The relationship between the model turbine and the full scale turbine is studied by comparing the power coefficient. Experimental results could be used as the basis for the design of the horizontal axis turbine, and also could be used to validate the accuracy of numerical simulation results.
As we all know, in an experiment, if the Froude number is made to satisfy the requirements, it is very difficult to make the Reynolds numbers also satisfy the requirements[14,15], so the scale effect is unavoidable in the experiment. In order to reduce the experiment error, the larger the model, the better the test result will be. However, the large model will increase the cost and make the requirements for the test equipment more complex. The large model is better to be tested in a large basin where the blockage effect can be reduced. Therefore, this paper makes a comparison of results between the 1 kW model turbine (D= 0.7 m)and the 10 kW full scale turbine (D=2.0 m), which would be significantly important for analysis of the scale effect on the horizontal axis tidal current turbine.
1. Turbine experiments
The turbine used in the experiment is a twobladed horizontal axis turbine, where the diameter of the model turbine is 0.7 m and the diameter of the full scale turbine is 2.0 m. The model experiment is carried out in the towing tank of Harbin Engineering University (HEU), the full scale turbine test is carried out in a basin of HEU, and the test of the full scale turbine on the sea is carried out in the Daishan Island of China.
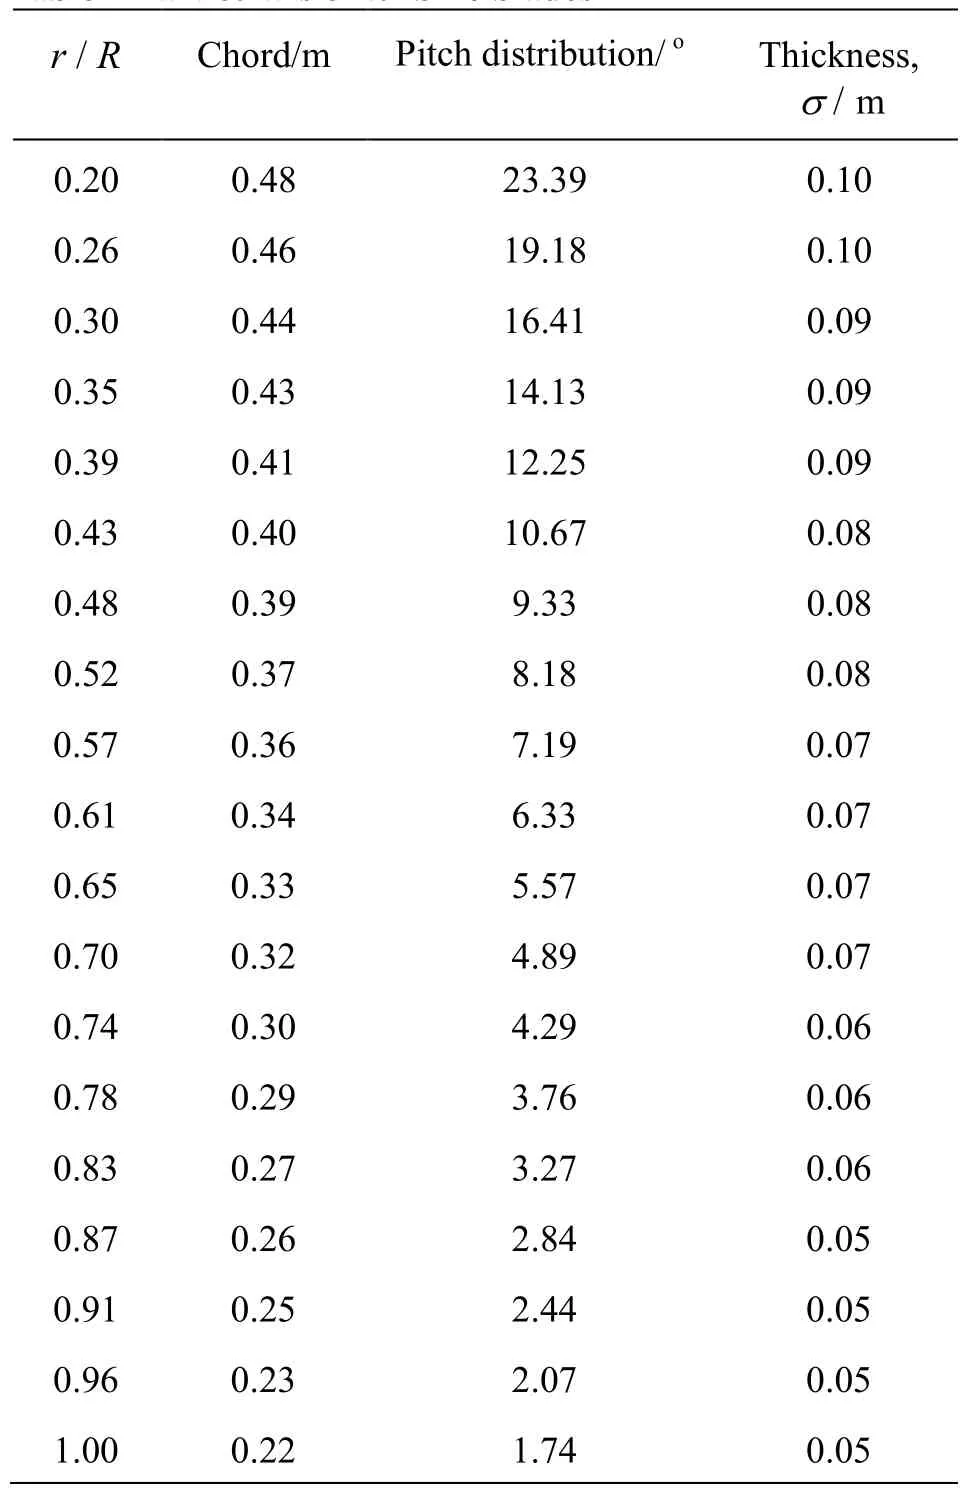
Table 1 Particulars of turbine blades
1.1Description of blades
To improve the utilization efficiency of tidal energy, the blade element momentum (BEM) based Wilson model is applied to the design of the horizontal tidal turbine[16]. The blades of the turbine are developed by Institute of Ocean Renewable Energy System of HEU, based on the simplified wind theory and the Glauert vortex theory[17,18].The blades aredeveloped based on the profile S809, and blade radius (R), the chord (c), pitch distribution (ϕ)and thickness(σ)are shown in Table 1. The blades of the model turbine are made of copper(D=0.7 m)while the blades of the full scale turbine are made of stainless steel(D=2.0 m).
1.2Turbine experiments
1.2.1 Experimental methods
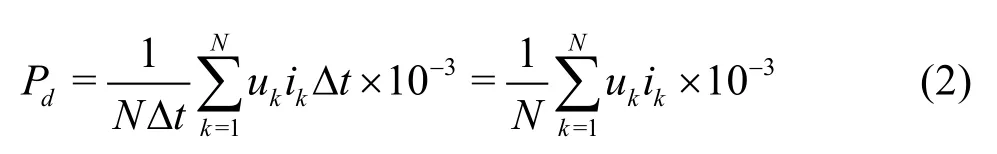
The output power of the tidal current turbine gives electric powers, which include the bearing and seal losses[19,20]. The electric power (Pd)is expressed as

whereu(t)is the instantaneous voltage generated by generator,i(t)is the instantaneous current generated by generator,tis the cumulative sampling time.
The signals of the voltage and the current of the electric power are discretized.
where Δtis the interval sampling time,Nis the sampling frequency,ukis the transient voltage value sampled,ikis the transient current value sampled.
1.2.2 Model turbine equipment and test rig
Experiments of the model turbine of diameter of 0.7 m are carried out in the towing tank at Harbin Engineering University. It is 108.0 m long, 7.0 m wide and 3.5 m deep with a maximum towing speed of 6 m/s. The tank is equipped with a piston type wave maker at the upstream end, and can produce regular and irregular waves with the maximum amplitude of 0.4 m and a period range of 0.4 s-14.0 s. At the downstream end there is a wave absorbing beach.
In the test, the DHDAS data acquisition system is adopted. This system can accurately collect signals of test data, and can ensure the signals synchronized in time. There are two channels in the DHDAS system to display the voltage and the current, respectively.
The output signals of the generator are AC signals, which are transformed to DC signals via rectifiers and are considered as the input of the control system. The electrical power is absorbed with rheostats via a rotary encoder mounted behind the generator, which also allows the regulation of the rotor speed. The power signals are transferred to PC via the data collector and then the voltage and the current can be read from PC. The test diagram is shown in Fig.1. Figure 2 is the chart of the experiment process.

Fig.1 Schematic diagram of experiment test
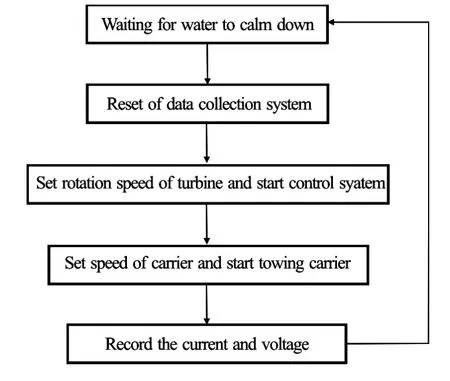
Fig.2 Chart of experiment process
In order to test the model turbine, an experimental test rig that could be bolted to the carriage of the towing tank is designed. The horizontal axis turbine is fixed to an elliptic column, which is connected to a circular column by a flange, and the circular column is fixed to the girder of the carrier. The test rig is shown in Fig.3 .The axis of the turbine is propelled to the flow direction, the rotor is attached to a main shaft, When the rotor rotates, a DC generator is driven through the main shaft, thus the kinetic energy of the fluid is converted to the electric energy. The model copper blades are milled to their shapes and in order to improve sealing, the nacelle is cast from aluminum alloy, with a hole inside to house the generator. For the model turbine (D=0.7 m), the rated current speed is 2.0 m/s and the rated rotation speed of the generator is 350 rpm, and the rated output power of the generator is 1 kW. The objectives of the model turbine experiment include:
(1) Measuring the output voltage and current to obtain the power performance of the model turbine, when the flow speed is 1.0 m/s, 1.5 m/s and 2.0 m/s, and the installation pitch angle is0o,−2.5o,2.5oand 5o.
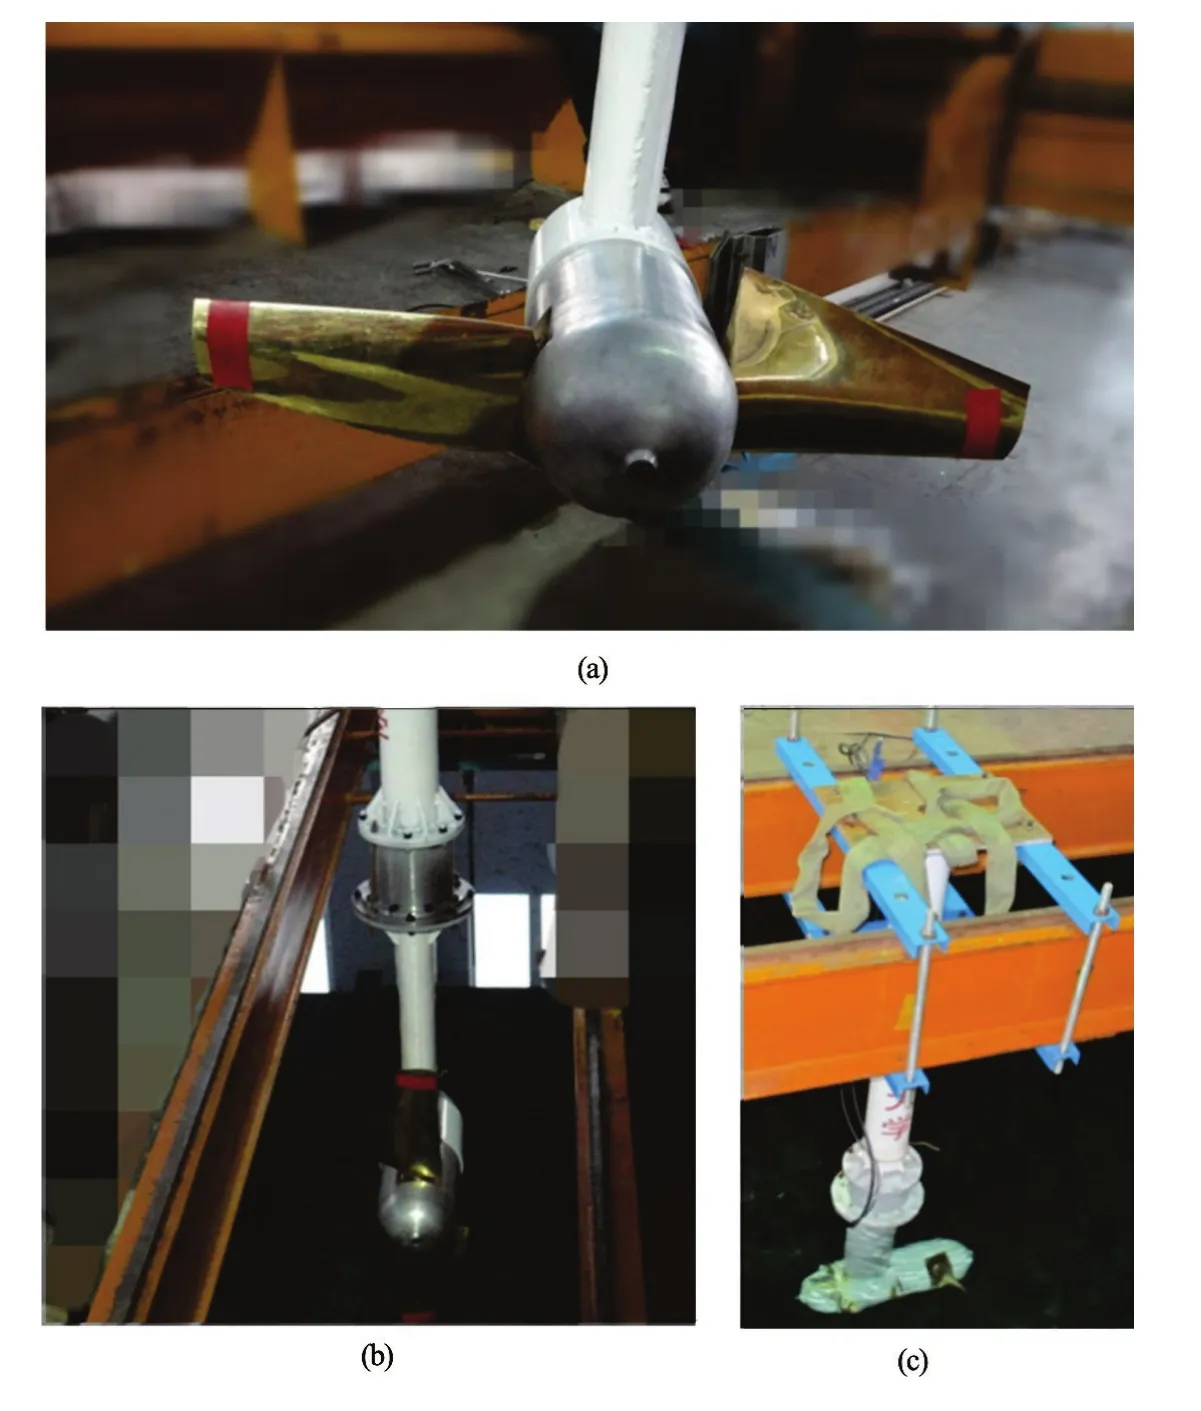
Fig.3 (Color online) Photos of experiment model (1 kW)
(2) Measuring the output voltage and current to obtain the power performance of the model turbine, when the turbine is installed in the opposite direction, that is, the flow goes from the cabin to the blades.
(3) To obtain the power characteristics of the model turbine, while the turbine is working under wave and current.
In this paper, only the first point is discussed, and the others would be discussed in the next paper.
1.3Full scale turbine experiment and test rig
The experiment of the full scale turbine with diameter of 2 m is conducted in the basin of HEU. The basin is 50 m long, 30 m wide and 10 m deep. The basin is also equipped with a piston type wave maker. The rated current speed of the full scale turbine is 2.0 m/s, and the rated rotation speed of the generator is 90 rpm/s and the output power of the generator is 10 kW. And the parameters of the full scale turbine are shown in Table 2. The objectives of the full scale turbine experiment are:
(1) Based on the test of the hydrodynamic performance, to obtain the power characteristics of the turbine.
(2) Based on the test of the hydrodynamic performance, to obtain the load characteristics of the turbine.
(3) Based on the full scale turbine experiment, to validate the accuracy of the numerical simulation results.
(4) To solve some unpredictable issues with regard to the design and manufacture process, which would be significant for the generator working in the real sea.
(5) Compared with the model turbine, to provide information about the scaling effect.
In this paper, all objectives mentioned above are discussed except for point two, which would be discussed in the next paper.

Table 2 Parameters of full scale turbine
The rig layout is shown in Fig.4. The generator (1#) is connected to an elliptic column (5#) by a flange (2#), the elliptic column is connected to the circular column (12#), and then they are connected to the trough girders (13#) and are welted in the girder of the carrier (22#) by the trough girders (21#). The foam layout is shown in Fig.4. The length of the foam is 2.0 m, and its diameter is 0.4 m. A picture of the full scale turbine experiments carried out in basin is given in Fig.5.

Fig.4 The rig layout of full scale turbine

Fig.5 (Color online) Photo of the full scale turbine experiment in basin
1.4Full scale turbine test in real sea
The full scale turbine is tested under the real sea condition, in the Xiaomentou channel, Daishan island, China. The maximum flow speed is about 2.5 m/s, the minimum flow speed is about 1.2 m/s, and the average flow speed is about 1.7 m/s. The highest water level is about 7.5 m, while the lowest water level is about 3.6 m/s. The seabed is covered with stone. All environment parameters mentioned above were measured by the Second Institute of Oceanography, SOA.
The tidal current power station is fixed on the seabed, named “Haiming I” and developed by HEU. The generator is supported by a triangular basement and a hexagon framework, and the generator can rotate around the upper and lower points of the hexagon framework, as shown in Fig.6. The advantage of this device is that the generator can rotate following the incoming flow in the range of ±180o. The full scale turbine working in the real sea is shown in Fig.7. The objectives of the test are:
(1) To validate the structural strength of the tidal current power station under the real sea condition.
(2) To validate the characteristic performance of the turbine, by the measurement of the flow speed and the power output.
(3) To validate the control system, to see whether it realizes the optimal power controlling or not.
(4) To validate the reliability of the seal components.
In this paper, all objectives mentioned above are discussed except for point three, which will be discussed in the next paper.

Fig.6 Full scale turbine layout

Fig.7 (Color online) Photo of full scale turbine working in the real sea
The test of the full scale turbine in the real sea includes two parts: one is to measure the flow speed using Aquadopp profiler 2 MHz with a standard head, which is 200 m depth rating, 9 MB of memory, with pressure sensors (0 m-500 m), compasses and tiltautomatic detectors up and down, 10 m polyurethane cables of 8 pin connector, the other is to measure the power output using software by recording the voltage and the current. The “Haiming” tidal current power station operates from November 2011, and it is shownthat the structural strength and the seal components of the turbine can satisfy the related requirements.
2. Results and discussions
2.1Model test results
The power coefficient of the turbine is defined as

The thrust coefficient of the turbine is defined as

wherePis the power output of the turbine,Dis the diameter of the turbine,Tis the thrust force of the turbine,Uis the free stream velocity, which is equivalent to the speed of carriage,ρis the fluid density.
The tip speed ratio of the turbine is given as

whereωis the angular velocity of the turbine.
The hydrodynamic performances of the turbine are described by usingCp-λcurves andP-ωcurves, which indicate the turbine’s ability of capturing the tidal current energy. Due to the limitation of the experiment model, there is not enough space to install the torque meter in the cabin, therefore, only power characteristic curves are obtained. The output power of the model turbine is measured at different flow speeds.
The incoming flow speed influences the Renoyld’s number of the blade, thus the hydrodynamic performances of the turbine would be affected by the incoming flow speed. During the experiment, the power output of the turbine is measured for different tip speed ratios and pitch angles. The tip speed ratio is dimensionalised by the incoming flow speed and the rotational speed of the turbine, controlled by changing the speed of the towing carrier and the rotational speed of the turbine in practice. TheCp-λcurves at different incoming flow speeds (1.0 m/s, 1.5 m/s and 2.0 m/s) are shown in Fig.8. Fig.8 shows that when the speed ratio is about 5, the maximum value ofCpis reached. The rotational speed of the turbine increases with the increase of the incoming flow speed for a constant tip speed ratio, and the trends of curves at different incoming flow speeds are similar. However, with the increase of the incoming flow speed, the maximum value ofCpdecreases gradually. There might be two reasons to explain the results mentioned above. One is that with the increase of the incoming flow speed, the free surface attack is severed, which affects the working condition of the turbine, the other one is that with the increase of the rotating speed of the turbine, cavitations might occur on the surface of the blade. The pitch angles tested in experiment are 0o,−2.5o,2.5oand 5o. The experiment results are shown in Fig.9. For the design turbine, when the pitch angle is0o, the power performance of the turbine is optimal. Therefore, the full scale turbine is a fixed pitch turbine, with the pitch angle of0o.
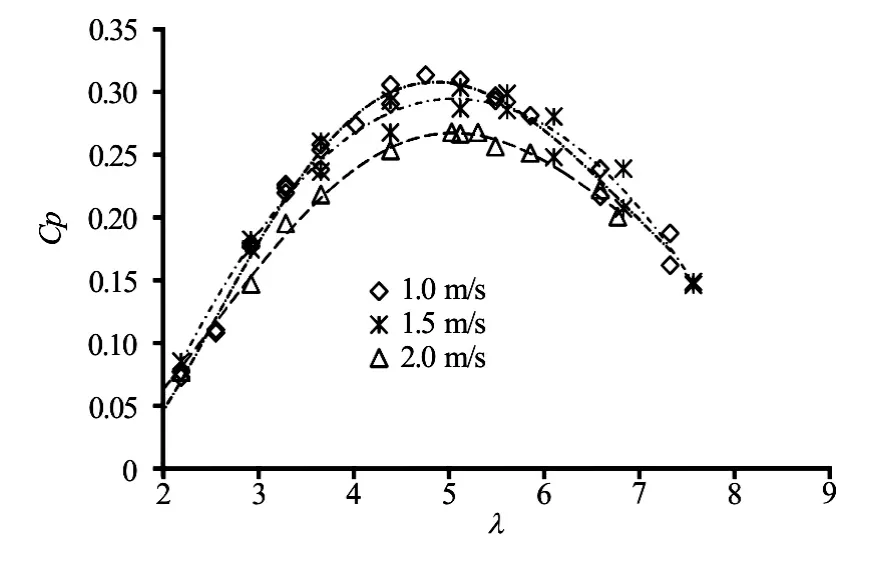
Fig.8 Power coefficients with tip speed ratio at different flow speeds
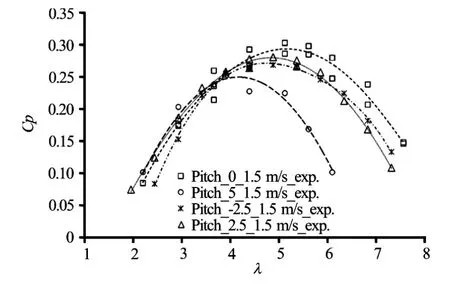
Fig.9 Power coefficients with tip speed ratio at different pitch angles
2.2Full scale turbine test results in basin
The full scale turbine experiment is carried out in a basin and the incoming flow speeds are 1.5 m/s, 1.8 m/s and 2.0 m/s. The axial force of the turbine increases with the increase of the tip speed ratio, and at the high range of the tip speed ratio, the axial force becomes too large for the towing carrier to support, therefore, only a part of experiment data in the low range of the speed ratio is obtained. The test results are shown in Fig.10. When the incoming flow speed is 1.5 m/s and 1.8 m/s, the output power of the turbine is2.0 kW and 3.6 kW, and the maximum power coefficients are 38.0% and 38.8%, respectively. When the current speed is 2.0 m/s, the loads become too great, resulting in a strong vibration of the support structure, so only data for one point are obtained (whenn= 70 rpm,P=4.9 kW), and the power coefficient is about 39% at this point.
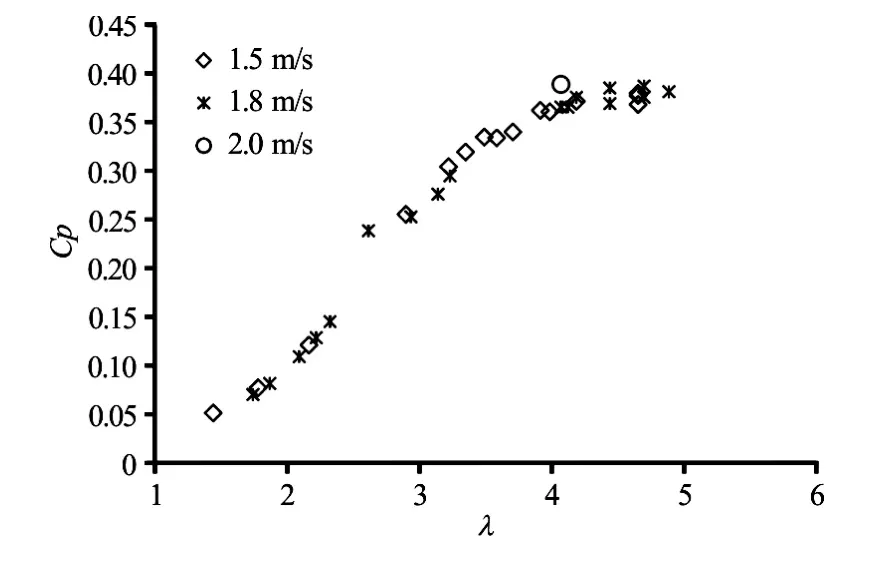
Fig.10 Power performance of full scale turbine
Based on the full scale turbine test in the basin, the power and load characteristics are checked, and some unpredictable problems are found during testing. When the generator is working in a high rotation speed, the output voltage is too large to make the control system operate normally, which is another reason why the experimental results are not available in the high rotation speed range, and this issue can be solved by increasing the rated voltage of the control system. During the full scale turbine testing, the starting torque of the generator is tested, and the results show that the static magnetic torque is very large, to make the turbine a little difficult to start, and this issue should be solved during the design process of the generator. The full scale turbine experiment is the basis for the turbine working in the real sea. The comparison between the full scale turbine and the model turbine is important for the study of the scale effect, to provide useful information for the design and operation of larger scale tidal current power stations.

Fig.11 Comparison between model turbine (1 kW) and full scale turbine (10 kW)
For the tidal current turbine, the offset of the curves due to the scale effect should not be ignored, and it is important to determine the accuracy of the scale effect. The comparison between the model turbine results and the full scale turbine results is shown in Fig.11. The maximum power coefficient (Cpmax) of the full scale turbine (D=2.0 m)is higher than that of the model turbine(D=0.7 m), by about 6%. And the speed ratio with respect to the maximum power coefficient(Cpmax)in the full scale is a little smaller than that of the model turbine. With the increase of the diameter of the turbines, the power coefficient of the turbine increases, and the speed ratio responding to the maximum power coefficient decreases, and the reason might be the decrease of the friction loss. The comparison between the model turbine and the full scale turbine could provide the results of the scale effect, which would be the basis to study the scale effect.
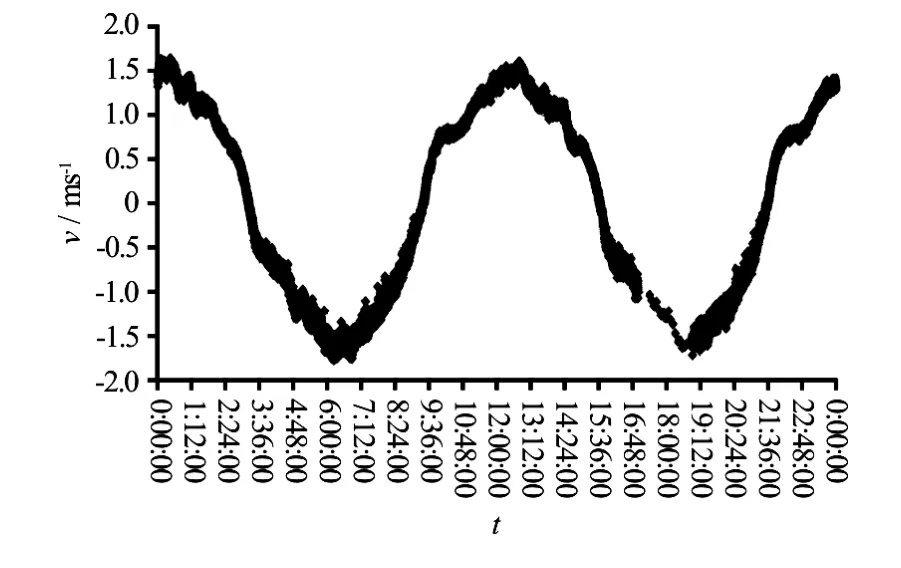
Fig.12 Current speed varied with time
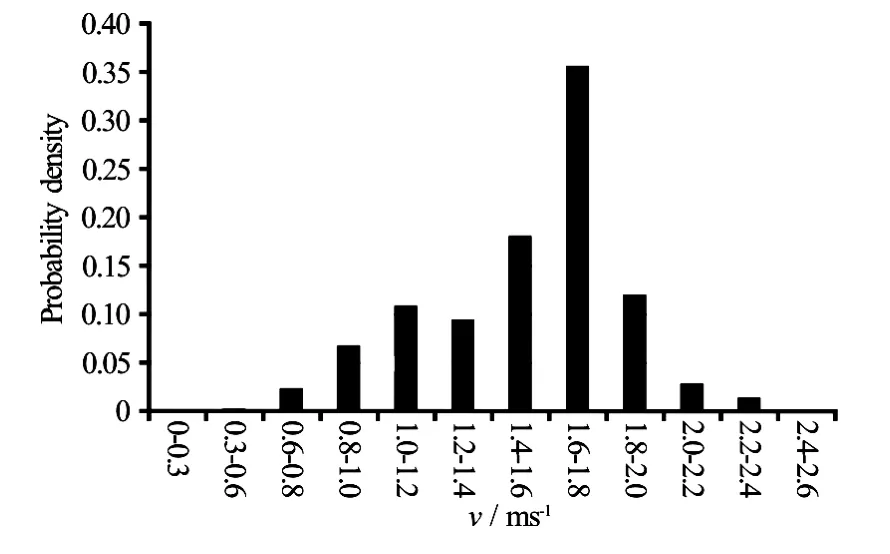
Fig.13 Probability density of current speed
2.3Full scale turbine test results in sea trial
The real sea test of the full scale turbine is carried out in Daishan, China. The distribution of the flow speed in the sea depends on the season and the lunar calendar date. The flow speed is the largest in September of the year; on the first day and the fifteen day of the lunar calendar, when one sees the largest current speed. Figure 12 shows the characteristics ofthe tidal current in 1 d (November 7, 2011). It is obvious that the flood (negative value) or the ebb (positive value) lasts for 6 h and 12 min, and the curve is similar to a sine curve. Figure 13 is the probability distribution of the current speed. In a day, the probability of the current speed in the range of 1.6 m/s-1.8 m/s is 35%, which takes the largest part.
Figure 14 is the test results for the full scale turbine in the real sea. The output power of the generator always varies with the incoming flow speed at any time. Figure 15 is the comparison between the real test results and the design values. It is obvious that the test results are in good agreement with the design values. It is estimated that when the incoming flow speed is 2.3 m/s, the output power is nearly 10 kW, and the power coefficient of the generator is about 36.3%.
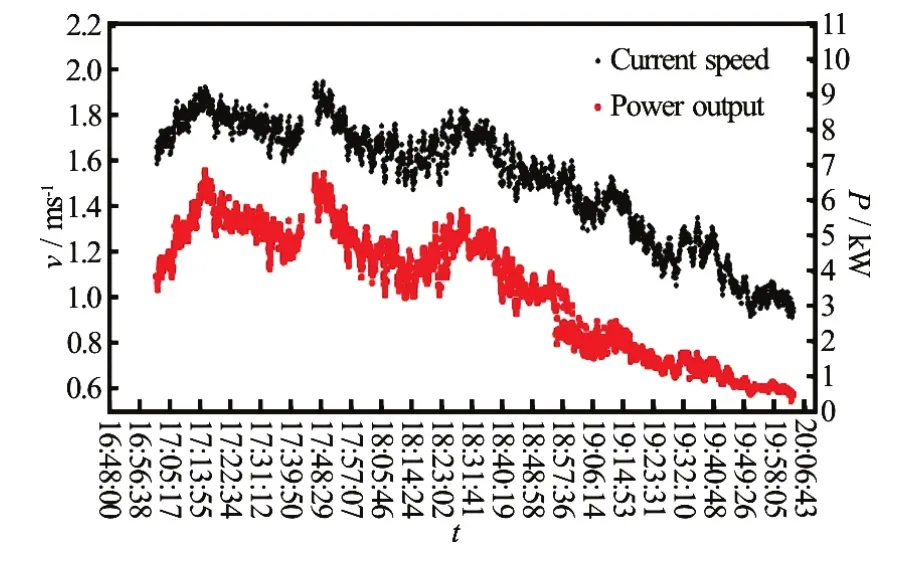
Fig.14 (Color online) Power performance with current speed (October 31)
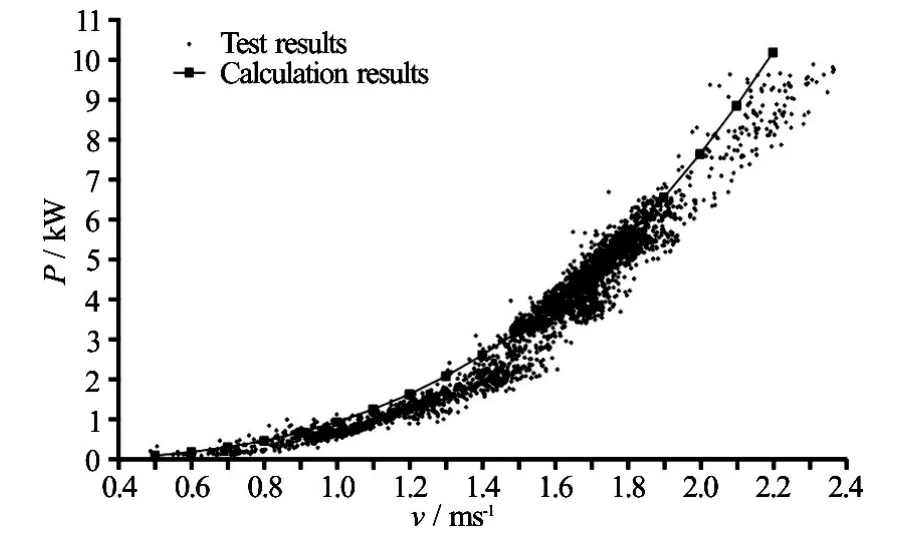
Fig.15 Comparison between test results and calculation results
3. Conclusions
Experiments of the model turbine and the full scale turbine are carried out. The rigs are designed, manufactured and installed successfully for measuring the performance characteristics of the model tidal current turbine in the towing tank and the full scale current turbine in the basin and the real sea, respectively.
The power coefficient is related with the incoming flow speed and the pitch angle of the blade. The maximum power coefficient decreases with the increase of the incoming flow speed, for the designed model turbine, when the pitch angle of the blade is 0o, the power performance is the best.
A comparison between the model turbine and the full scale turbine shows that the power coefficients increase with the increase of the sizes of the turbines. For the designed turbine, the maximum power coefficient of the full scale turbine is larger than that of the model turbine, by about 6%, and the optimal characteristics of the turbine are achieved at a lower speed ratio with the increase of the scale. The results shed some light on the scaling effect for the further research. The comparison between the real sea test results and the design values of the full scale turbine shows that the test results are in good agreement with the design values, so the designed full scale turbine provides a good reference for the further study.
[1] Bahaj A. S., Molland A. F., Chaplin J. R. Power and thrust measurements of marine current turbines under various hydrodynamic flow conditions in a cavitation tunnel and a towing tank [J].Renew Energy, 2007, 32(3): 407-426.
[2] Bahaj A. S., Batten W. M. J., McCann G. Experimental verifications of numerical predictions for the hydrodynamic performance of a horizontal axis marine current turbines [J].Renew Energy, 2007, 32(15): 2479-2490.
[3] Batten W. M. J., Bahaj A. S., Molland A. F. Experimentally validated numerical method for the hydrodynamic design of horizontal axis tidal turbines [J].Ocean Engineering, 2007, 34(7): 1013-1020.
[4] Charles W. F., Roger C. Electrical power generation from ocean currents in the straits of florida: Some environment considerations [J].Renewable and Sustainable Energy Reviews, 2009, 13(9): 2597-2604.
[5] Lust E. E., Luznik L., Flack K. A. et al. The influence of surface gravity waves on marine current turbine performance [J].International Journal of Marine Energy, 2013, 3-4: 27-40.
[6] Jing F., Sheng Q., Zhang L. Experimental research on tidal current vertical axis turbine with variable-pitch blades [J].Ocean Engineering, 2014, 88: 228-241.
[7] Zhang X. W., Wang S. Q., Wang F. et al. The hydrodynamic characteristics of free variable-pitch axis tidal turbine [J].Journal of Hydrodynamics, 2012, 24(6): 834-839.
[8] Batten W. M. J., Bahaj A. S., Molland A. F. et al. The prediction of the hydrodynamic performance of marine current turbines [J].Renewable Energy, 2008, 33(5): 1085-1096.
[9] Batten W. M. J., Bahaj A. S., Molland A. F. et al. Hydrodynamics of marine current turbines [J].Renewable Energy, 2006, 31(2): 249-256.
[10] Wang X. H., Xiao G., Zhang L. Hydrodynamic research for horizontal axis turbine at different rotor preset angles [J].Acta Energiae Solaris Sinca, 2015, 36(5): 1253-1258(in Chinese).
[11] Maganga F., Germain G., King J. et al. Experimental characteristion of flow effects on marine current turbine behaviour and on its wake properties [J].IET Renewable Power Generation, 2010, 4(6): 498-509.
[12] Galloway P. W., Myers L. E., Bahaj A. S. Studies of scale turbine in close proximity to waves [C].3rd InternationalConference on Ocean Energy. Bilbao, Spain, 2010.
[13] Barltrop N., VAryani K., Grant A. et al. Investigation into wave-current interaction in marine current turbine [J].Proceedings of the Institution of Mechanical Engineering, Part A: Journal of Power Energy, 2007, 221(2): 233-242.
[14] Zhang L., Li Y. B. Fluid mechanics [M]. Harbin Engineering University Press, 2001, 179-188(in Chinese).
[15] Liu Y. Z. Theory of ship wave making resistance [M]. National Defence Industy Press, 2003(in Chinese).
[16] Sheng Q. H., Zhao D. Y., Zhang L. A design and numerical simulation of horizontal tidal turbine [J]. Journal of Harbin Engineering University, 2014, 35(4): 389-394(in Chinese).
[17] Bao D., Liu Z. Z., Tian R. Designing on the blades of 1 kW bousehold wind turbine and experimental study on its performance [J].Renewable Energy Resources, 2008, 26(5): 90-95.
[18] Lu H. Experimental study on aerodynamic performance of horizontal axis wind turbine and design [D]. Master Thesis, Nanjing, China: Nanjing University of Aeronutics and Astronautics, 2009(in Chinese).
[19] Li Z. C. Numerical simulation and experimental study on hydrodynamic characteristic of vertical axis tidal turbine [D]. Doctoral Thesis, Harbin, China: Harbin Engineering University, 2012(in Chinese).
[20] Li L. X., Liao H. S., Liu D. et al. Experimental investigation of the optimization of stilling basin with shallow water cushion used for Froude number energy dissipation [J].Journal of Hydrodynamics, 2015, 27(4): 522-529.
* Project supported by the National Natural Science Foundation of China (Grant Nos. 51409057, 51579055 ), the Research Fund for the Doctoral Program of Higher Education of China (Grant No. 20132304110009) and the Natural Science Foundation of Heilongjiang Province (Grant No. E2015048).
Biography:Feng-mei Jing (1982-), Female, Ph. D., Associate Professor
Corresponging author:Wei-jia Ma, E-mail: maweijia@hrbeu.edu.cn
猜你喜欢
中国应急管理科学(2022年2期)2022-05-23
Chinese Physics B(2022年3期)2022-03-12
销售与市场(营销版)(2020年9期)2020-10-22
故事会(2020年13期)2020-07-07
作文评点报·低幼版(2020年9期)2020-04-10
东方剑(2017年6期)2017-11-13
微型小说选刊(2017年8期)2017-04-05
男生女生(金版)(2016年3期)2017-01-17
中国学术期刊文摘(2016年2期)2016-02-13
海峡姐妹(2014年2期)2014-02-27

- 水动力学研究与进展 B辑的其它文章
- Large eddy simulation of free-surface flows*
- Effect of internal sloshing on added resistance of ship*
- Large eddy simulation of turbulent attached cavitating flow with special emphasis on large scale structures of the hydrofoil wake and turbulence-cavitation interactions*
- Assessment of the predictive capability of RANS models in simulating meandering open channel flows*
- The lubrication performance of water lubricated bearing with consideration of wall slip and inertial force*
- Ice accumulation and thickness distribution before inverted siphon*