黄、渤海渔业生物平均营养级的长期变动*
2017-10-17 08:08吴佳颖刘笑笑任一平
中国海洋大学学报(自然科学版) 2017年11期
吴佳颖, 薛 莹**, 刘笑笑, 任一平, 万 荣
(1.中国海洋大学水产学院,山东 青岛 266003; 2.上海海洋大学 上海 201306;3.青岛海洋科学与技术国家实验室,海洋渔业科学与食物产出过程功能实验室,山东 青岛 266071)
黄、渤海渔业生物平均营养级的长期变动*
吴佳颖1, 薛 莹1**, 刘笑笑1, 任一平1, 万 荣2,3
(1.中国海洋大学水产学院,山东 青岛 266003; 2.上海海洋大学 上海 201306;3.青岛海洋科学与技术国家实验室,海洋渔业科学与食物产出过程功能实验室,山东 青岛 266071)
根据中国渔业统计年鉴1956—2014年中国北方三省一市(河北省、辽宁省、山东省和天津市)的捕捞量统计资料,综合分析了黄、渤海海域38种主要渔获种类的平均营养级、渔获量及渔获组成的长期变化情况,并结合FIB指数(Fishing in Balance Index),深入探讨黄、渤海渔业状况的年间变化。研究表明,1956—2014年黄、渤海渔获物平均营养级在3.63~4.46的范围内波动,整体呈下降趋势。大致可分为4个阶段:(1)1956—1969年,平均营养级整体呈下降趋势,在1957年达到历史最高点4.46,1969年下降到3.83;(2)1970—1975年,整体呈上升趋势,在1975年上升到第三个高峰值4.32;(3)1976—1997年,整体呈下降趋势,平均营养级在波动中逐渐下降,1992年达到历史最低点3.63;(4)1998—2014年,整体有小幅度上升,最终稳定在3.83左右。FIB指数整体呈先下降后上升的趋势。1956—1968年,FIB指数经过一个振荡后逐渐下降到最低点-1.57;1969—2006年,FIB指数整体在波动中逐渐上升至最高点1.78;2007—2014年,FIB指数下降后趋于稳定。渔获量的长期变化显示,近几十年间黄、渤海高营养级和中低营养级种类的渔获量均呈上升趋势,但高营养级种类所占比例下降,中低营养级种类所占比例上升。与全球及其它海域相比,黄、渤海渔获物平均营养级的下降幅度和下降速率均高于全球平均水平和葡萄牙海域,但低于南澳大利亚和东海海域。
平均营养级;FIB指数;年间变化;黄、渤海
营养级表示生物在食物链或食物网中的营养位置,它不仅能够反映海洋食物网物种之间的营养关系,还可以作为评价海洋生物多样性和渔业状况动态变化的监测指标,在渔业生态系统研究和管理中发挥着愈加重要的作用[1]。渔获物平均营养级的研究是鱼类摄食生态研究的一项重要内容,平均营养级的变化能够反映出鱼类群落结构的动态变化,对于了解海洋生态系统结构与功能及其变化规律具有重要指示意义[2]。在2004年召开的《生物多样性公约》部长级会议中,将海洋渔获物的平均营养级(也称为海洋营养指数Marine Trophic Index,MTI)确立为能够直接评价生物多样性水平的8个指标之一[3]。
渔获物平均营养级(Mean trophic level,MTL)的概念最初由Pauly等提出[4],他们根据FAO提供的1950—1994年45年间的渔获统计数据,研究了全球渔获物平均营养级的变化情况,发现“Fishing down marine food webs”的现象,即渔获物从长寿命、高营养级的大型种类逐步向短寿命、低营养级的小型中上层渔业生物转变,并建议用渔获物平均营养级评价渔业对海洋生态系统的影响。Pinnegar等[5]应用稳定氮同位素分析的方法,评估了凯尔特海域的渔业捕获量和渔业资源调查数据,证实该海域渔获量和鱼类群落平均营养级均呈下降趋势。Litzow和Urban[6]分析了阿拉斯加州海域112年的数据,发现气候变化与平均营养级和FIB指数之间有很高的相关性,发现了Fishing through现象,即该海域渔获物平均营养级的下降主要是由于低营养级种类捕捞量的增加所致,而高营养级种类的捕捞量保持稳定甚至有所上升。Alleway等[7]通过对南澳大利亚渔业捕捞数据的研究,发现平均营养级的下降不一定是高营养级鱼类的减少,也可能是小型鱼类增加所致。
中国学者对营养级的研究,最初主要关注对重要种类营养级的分析,近年来逐渐开始重视对渔获物平均营养级长期变化的研究。例如:晁敏等[8]分析了1950—1995年东海区渔获物营养级的变化情况,发现东海区海洋捕捞渔获物营养级结构已发生变化。杜建国等[9]利用FAO渔获量资料,分析了1950—2011年中国海域渔获物营养级指数的变化特征,发现过度捕捞导致中国近海主要渔获物种类组成由长寿命、高营养级底层鱼类转变为短寿命、低营养级的无脊椎动物和上层小型鱼类。朱国平[10]利用南极海洋生物资源养护委员会(CCAMLR)提供的数据,结合Fishbase提供的相关鱼种营养级,分析了1970—2009年南大洋有鳍鱼类渔业的平均营养级变动情况,发现渔获物平均渐进体长的变化趋势与平均营养级基本一致。张忠等[11]探讨了1950—2012年东南大西洋渔获量平均营养级的变化情况,发现东南大西洋渔业仍处于未充分开发状态。
近几十年来,由于过度捕捞、气候变化、环境污染、社会需求等多种因素的影响,黄、渤海区的渔获质量和捕捞效益均已明显下降[12]。本文根据1956—2014年的渔获量统计数据,研究了黄、渤海38种渔获物平均营养级和渔获组成的长期变化趋势,并结合FIB指数,深入探讨黄、渤海渔业资源状况的年间变化,旨在促进海洋渔业资源的保护与利用,为海洋渔业的可持续发展提供科学依据。
1 材料与方法
1.1 数据来源
本研究的数据来源于1956—2014年中国渔业统计年鉴提供的中国北方三省一市(辽宁省、河北省、山东省和天津市)的海洋捕捞量统计数据(包括拖网、围网、刺网、张网等主要作业方式)和捕捞努力量数据,由于缺少黄、渤海区相应的渔场和各海域的调查数据,且考虑到数据的连续性和可靠性,所以利用上述三省一市的渔获量统计数据对黄、渤海主要渔获种类进行分析,包括大黄鱼(Larimichthyscrocea)、小黄鱼(Larimichthyspolyactis)、带鱼(Trichiuruslepturus)、马面鲀(Thamnaconussp.)、蓝点马鲛(Scomberomorusniphonius)、鳀鱼(Engraulisjaponicus)、鹰爪虾(Trachysalambriacurvirostris)、口虾蛄(Oratosquillaoratoria)、梭子蟹(Portunussp.)等38种渔业生物。捕捞努力量包括机动渔船功率和非机动渔船功率,非机动渔船功率根据其CPUE和同一年中机动渔船CPUE的比例换算出的[13]。
相关渔获物营养级的确定主要参考中国学者测定的生物营养级数据[14~22]以及“Fishbase”数据库中“黄海营养结构分析”(Trophic Analysis of Yellow Sea)所提供的数据[23]。
1.2 数据分析
1.2.1 平均营养级计算 应用CPUE加权计算渔获物平均营养级[24]:
TLy=∑i(TLi·CPUEiy)/∑iCPUEiy。
(1)
式中:TLy为y年的渔获物平均营养级;TLi为渔获物种类i的营养级;CPUEiy为渔获物种类i在第y年的单位渔船功率的渔获量。
1.2.2 FIB指数计算 Pauly等[25]从生态学角度提出另一个用来评估渔业是否平衡的指数,即渔业均衡指数(Fishing in Balance Index,FIB)。当平均营养级的变化与渔获量的变化相抵消时,FIB指数保持不变;当发生上行效应,例如初级生产力增加或者渔业扩展时,FIB指数增加;当过度捕捞导致生态系统功能受损时,FIB指数下降,渔业资源遭到破坏[26]。其计算公式:
(2)
式中:Yi为i年的总渔获量;TE为转换效率,通常取定值0.1[27];TLi为第i年的渔获物平均营养级;下标“0”代表基准年(本文取1956年),Y0为基准年的总渔获量,TL0为基准年的渔获物平均营养级。
2 结果
2.1 黄、渤海渔获物渔获量的年间变化
黄、渤海主要渔获种类的渔获量从1956年到1976年始终维持在15×104t左右,从1977年开始每年的渔获量逐渐上升,到1998年上升到247×104t,1999—2000年渔获量稍有下降,2000年后又迅速上升,直到2004年达到334×104t,为该海域历史最高渔获量。随后,渔获量又逐渐降低,到2009年下降到223×104t,其后到2014年渔获量稍有上升,在240×104t左右波动(见图1)。
2.2 渔获物平均营养级的年间变化
1956—2014年黄、渤海渔获物平均营养级在3.63~4.46的范围内波动,整体呈下降趋势,大致可分为4个阶段。第一阶段:1956—1969年,平均营养级整体呈下降趋势,在1957年达到历史最高点4.46,经过一个振荡后,由1962年的第二个高峰值4.44急速下降到1969年的3.83;第二阶段:1970—1975年,平均营养级整体呈上升趋势,由1969年的3.83急剧上升到第三个高峰值4.32;第三阶段:1976—1997年,平均营养级整体呈下降趋势,平均营养级在波动中逐渐下降,1992年降到历史最低点3.63;第四阶段:1998—2014年,平均营养级整体有小幅度上升,最终稳定在3.83左右(见图2)。
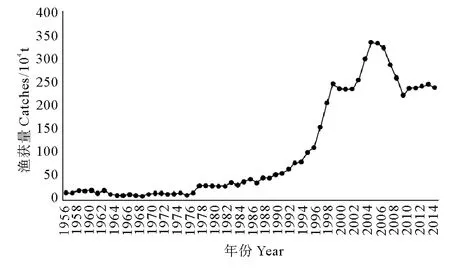
图1 1956—2014年黄、渤海渔获物渔获量的年间变化Fig.1 Fluctuations of catches in the Yellow Sea and Bohai Sea from 1956 to 2014
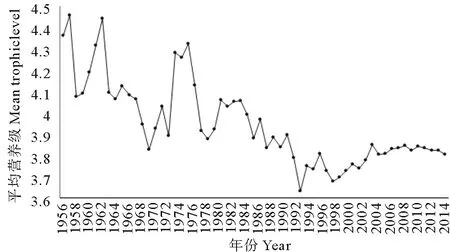
图2 1956—2014年黄、渤海渔获物平均营养级的年间变化Fig.2 Fluctuations of mean trophic level for catches in the Yellow Sea and Bohai Sea from 1956 to 2014
2.3 渔获量与平均营养级的关系
1956—1983年间,黄、渤海渔获物平均营养级和渔获量之间的关系并不明显,此时黄、渤海的渔获量还保持在较低水平;而1984—1997年,随渔获量的急剧增加,平均营养级整体呈下降趋势,到1997年下降到3.68;1998—2003年,平均营养级随渔获量的增加又呈现上升趋势;2004—2014年,平均营养级随渔获量的减少,变化幅度不明显(见图3)。
2.4 各营养级渔获量的年间变化
按营养等级将渔获种类划分为3级,即低营养级种类(TL=2.4~3.4),中营养级种类(TL=3.5~3.9)和高营养级种类(TL=4.0~5.0)[28]。分别统计1956—2014年各营养级的渔获量及其占主要渔获物渔获量的比例。可以看出,自1956年以来,各营养等级的渔获量基本都呈上升趋势(见图4),高营养级种类在主要渔获物渔获量中所占比例呈下降趋势,中营养级种类和低营养级种类在主要渔获物渔获量中所占比例呈上升趋势(见图5)。
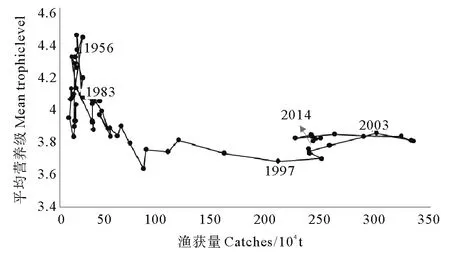
图3 1956—2014年黄、渤海渔获物渔获量与平均营养级的关系Fig.3 Plot of catches and mean trophic level in the Yellow Sea and Bohai Sea from 1956 to 2014

图4 1956—2014年黄、渤海各营养等级渔获物的渔获量Fig.4 The catch of fractionated trophic level in the Yellow Sea and Bohai Sea from 1956 to 2014
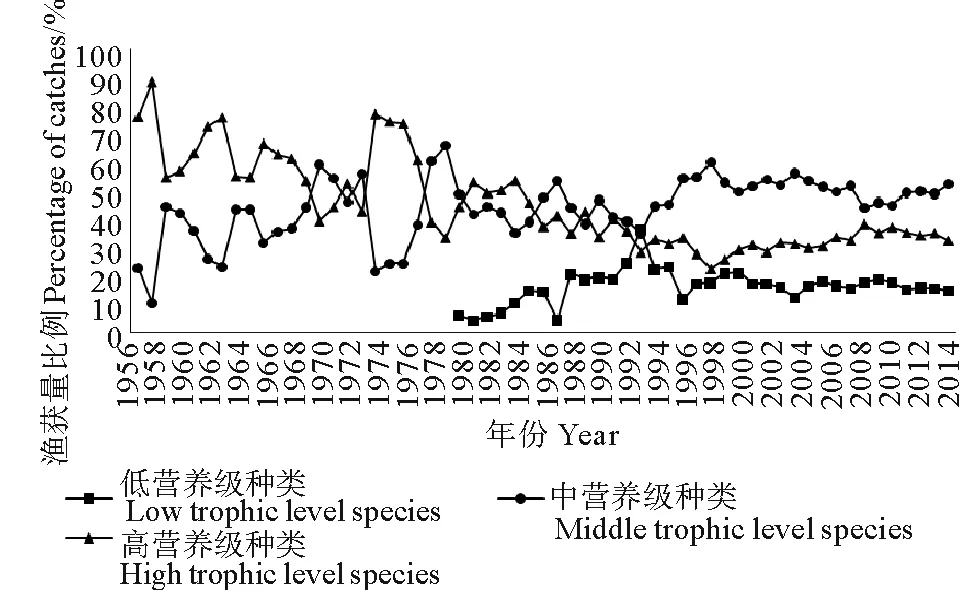
图5 1956—2014年黄、渤海各营养等级渔获量的百分比Fig.5 The proportion of catches of fractionated trophic level in the Yellow Sea and Bohai Sea from 1956 to 2014
2.5 各生物类群渔获量的年间变化
将38种主要渔获物分为5大类,即鱼类、虾类、蟹类、头足类和海蜇,可以看出,各生物类群的渔获量随年份的不同而有所变化。其中,鱼类在主要渔获物中所占比例最高,在45.2%~79.9%之间波动,但在1970年鱼类的比例降至39.8%;其次是虾类,比例在9.1%~46.7%之间波动,在1969—1972年,其比例甚至超过了鱼类,高达50%以上;蟹类从1987年开始作为主要渔获物,比例在2.1%~7.0%之间,变化不大;头足类所占比例在0.2%~11.1%之间波动;海蜇所占比例在0.07%~14.4%之间波动,但在1992年达到26.1%(见图6)。
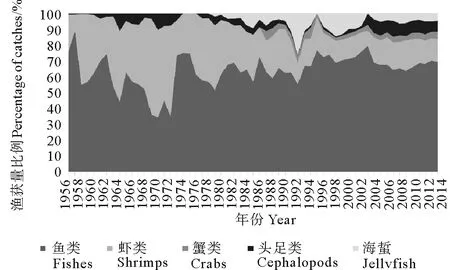
图6 1956—2014年黄、渤海各生物类群渔获量的百分比Fig.6 The proportion of catches of five marine biological groups in the Yellow Sea and Bohai Sea from 1956 to 2014
2.6 FIB指数的年间变化
黄、渤海主要渔获物的FIB指数整体呈先下降后上升再下降的趋势。1956—1968年,FIB指数经过一个振荡后逐渐下降到最低点-1.57;1969—2006年,FIB指数整体在波动中逐渐上升至最高点1.78;2007—2014年,FIB指数小幅度下降后趋于稳定(见图7)。

图7 1956—2014年黄、渤海渔获物FIB指数的年间变化Fig.7 Fluctuations of FIB index for catches in the Yellow Sea and Bohai Sea from 1956 to 2014
3 分析与讨论
3.1 渔获物平均营养级的变化
本研究发现,1956—2014年间黄、渤海渔获物平均营养级整体呈下降趋势,从1956年的4.36下降到2014年的3.80,下降幅度为12.8%,下降速率为每10年下降0.09以上。1956—1969年,黄、渤海渔业开发程度较低,渔获量保持在较低水平,平均营养级波动较大,但整体呈下降趋势。而1970—1975年由于带鱼(TL=4.9)、鲐鱼(Pneumatophorusjaponicus)(TL=4.2)等高营养级渔获种类捕捞量的增加和中国毛虾(Aceteschinensis)(TL=3.5)等中营养级生物捕捞量的下降,渔获物平均营养级迅速增加。1976—1997年,由于小功率船只大量增加,增强对近海的捕捞,使近海捕捞严重过度,传统经济鱼类(如带鱼)产量下降,马面鲀(TL=3.7)、银鲳(Pampusargenteus)(TL=3.6)、鳀鱼(TL=3.6)、远东拟沙丁鱼(Sardinopssagax)(TL=3.0)、海蜇(Rhopilemaesculentum)(TL=2.9)等中低营养级种类渔获量增加,使得渔获物平均营养级逐渐降低。1998—2003年,平均营养级随渔获量的增加有所增加,这是由于1990年代后期,大功率的渔船增多,利用先进的探测捕鱼技术,增强了捕捞能力[29],使得高营养级种类在总渔获量中的比例有所增加,造成平均营养级小幅上升。
2004年以后,黄、渤海渔获物种类基本保持不变,平均营养级保持稳定,但渔获量逐渐下降,2009年降到223×104t,这主要是由于鳀鱼的渔获量大幅度下降所致。1989年开始鳀鱼的捕捞量迅速增加,到1997年鳀鱼渔获量占到总渔获量的49.8%,2003年后鳀鱼的渔获量迅速下降,到2009年只有40×104t,占总渔获量的18.1%。鳀鱼渔获量的迅速下降与捕捞压力过大有关,牛明香等[30]的调查发现,1999年黄海鳀鱼群体的生物量只有1980年代中后期的1/3,在连续几年超过百万吨的捕捞压力下,2003年达到历史最低,中心渔场极不稳定,资源接近崩溃边缘。鳀鱼作为浮游生物摄食者和其它高营养级鱼类的饵料生物,在食物链和食物网中占据重要的地位[31],在黄海约有40余种生物以鳀鱼为食,包括几乎所有的肉食性鱼类和头足类[32]。2009—2014年,由于鳀鱼的渔获量有所上升,总渔获量稍有上升,但变化不大。根据相关渔业统计数据,海蜇在部分年份的产量较高,例如:在1992年,海蜇在本文所分析的渔业生物总产量中所占比例高达26.1%,这可能与渔业资源和外界环境条件的变化有关。有研究表明,渔业资源的衰退会给水母类暴发提供物质和种间竞争方面的条件,导致水母暴发,并给渔业资源带来负面影响[33]。此外,海水富营养化、有害赤潮、外来种入侵等也可能是导致水母类暴发的外界因素[33]。
Essington等[34]发现,渔获物平均营养级呈下降趋势的另一种模式是“Fishing through marine food webs”,即高营养级种类的捕捞量仍处于较高水平,低营养级种类捕捞量的增加是导致渔获物平均营养级下降的主要原因。本研究通过对营养级进行分级,统计各营养级渔获量的变化和渔获组成的变化,发现1956—2004年,黄、渤海主要渔获物中高营养级种类和低营养级种类渔获量均呈上升趋势,高营养级种类的渔获量始终保持在较高水平,但其比例却在下降,中低营养级种类渔获量比例在持续上升,表明黄、渤海渔获物平均营养级呈现出“Fishing through marine food webs”的现象。
3.2 FIB指数的变化
Pauly等[25]的研究发现,FIB指数的变化与渔获量和平均营养级的变化密切相关,当渔获量和平均营养级增加,FIB指数也呈现上升趋势,表明渔业处于开发初期或是开发程度较低;当渔获量增加而平均营养级下降时,FIB指数下降,表明渔业资源受到破坏。本研究发现,1956—1968年,黄、渤海渔获物的FIB指数经过一个振荡后逐渐下降到最低点,1969—1975年,FIB指数逐渐增加,与同时期平均营养级的变化趋势相同,因为当时黄、渤海海域还处于开发初期,捕捞强度有限,作业水平较低,渔获量保持在较低的水平,FIB指数与平均营养级的变化关系密切;1976—2006年FIB指数逐渐上升,这段时间的渔获量增加而平均营养级下降,这说明黄、渤海渔业开发范围和强度正逐渐加大;2007—2014年渔获量逐渐下降后趋于稳定,平均营养级变化不大,FIB指数逐渐下降后趋于稳定。
3.3 与其他海域渔获物平均营养级的比较
1950—2000年,全球渔获物平均营养级由3.42下降到3.31,下降幅度为3.2%,下降速率为每十年下降0.02以上[26]。1951—2010年,南澳大利亚海域渔获物平均营养级平均每十年下降0.16[7]。1970—2006年,葡萄牙大陆海域渔获物平均营养级从3.37下降到3.19,下降幅度为5.3%,下降速率为每十年下降0.05以上[34]。1974—1991年,东海海域渔获物平均营养级从4.4下降到3.8左右,下降幅度为13.6%,下降速率为每十年下降0.33[8]。本研究发现,黄、渤海渔获物平均营养级从1956年的4.36下降到2014年的3.80,下降幅度为12.8%,下降速率为每十年下降0.09以上,下降幅度和下降速率高于全球平均水平,但低于部分其他海域,例如南澳大利亚和东海海域,说明黄、渤海渔业生物平均营养级的下降程度处于中等水平。
据2014年世界粮农组织(FAO)统计报告中的渔业统计信息显示,截止到2011年,有28.8%的海洋渔业已经处于过度捕捞状态,有61.3%的海洋渔业资源处于充分开发状态,只有9.9%的海洋渔业资源处于未充分开发状态[36]。1956年,黄、渤海主要渔获物只有9种,之后逐渐增加到38种,包括鱼类27种,虾类4种,蟹类3种,头足类3种和腔肠动物1种,渔获种类组成发生很大变化,2004年以后,黄、渤海渔获量大幅下降,由334×104t下降到239×104t,下降了近100×104t,这段时期渔获物平均营养级变化不大,但FIB指数有所下降,这可能与黄、渤海渔业过度捕捞导致的生态系统受损和资源衰退有关[24]。
渤海生态系统的关键功能组已由高营养级的游泳动物食性鱼类转变为中等营养级的底栖大型甲壳类,能量传递效率逐渐下降,尚处于不稳定期[37],黄、渤海渔业资源向小型化、低龄化、低质化、低营养级转变[24],高强度的捕捞和环境污染等也使黄海鱼类多样性逐渐降低[38]。由于本研究采用的是黄、渤海38种主要渔获物的数据,并不能反映整个海区的资源状况,但本研究的结果也显示出,虽然渔获产量仍处于较高水平,但黄、渤海主要渔获物的组成和结构已发生很大变化,中低营养级的鱼类和无脊椎动物在主要渔获物中占据更高的比例,渔获质量明显下降。
4 结语
本研究根据中国渔业统计年鉴1956—2014年中国北方三省一市的捕捞量统计资料,综合分析了黄、渤海海域38种主要渔获种类平均营养级的年间变化。研究表明,黄、渤海渔获物的平均营养级在3.63~4.46的范围内波动,整体呈下降趋势,这与黄、渤海低营养级种类渔获量的增加和渔获种类的变化有关。1956—2004年黄、渤海各营养级的渔获量均呈上升趋势,而高营养级种类所占比例下降,中低营养级种类所占比例上升,由于持续增加对中低营养级种类的捕捞量,导致渔获物整体平均营养级的下降,呈现出“Fishing through marine food webs”现象。FIB指数在开发初期保持在较低的水平,1975—2006年当渔获量大量增加平均营养级下降时,FIB指数逐渐上升,说明黄、渤海渔业开发范围和强度正逐渐加大,2007—2014年平均营养级变化不大,而FIB指数随渔获量逐渐下降后趋于稳定。黄、渤海主要渔获物的组成和结构发生较大变化,中低营养级的鱼类和无脊椎动物在渔获物中占据更高的比例,渔获质量明显下降。黄、渤海渔获物平均营养级的下降幅度和下降速率均高于全球平均水平和葡萄牙海域,但略低于南澳大利亚和东海海域。此外,渔获物平均体长的变化[39]、气候变化[6]、市场价格[35]等因素都可能会影响渔获物平均营养级的长期变动,未来需要综合考虑多种因素进行深入探讨。
[1] Pauly D, Palomares M L, Froese R, et al. Fishing down Canadian aquatic food webs[J]. Canadian Journal of Fisheries and Aquatic Sciences, 2001, 58(1): 51-62.
[2] 薛莹, 金显仕. 鱼类食性和食物网研究评述[J]. 海洋水产研究, 2003, 24(2): 76-87. Xue Y, Jin X S. Review of the study on feeding habits of fishes and food webs[J]. Marine Fisheries Research, 2003, 24(2): 76-87.
[3] 纪炜炜, 李圣法, 陈雪忠. 鱼类营养级在海洋生态系统研究中的应用[J]. 中国水产科学, 2010, 17(4): 878-887. Ji W W, Li S F, Chen X Z. Application of fish trophic level in marine ecosystem[J]. Journal of Fishery Sciences of China, 2010, 17(4): 878-887.
[4] Pauly D, Christensen V, Dalsgaard J, et al. Fishing down marine food webs[J]. Science, 1998, 279(5352): 860-863.
[5] Pinnegar J K, Jennings S, O’Brien C M, et al. Long-term changes in the trophic level of the Celtic Sea fish community and fish market price distribution[J]. Journal of Applied Ecology, 2002, 39(3): 377-390.
[6] Litzow M A, Urban D. Fishing through (and up) Alaskan food webs[J]. Canadian Journal of Fisheries & Aquatic Sciences, 2009, 66(2): 201-211.
[7] Alleway H K, Connell S D, Ward T M, et al. Historical changes in mean trophic level of southern Australian fisheries[J]. Marine & Freshwater Research, 2014, 65(10): 884-893.
[8] 晁敏, 全为民, 李纯厚, 等. 东海区海洋捕捞渔获物的营养级变化研究[J]. 海洋科学, 2005, 29(9): 51-55. Chao M, Quan W M, Li C H, et al. Changes in trophic level of marine catches in the East China Sea region[J]. Marine Sciences, 2005, 29(9): 51-55.
[9] 杜建国, 叶观琼, 陈彬, 等. 中国海域海洋生物的营养级指数变化特征[J]. 生物多样性, 2014, 22(4): 532-538. Du J G, Ye G Q, Chen B, et al. Changes in the marine trophic index of Chinese marine area[J]. Biodiversity Science, 2014, 22(4): 532-538.
[10] 朱国平. 南大洋有鳍鱼类渔业平均营养级的长期变动[J]. 生态学杂志, 2014, 33(6): 1573-1579. Zhu G P. Long-term changes in the mean trophic level of the finfish fishery in the Southern Ocean[J]. Chinese Journal of Ecology, 2014, 33(6): 1573-1579.
[11] 张忠, 杨文波, 陈新军, 等. 基于渔获量平均营养级的东南大西洋渔业资源状况分析[J]. 海洋渔业, 2015, 37(3): 197-207. Zhang Z, Yang W B, Chen X J, et al. On fisheries resources in the Southeast Atlantic based on the mean trophic level of catches[J]. Marine Fisheries, 2015, 37(3): 197-207.
[12] 孙中之, 周军, 赵振良, 等. 黄、渤海区捕捞结构的研究[J]. 海洋科学, 2012, 36(6): 44-53. Sun Z Z, Zhou J, Zhao Z L, et al. The fishing structure of the Yellow Sea and Bohai Sea[J]. Marine Sciences, 2012, 36(6): 44-53.
[13] 王跃中, 孙典荣, 林昭进, 等. 捕捞压力和气候因素对黄、渤海带鱼渔获量变化的影响[J]. 中国水产科学, 2012, 19(6): 1043-1050. Wang Y Z, Sun D R, Lin Z J, et al. Analysis on responses of hairtail catches to fishing and climate factors in the Yellow Sea and Bohai Sea, China[J]. Journal of Fishery Sciences of China, 2013, 19(6): 1043-1050.
[14] 杨纪明. 渤海鱼类的食性和营养级研究[J]. 现代渔业信息, 2001, 16(10): 10-19. Yang J M. A study on food and trophic levels of Bohai Sea fish[J]. Modern Fisheries Information, 2001, 16(10): 10-19.
[15] 杨纪明. 渤海无脊椎动物的食性和营养级研究[J]. 现代渔业信息, 2001, 16(9): 8-16. Yang J M. A study on food and trophic levels of Bohai Sea invertebrates[J]. Modern Fidheries Information, 2001, 16(9): 8-16.
[16] 韦晟, 姜卫民. 黄海鱼类食物网的研究[J]. 海洋与湖沼, 1992, 23(2): 182-192. Wei S, Jiang W M. Study on food web of fishes in the Yellow Sea[J]. Oceanologia et Limnologia Sinica, 1992, 23(2): 182-192.
[17] 张月平. 南海北部湾主要鱼类食物网[J]. 中国水产科学, 2005, 12(5): 621-631. Zhang Y P. Foods web for main fishes in Beibu Gulf of the South China Sea[J]. Journal of Fishery Sciences of China, 2005, 12(5): 621-631.
[18] 张波, 唐启升. 渤、黄、东海高营养层次重要生物资源种类的营养级研究[J]. 海洋科学进展, 2004, 22(4): 393-404. Zhang B, Tang Q S. Study on trophic level of important resources species at high trophic levels in the Bohai Sea, Yellow Sea and East China Sea[J]. Advances in Marine Science, 2004, 22(4): 393-404.
[19] 余婕, 刘敏, 侯立军, 等. 崇明东滩大型底栖动物食源的稳定同位素示踪[J]. 自然资源学报, 2008, 23(2): 319-326. Yu J, Liu M, Hou L J, et al. Food sources of Macrofaunal in East Chong Ming Salt Marsh as traced by stable isotopes[J]. Journal of Natural Resources, 2008, 23(2): 319-326.
[20] 朱国平, 周应祺, 许柳雄. 印度洋金枪鱼渔业平均营养级的长期变动[J]. 大连海洋大学学报, 2008, 23(6): 484-488. Zhu G P, Zhou Y Q, Xu L X. Long-term changes in the mean trophic level of tuna fishery in the Indian Ocean[J]. Journal of Dalian Fisheries University, 2008, 23(6): 484-488.
[21] 林群. 黄、渤海典型水域生态系统能量传递与功能研究[D]. 青岛: 中国海洋大学, 2012: 1-127 Lin Q. Studies on the Ecosystem Energy Transfer and Function in the Typical Waters of Yellow and Bohai Sea[D]. Qingdao: Ocean University of China, 2012: 1-127.
[22] 麻秋云, 韩东燕, 刘贺, 等. 应用稳定同位素技术构建胶州湾食物网的连续营养谱[J]. 生态学报, 2015, 35(21): 7207-7218. Ma Q Y, Han D Y, Liu H, et al. Construction of a continuous trophic spectrum for the food web in jiaozhou bay using stable isotope analyses[J]. Acta Ecologica Sinica, 35(21): 7207-7218.
[23] Froese R, Pauly D. FishBase [EB/OL]. (2017-02-11). http: //www. fishbase. org.
[24] 刘勇, 程家骅. 东海、黄海秋季渔业生物群落结构及其平均营养级变化特征初步分析[J]. 水产学报, 2015, 39(5): 691-702. Liu Y, Cheng J H. A preliminary analysis of variation characteristics of structure and average trophic level of the main fishery species caught by paired bottom trawl in the East China Sea and the Yellow Sea during the fall season[J]. Journal of Fisheries of China, 2015, 39(5): 691-702.
[25] Pauly D, Christensen V, Walters C. Ecopath, Ecosim, and Ecospace as tools for evaluating ecosystem impact of fisheries[J]. Ices Journal of Marine Science, 2000, 57(3): 697-706.
[26] Pauly D, Watson R. Background and interpretation of the 'Marine Trophic Index' as a measure of biodiversity[J]. Philosophical Transactions of the Royal Society B Biological Sciences, 2005, 360(1454): 415-423.
[27] Pauly D, Christensen V. Primary production required to sustain global fisheries[J]. Nature, 1995, 374(6537): 255-257.
[28] 张波, 吴强, 金显仕. 1959-2011年莱州湾渔业资源群落食物网结构的变化[J]. 中国水产科学, 2015, 22(2): 278-287. Zhang B, Wu Q, Jin X S. Interannual variation in the food web of commercially harvested species in Laizhou Bay from 1959 to 2011[J]. Journal of Fishery Sciences of China, 2015, 22(2): 278-287.
[29] 张洪温. 中国海洋渔业资源生产能力及其可持续发展对策研究[D]. 中国农业科学院, 2001. Zhang H W. Study on the Productivity of Oceanic Fishery Resources and Countermeasures For Sustainable Development in China[D]. Chinese Academy of Agricultural Sciences, 2001.
[30] 牛明香, 李显森, 赵庚星. 黄海中南部越冬鳀鱼空间分布及其与水温年际变化的关系[J]. 应用生态学报, 2012, 23(2): 552-558. Niu M X, Li X S, Zhao G X. Spatial distribution of winteringEngraulisJaponicusand its relationship with the inter-annual variations of water temperature in central and southern Yellow Sea[J]. Chinese Journal of Applied Ecology, 2012, 23(2): 552-558.
[31] Zhao X, Hamre J, Li F, et al. Recruitment, sustainable yield and possible ecological consequences of the sharp decline of the anchovy (Engraulisjaponicus) stock in the Yellow Sea in the 1990s[J]. Fisheries Oceanography, 2003, 12(4-5): 495-501.
[32] Tang, Q. Effects of long-term physical and biological perturbations on the contemporary biomass yields of the Yellow Sea ecosystem. [C]//Sherman K. Large Marine Ecosystems: Stress, Mitigation, and Sustainability. Washington, DC: AAAS Press, 1993: 79-93.
[33] 孙松. 水母暴发研究所面临的挑战[J]. 地球科学进展, 2012, 27(3): 257-261. Sun Song. Challenges in the jellyfish bloom research[J]. Advances in Earth Science, 2012, 27(3): 257-261.
[34] Essington T E, Beaudreau A H, Wiedenmann J. Fishing through marine food webs[J]. Proceedings of the National Academy of Sciences of the United States of America, 2006, 103(9): 3171-3175.
[35] Baeta F, Costa M J, Cabral H. Changes in the trophic level of Portuguese landings and fish market price variation in the last decades[J]. Fisheries Research, 2009, 97(3): 216-222.
[36] FAO. The state of world fisheries and aquaculture: Opportunities and challenges[J]. State of World Fisheries & Aquaculture, 2014, 4(78): 40-41.
[37] 许思思, 宋金明, 李学刚, 等. 渔业捕捞对渤海渔业资源及生态系统影响的模型研究[J]. 资源科学, 2011, 33(6): 1153-1162. Xu S S, Song J M, Li Xue Gang, et al. Modeling of fishing effects on fishery resources and ecosystems of the Bohai Sea[J]. Resources Science, 2011, 33(6): 1153-1162.
[38] 单秀娟, 陈云龙, 戴芳群, 等. 黄海中南部不同断面鱼类群落结构及其多样性[J]. 生态学报, 2014, 34(2): 377-389. Shan X J, Chen Y L, Dai F Q, et al. Variations in fish community structure and diversity in the sections of the central and southern Yellow Sea[J]. Acta Ecologica Sinica, 2014, 34(2): 377-389.
[39] Jennings S, Greenstreet S, Hill L, et al. Long-term trends in the trophic structure of the North Sea fish community: Evidence from stable-isotope analysis, size-spectra and community metrics[J]. Marine Biology, 2002, 141(6): 1085-1097.
Abstract: Fluctuations in the mean trophic level for marine catches can reflect dynamic variation in fish community structure, which are important for understanding of marine ecosystem structure and variations. According to statistical data from the Chinese Fisheries Statistics Yearbook during 1956-2014, we analyzed long-term trends in the mean trophic level (MTL), marine catches and catch compositions for 38 major marine species in the Yellow Sea and Bohai Sea, and also calculated the Fishing in Balance Index (FIB) to examine the interannual variations of fishery resources in the Yellow Sea and Bohai Sea. Results showed that the MTL of catches in the Yellow Sea and Bohai Sea fluctuated between 3.63 and 4.46 during 1956-2014, and showed a downward trend. The long-term trends in MTL of catches could be divided into four stages: (1) From 1956 to 1969, MTL showed a declined trend, which reached the maximum value of 4.46 in 1957 and then decreased to 3.83 in 1969; (2) From 1970 to 1975, MTL showed a rising trend and reached the third maximum value of 4.32 in 1975; (3) From 1976 to 1997, MTL showed a declined trend, which decreased slowly to the minimum value in 1992; (4) From 1998 to 2014, MTL increased a little and then remained at about 3.83. The FIB index decreased firstly and then increased. From 1956 to 1968, the FIB index decreased to the minimum value of -1.57 through a sharp fluctuation because the exploitation of the Yellow Sea and Bohai Sea was still in the early stage. From 1969 to 2006, the FIB index increased gradually and then reached the maximum value of 1.78, because the scope and strength of exploitation in the Yellow Sea and Bohai Sea was increasing. From 2007 to 2014, the FIB index decreased and then remained stable, which might be related to the impairment of the ecosystem in the Yellow Sea and Bohai Sea. Long-term variations of marine fisheries suggested that catches of high trophic level species, middle trophic level species and low trophic level species were both increasing in the Yellow Sea and Bohai Sea during recent decades. However, the proportion of high trophic level species went down and the proportion of middle trophic level species and low trophic level species increased, which indicated that MTL of catches in the Yellow Sea and Bohai Sea showed a “Fishing through marine food webs” phenomenon. This meant that although the marine catches were still at a high level, the proportion of fishes in medium and lower trophic level and invertebrates increased a lot so the quality of catches deteriorated. Compared with other areas, the extent and rate of declining of MTL in the Yellow Sea and Bohai Sea exceeded the Portuguese Sea and the global average level, but were inferior to that in the South Australian Sea and the East China Sea. Moreover, changes in mean body size, climate and market price can also have an influence on long term variations in the mean trophic level, so more factors should be considered in the future. In conclusion, the marine catches have exceeded what it can afford in the Yellow Sea and Bohai Sea, so we should strengthen the management and protect of fishery resources in order to promote the sustainable development of fishery in the Yellow Sea and Bohai Sea.
Key words: mean trophic level; FIB index; annual changes; Yellow Sea and Bohai Sea
责任编辑 高 蓓
Long-Term Trends in the Mean Trophic Level of Marine Fisheries in the Yellow Sea and Bohai Sea
WU Jia-Ying1, XUE Ying1, LIU Xiao-Xiao1, REN Yi-Ping1, WAN Rong1,2
(1. College of Fisheries, Ocean University of China, Qingdao 266003, China; 2. Shanghai Ocean University, Shanghai, 201306, China; 3. Laboratory for Marine Fisheries Science and Food Production Processes, Qingdao National Laboratory for Marine Science and Technology, Qingdao 266071, China)
S931.1
A
1672-5174(2017)11-053-08
10.16441/j.cnki.hdxb.20170070
吴佳颖, 薛莹, 刘笑笑, 等. 黄、渤海渔业生物平均营养级的长期变动[J]. 中国海洋大学学报(自然科学版), 2017, 47(11): 53-60.
WU Jia-Ying, XUE Ying, LIU Xiao-Xiao, et al. Long-term trends in the mean trophic level of marine fisheries in the Yellow Sea and Bohai Sea[J]. Periodical of Ocean University of China, 2017, 47(11): 53-60.
青岛海洋科学与技术国家实验室鳌山科技创新计划项目(2015ASKJ01);中央高校基本科研业务费专项资金项目(201262004;201562030);国家留学基金项目(201506335007)资助 Supported by the Scientific and Technological Innoration Project Financially Supported by Qingdao National Laboratory for Marine Science and Technology(2015ASKJ01);The Fundamental Research Funds for the Central Universities (201262004;201562030);The State Scholarship Fund by the China Scholoarship Council(201506335007)
2017-03-13;
2017-04-21
吴佳颖(1995-),女,硕士生。E-mail:449231128@qq.com
** 通讯作者:E-mail: xueying@ouc.edu.cn
猜你喜欢
声屏世界(2022年17期)2022-12-18
中国检察官(2022年20期)2022-11-07
中国水产(2021年6期)2021-07-01
水上消防(2020年3期)2020-07-25
科技进步与对策(2020年9期)2020-05-28
农家之友(2020年9期)2020-04-21
智富时代(2019年8期)2019-09-23
智富时代(2019年8期)2019-09-23
小天使·一年级语数英综合(2019年8期)2019-08-27
浙江海洋大学学报(自然科学版)(2019年5期)2019-03-21