
Understanding the metabolism of Mycoplasma mycoides subsp.capriin vitro by a transcriptomic analysis
2018-02-05 07:10WANGXiaohuiWANGYanfangHUANGHaibiBAlFanSHlXiaonaMAChangjiaoGAOYuanZHANGJianhuaZHANGWenguangHAOYongqing
WANG Xiao-hui, WANG Yan-fang, HUANG Hai-bi BAl Fan SHl Xiao-na MA Chang-jiao GAO Yuan ZHANG Jian-hua ZHANG Wen-guang, HAO Yong-qing
1 Key Laboratory of Microbiology & Immunology, College of Veterinary Medicine, Inner Mongolia Agricultural University, Hohhot 010018, P.R.China
2 Foundation Medicine College, Baotou Medical School, Baotou 014040, P.R.China
3 Key Laboratory of Animal Genetics and Genomics, Inner Mongolia Agricultural University, Hohhot 010018, P.R.China
1. lntroduction
Mycoplasma mycoidessubsp.capri(Mmc) mainly causes“MAKePS” (Mastitis, Arthritis, Keratoconjunctivitis,Pneumonia, Septicemia) in goats (Coronaet al. 2013),which threatens a great number of goat populations throughout the world and causes considerable economic losses in goat production (Xuet al. 2014).
Mycoplasma is the smallest and simplest self-replicating bacteria (Razinet al. 1998). Due to the limited genome size,a variety of nutrients are needed in its culture medium, and the culture for mycoplasma is time-consuming, including Mmc. This limits the conventional identification methods such as bacterial culture, growth inhibition test, growth precipitation test, agglutination test, and antigen preparation,since bacterial culture is considered to be a “gold standard”for detecting pathogen, and the use of vaccines is an effective approach for preventing and controlling the disease. Furthermore, there are few effective quarantine measures, inactivated vaccines and attenuated vaccines for these diseases up to now.
Due to the reduced genome, the metabolic network of mycoplasma has been shown to be simple and linear in comparison with more complex organisms such asEscherichia coli(Yuset al. 2009; Maieret al. 2013; Wodkeet al. 2013). There is no meaning to compare mycoplasma withE.coli. In addition, little research about Mmc metabolism in its life cycle was reported. Therefore, the identification of enzymes, which the differently expressed genes coded, involved in metabolism during its life cycle of Mmc, will be novel.
RNA sequencing (RNA-seq) technology has been proven to be a powerful tool for transcriptome analysis. It can accurately quantify transcripts with low expression levels(Croucher and Thomson 2010; Sorek and Cossart 2010). Up until now, the transcriptomes of few species of mycoplasma were investigated by high-throughput technology, but information on transcriptome of Mmc metabolism is scarce.RNA-seq studies provide the opportunities to identify numerous enzymes which were important for Mmc growth.In the meanwhile, comparisons between growth stages of Mmc at different culture times will provide a dynamic gene expression for in-depth understanding of its metabolism regulation.
In this study, RNA-seq was performed to characterize the genes linked to metabolism of Mmc during four different growth stages. Based on sequencing, about 2 GB of high-quality sequence data were obtained. The data were annotated and functionally classified by Kyoto Encyclopedia of Genes and Genomes (KEGG) pathway. We identified a number of genes encoding enzymes involved in Mmc metabolism. This study of Mmc contributes to uncovering the regulation of genes related to metabolism during its life cycle, and may serve as a valuable basis to solve the problem that why mycoplasma is difficult and timeconsuming to culture in the future.
2. Materials and methods
2.1. Strain and culture
The Mmc strain PG3 that was used in our laboratory was isolated from Turkey. It was obtained from the China Veterinary Microbial Culture Collection (CVCC). Strain PG3 was resuscitated and cultured in a modified Hayflick’s broth (1.0 g L–1glucose, 21.0 g L–1PPLO, 0.4 g L–1sodium pyruvate, 10 mL 25% (w/v) yeast extract, 200 mL donor equine serum (Hyclone; Logan, UT, USA), 10 mL 10 000 IU mL–1penicillin-G, and 2.5 mL 0.4% (w/v) phenol red, pH 7.6–7.8 adjusted with 0.1 mol L–1sodium hydroxide) at 37°C,in a 5% CO2atmosphere. Solid medium was prepared by adding 1% (w/v) agar to the modified Hayflick’s broth.
2.2. Determination the growth curve of PG3
The experiments were performed by colony-forming unit(CFU) method. To initiate experiments, 200 μL of PG3 suspension (1.3×10⁶CFU mL–1) was inoculated into 1.8 mL of medium and cultured for 90 h, we used a 6-h collection interval. In this way, bacterial suspensions were 10-fold diluted up to 10–12. For each dilution, 0.1 mL of bacterial suspension was seeded in solid medium and cultured at 37°C for 5 days. At the end of the incubation, the number of colonies was counted using a microscope. All cultures were performed three times and the colony counts were carried out in duplicate for each dilution. The growth curve of Mmc PG3 strain was drawn by plotting the logarithm of the number of colony counts for each dilution on theY-axis and the sampling times on theX-axis.
2.3. RNA isolation, library construction, and sequencing
For RNA isolation, the cells were harvested during the logarithmic phase (PG3-1), stationary phase (PG3-2),decline phase (PG3-3), and late decline phase (PG3-4)after an incubation time of 18, 35, 58, and 83 h, respectively.All cultures were carried out three times. The harvested cells were stored at−80°C (for no longer than 24 h) prior to RNA isolation.
The total RNA of the above samples was isolated using the RNAprep Pure Cell/Bacteria Kit (Tiangen, Beijing, China)following the manufacturer’s instructions. RNA quality was checked using RNase-free agarose gel electrophoresis and determined with a Bioanalyzer 2100 (Agilent, Palo Alto, USA). The concentration of total RNA was measured using a ND1000 spectrophotometer (Thermo Scientific,Massachusetts, US) at 260 and 280 nm. Then, samples were sent to LC Bio. Tech. (Hangzhou, China) for further processing.
Total RNA samples (10 μg) were subjected to further purification with the Ribo-Zero Magnetic Kit (Illumina,San Diego, US) that enriched mRNA and removed rRNA.Following purification, the fraction was fragmented into small pieces using TruseqTMRNA Sample Prep Kit (Illumina, San Diego, US). Strand-specific libraries were prepared using a dUTP second-strand marking protocol with reagents from Invitrogen (Massachusetts, US). The first-strand cDNA was synthesized from 400 ng of precipitated fragmented RNA using 3 μg of random primers, 4 μg of actinomycin D and Superscript III reverse transcriptase (Thermo Scientific,Massachusetts, US). After the extraction and precipitation of the first strand, the second-strand cDNA was synthesized using dUTP rather than dTTP, as previously described.Paired-end sequencing (2×150 bp) was performed on the Illumina HiSeq-2000 Platform (Illumina, San Diego, US).After the raw reads were generated, low-quality reads(reads containing sequencing adaptors; reads containing sequencing primers; nucleotides with a Q score lower than 20) were trimmed to obtain high-quality sequencing data(clean data) to ensure that subsequent analysis is carried out smoothly.
2.4. Differential expression analysis
According to the comparison method developed by the Beijing Genomics Institute (BGI, China), the probability of one gene being expressed equally between two samples was judged according to theP-value corresponding to the differential gene expression test and false discovery rate (FDR) (Audic and Claverie 1997; Benjamini and Yekutieli 2001; Liet al. 2014). A FDR of 0.5% or less and a fold change ≥2 were set as the threshold for significant differential expression. Differentially expressed genes(DEGs) were identified as enriched in metabolic pathways(P<0.01) by searching against KEGG pathway database(Kanehisaet al. 2006, 2008; Sunet al. 2014).
2.5. Validation of RNA-seq analysis via RT-PCR
To validate genes that were differentially expressed, an independent experiment was conducted using real-time PCR (RT-PCR). Total RNA was used to synthesize cDNA using the PrimeScript™ RT Reagent Kit (TaKaRa, Dalian,China) according to the manufacturer’s instructions. Primers that are designed for each gene are given in Table 1. Primer specificity was determined using the melting curve analysis and agarose gel electrophoresis of PCR products. RT-PCR was performed using an Applied Biosystems 7500 with SYBR®PremixEx Taq™ (Tli RNaseH plus) and ROX plus(TaKaRa, Dalian, China) according to the manufacturer’s protocol. The PCR cycles were as follows: 1 cycle of 30 s at 95°C, followed by 40 cycles at 95°C for 5 s, 54°C for 30 s,and 72°C for 34 s. After amplification, fluorescent data were converted to threshold cycle (Ct) values for analysis.GAPDH (glyceraldehyde-3-phosphate dehydrogenase) was used as the internal reference gene.
3. Results
3.1. Growth curve of PG3
The growth curve of PG3 showed that there was an obvious logarithmic phase from 12 to 24 h. At 24 h the stationary phase was reached. During this period, the number of PG3 mycoplasma colonies did not fluctuate significantly,maintaining a titer of about 1×10¹⁰CFU mL–1. From 54 h,PG3 cultures entered the decline stage. After 84 h, cell number was less than 1×10⁶CFU mL–1(Fig. 1). Selection of sampling time was based on the growth curve of PG3,usually midpoint of each growing stage, like logarithmic phase and stationary phase, can be considered as sampling time. The decline phase of Mmc was extended with a fast drop of the culture titer between 54–66 h followed by a slower decline from 66–90 h. Thus for this phase, we chose two sampling times, one at 58 h and the second at 83 h.
3.2. Summary of RNA-seq data
To obtain a global view of the PG3 transcriptome, 12 mRNAs samples representative of the four growth stages (PG3-1,PG3-2, PG3-3 and PG3-4) of PG3 were harvested and subjected to high-throughput Illumina sequencing. Afterfiltering out low quality reads and primer contamination,the number of properly paired reads among the 12 samples was between 13.7 and 37.7 million. A high proportion of the properly paired reads was mapped back onto the reference genome (M. mycoidessubsp.capriPG3, GenBank:ANIV00000000.1) (Table 2).
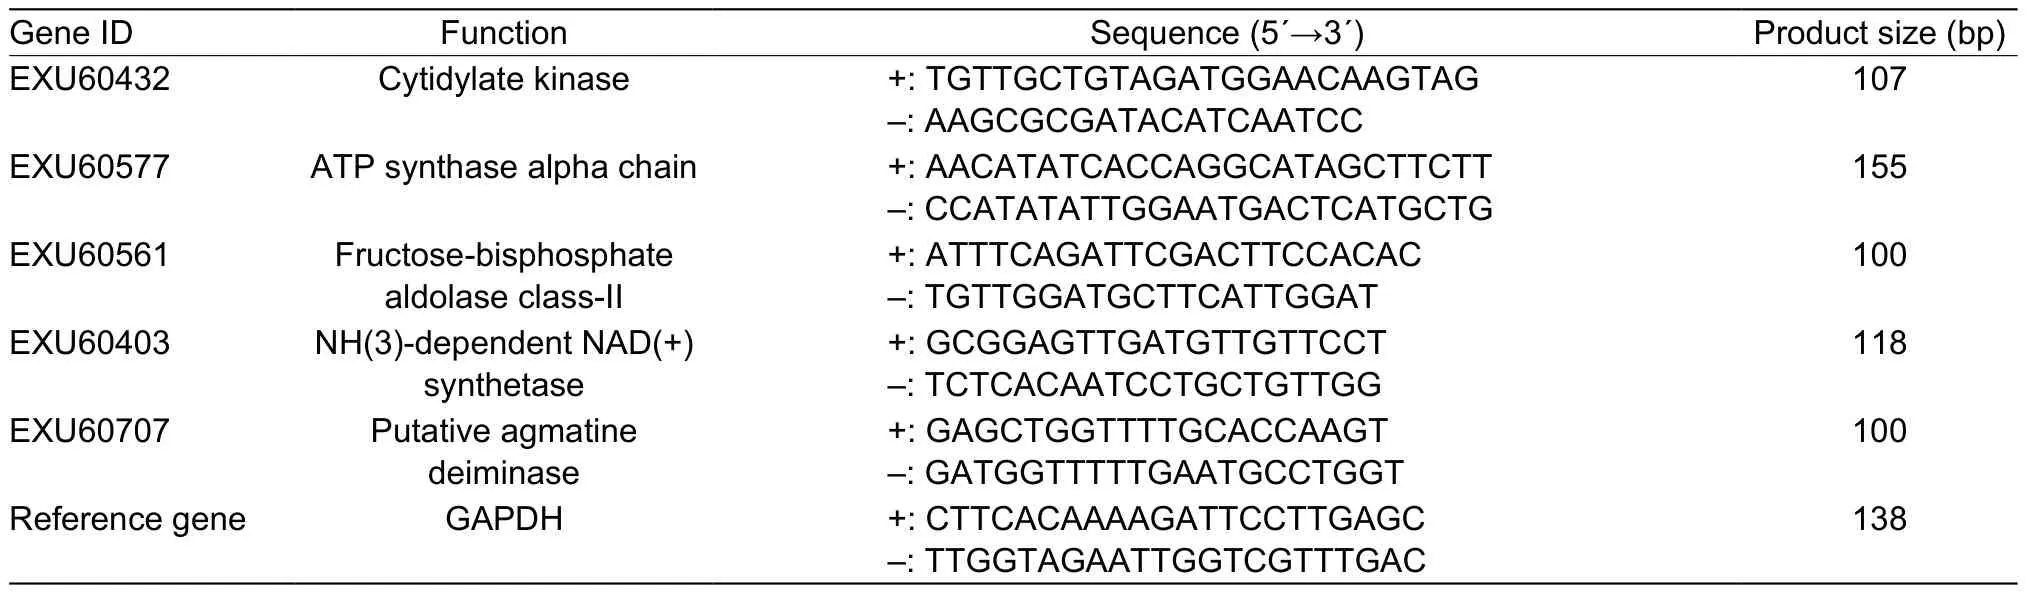
Table 1 Primers for real-time PCR (RT-PCR)
The RNA-seq analysis between the neighboring groups in the four growth phases revealed 337 DEGs. Among the 337 DEGs, 151 genes were up-regulated (37, 63 and 51)and 186 genes were down-regulated (56, 58 and 72). The distribution of these DEGs in the three comparison groups is shown below (Fig. 2). Overall, the number of downregulated genes was higher than the up-regulated genes.
Fig. 1 Growth curve and sampling time for RNA sequencing (RNA-seq) of Mycoplasma mycoides subsp. capri (Mmc) strain PG3.
3.3. Metabolism characteristics of PG3
Differentially expressed genes (337) were subjected to the KEGG functional enrichment analysis. Forty-five DGEs were mapped to the metabolic pathways in PG3-1, PG3-2,PG3-3 and PG3-4 (Fig. 3; Appendix A).
Among these, 32 genes were differentially expressed in PG3-1vs. PG3-2, when the cells were cultured for 18 h compared with 35 h. Most genes were down-regulated (20 out of 32 genes). When the cells were cultured for 58 h,14 genes were differentially expressed compared with the cells that were cultured for 35 h (PG3-2vs. PG3-3). Again,a significant majority of genes was down-regulated (9 out of 14). Lastly, compared with the cells that were cultured for 58 h, 19 genes were differentially expressed at the stage of the cells that were cultured for 83 h (PG3-3vs. PG3-4).Approximately half of them were down-regulated (9 out of 19 genes) (Fig. 4).
The overlap in the metabolism-regulated expression patterns between the four growth stages was low (Fig. 5;Table 3). Eight DEGs are the core genes of PG3-1vs.PG3-2vs. PG3-3vs. PG3-4.DnaE(EXU60616),holB(EXU60063), andpolA(EXU60617) are involved in purina metabolism.GltX(EXU60218) is linked to aminoacyl-tRNA biosynthesis.Pgi(EXU60445) encoded a member of the glucose phosphate isomerase protein family.
Only one gene (pncB, EXU60614) was differentially expressed in the PG3-1vs. PG3-2vs. PG3-3. This gene encodes nicotinic acid phosphoribosyl transferase(NAPRTase, EC 6.3.4.21), which is a rate-limiting enzyme in the synthesis of NAD(H). It was up-regulated during PG3-2 and down-regulated during PG3-3. The up-regulation of NAPRTase increases biomass and the consumption rate of xylose (Jianget al. 2014). This enzyme exists during the early PG3 growth stage.
Fig. 2 Number of differentially expressed genes in each comparative group (FDR≤0.5 and FC≥2). FDR, false discovery rate; FC, fold change. PG3, Mycoplasma mycoides subsp. capri(Mmc) strain. PG3-1–PG3-4, logarithmic, stationary, decline and late decline phases, respectively.
Three genes were differentially expressed in the PG3-2vs. PG3-3vs. PG3-4.Dpck(EXU60177) is involved in the pantothenate and CoA biosyntheses.PlsX(EXU60469)belongs to the glycerolipid metabolism. Interestingly,manB(EXU60743) that was encoded phosphomannomutase(EC 5.4.2.8) is a bifunctional protein (Huanget al. 2013).It is connected with the amino sugar and nucleotide sugar metabolism, glycolysis, microbial metabolism in diverse environments, galactose metabolism, pentose phosphate pathway, starch and sucrose metabolism. It was downregulated during PG3-3 and up-regulated during PG3-4.
There are 23 differentially expressed genes in PG3-1vs.PG3-2. Seven genes (EXU60577, EXU60578, EXU60767,EXU60768, EXU60769, EXU60770, and EXU60773) that encode ATP synthase (EC 3.6.3.14) belong to oxidative phosphorylation and ABC transporters. Only theatpC(EXU60773) was up-regulated.FbaA(EXU60212) was linked to fructose-bisphosphate aldolase Class II (FBA,EC 4.1.2.13), down-regulated.
One differentially expressed genes was up-regulated,and one differentially expressed gene was down-regulated in PG3-2vs. PG3-3. These two genes,nadE(EXU60403)andRibC(EXU60170), encode NH(3)-dependent NAD(+)synthetase (EC 6.3.1.5) and riboflavin kinase/FAD synthetase and are connected with nicotinate and nicotinamide metabolism, riboflavin metabolism.
Eight genes were differentially expressed in PG3-3vs. PG3-4. Most were down-regulated (5 out of 8).DeoA(EXU60742) encode thymidine phosphorylase that is linked to pyrimidine metabolism. Further,6-phosphofructokinase (EXU60319, EC 2.7.1.11) is involved in carbon metabolism, fructose and mannose metabolism,glycolysis/gluconeogenesis, galactose metabolism,methane metabolism, and the pentose phosphate pathway.Two genes,aguA(EXU60707) andarcB(EXU60776), are related to arginine and proline metabolism.
Fig. 3 Heat map of 45 differentially expressed genes (DEGs).DEGs were chosen based on the RPKM (reads per kilobase per million mapped reads) value. Form blue to red, the RPKM value is higher and higher. Gray means not significantly expressed.

Fig. 4 Number of differentially expressed genes between the neighboring groups in the four growth phases (PG3-1–PG3-4 mean logarithmic, stationary, decline and late decline phases,respectively) of Mycoplasma mycoides subsp. capri (Mmc)strain PG3 metabolism.
3.4. Validation of RNA-seq analysis via RT-PCR
To validate the RNA-seq results, an independent experiment was performed to confirm gene transcriptionviaRT/q-PCR.RNA samples were isolated, as previously described,reverse-transcribed, and analyzed. Five genes were randomly chosen from each comparable group, and the results were consistent with the RNA-seq data (Fig. 6).
Table 2 Output statistics of sequencing analysis of the Mycoplasma mycoides subsp. capri (Mmc) strain PG3 transcriptome1)
Table 3 Differentially expressed genes in the Mycoplasma mycoides subsp. capri (Mmc) strain PG3 metabolism between the four growth stages

Fig. 5 Venn diagram showing the number of differentially expressed genes linked to the Mycoplasma mycoides subsp.capri (Mmc) strain PG3 metabolism. PG3-1–PG3-4, logarithmic,stationary, decline and late decline phases, respectively.
4. Discussion
Mycoplasmas have a limited genome size. Thus, they require a large array of precursors and high concentrations of serum and energy sources. Mycoplasma media contain peptone, beef heart infusion, DNA and/or aqueous yeast extract, animal serum, and sodium chloride. Even in such complex media, mycoplasma growth rates and yields are typically low, and broth cultures of many mollicutes do not reach visible turbidity. Therefore, the research on metabolic characteristics of mycoplasmas is in significant demand.
Fig. 6 Validation results of the RNA sequencing (RNA-seq)analysis via RT-PCR. PG3, Mycoplasma mycoides subsp. capri(Mmc) strain. PG3-1–PG3-4, logarithmic, stationary, decline and late decline phases, respectively.
In pyrimidine metabolism, Pachkovaet al. (2007) showed that cytidine is the precursor for the production of all pyrimidine nucleotides inMycoplasma pneumoniaeand also inM. mycoidessubsp.mycoides. In general, 2 out of 4 routes for RNA synthesis are cytidine→CMP→CDP→CTP→RNA and uridine→UMP→UDP→UTP→RNA. In our study,cytidylate kinase, which catalyzes the CMP→CDP and UMP→UDP syntheses, was down-regulated in PG3 when the cells were cultured for 35 h. Meanwhile, cytidylate kinase catalyzes the dCMP→dCDP synthesis. Further, the down-regulated enzyme indirectly inhibits the synthesis of RNA and DNA and is detrimental to the cell growth.Moreover, these pathways are essential for the synthesis of RNA and DNA.
In glycolysis/gluconeogenesis, fructose 1,6-bisphosphate aldolases Class II (FBA) was down-regulated in PG3 that was cultured for 35 h compared with 18 h. FBA catalyzes the synthesis of β-D-fructose-1,6-diphosphate from β-D-fructose-6-phosphate as well as the glycerone-phosphate synthesis.These are reversible reactions, and FBAs are critical for supplying downstream metabolic enzymes. Moreover, the substrates and products that Class II FBAs supply are crucial for the survival of any organism (Peganet al. 2013).
In the nicotinate and nicotinamide metabolism, putative nicotinate-nucleotide adenylyltransferase catalyzes the reversible synthesis of nicotinamide D-ribonucleotide from nicotinamide adenine dinucleotide NAD(+). NH(3)-dependent NAD(+) synthetase catalyzes the irreversible synthesis of deamino-NAD(+). The up-regulation of these 2 enzymes promotes the generation of NAD.
Dihydrolipoamide dehydrogenase (EC 1.8.1.4) is an oxidoreductase that acts on sulfur groups in donors, with NAD(+) or NADP(+) as acceptors. This enzyme is central in the pyruvate metabolism and produces acetyl-CoA,which is necessary for many other pathways including the metabolism of fatty acids.
The enzymes that are involved in different metabolic growth stages of PG3 are rarely reported. This study has a significant reference value because it provides a theoretical basis for the Mmc medium optimization. For example,addition of the enzymes whose genes are not/low expressed but critical for Mmc metabolism in culture media.
5. Conclusion
This is the comprehensive transcriptomic study on Mmc by applying high-throughput sequencing technology. The present transcriptome data provide valuable resources for the discovery of novel genes and put up a platform for further studying and understanding of the Mmc metabolism.It identified four crucial enzymes for Mmc metabolism,included cytidylate kinase, fructose 1,6-bisphosphate aldolases Class II, nicotinate-nucleotide adenylyltransferase and dihydrolipoamide dehydrogenase. The results will serve as a reference for the better understanding of mycoplasma metabolic pathways at RNA level. This paper aimed at optimizing current mycoplasma culture media, increasing diagnostic sensitivity of isolation methods or shortening the growing time of mycoplasmas.
Acknowledgements
This work was supported by the Science and Technology Project of Inner Mongolia, China (201502070). The authors thank Prof. Hao Yongqing (College of Veterinary Medicine, Inner Mongolia Agricultural University, China)for the valuable comments, and Prof. Zhang Wenguang(Key Laboratory of Animal Genetics and Genomics, Inner Mongolia Agricultural University) for the assistance with data processing and bioinformatic analysis.
Appendixassociated with this paper can be available on http://www.ChinaAgriSci.com/V2/En/appendix.htm
Audic S, Claverie J M. 1997. The significance of digital gene expression profiles.Genome Research, 7, 986–995.
Benjamini Y, Yekutieli D. 2001. The control of the false discovery rate in multiple testing under dependency.Annals of Statistics, 29, 1165–1188.
Corona L, Cillara G, Tola S. 2013. Proteomic approach for identification of immunogenic proteins ofMycoplasma mycoidessubsp.capri.Veterinary Microbiology, 167,434–439.
Croucher N J, Thomson N R. 2010. Studying bacterial transcriptomes using RNA-seq.Current Opinion in Microbiology, 13, 619–624.
Huang H, Li X, Wu M. 2013. Cloning, expression and characterization of a phosphogluco-mutase/phosphomannomutase from sphingan-producing Sphingomonas sanxanigenens.Biotechnology Letters,35, 1265–1270.
Jiang M, Chen X, Liang L. 2014. Co-expression of phosphoenolpyruvate carboxykinase and nicotinic acid phosphoribosyltransferase for succinate production in engineeredEscherichia coli.Enzyme and Microbial Technology, 56, 8–14.
Kanehisa M, Araki M, Goto S, Hattori M, Hirakawa M, Itoh M, Katayama T, Kawashima S, Okuda S, Tokimatsu T,Yamanishi Y. 2008. KEGG for linking genomes to life and the environment.Nucleic Acids Research, 36(Suppl.1),D480–D484.
Kanehisa M, Goto S, Hattori M, Aoki-Kinoshita K F, Itoh M,Kawashima S, Katayama T, Araki M, Hirakawa M. 2006.From genomics to chemical genomics: New developments in KEGG.Nucleic Acids Research, 34(Suppl.1), D354–D357.
Li G L, Zhao J G, Li X Y, Yu M, Samuel M S, Zhao S H, Prather R S, Li C. 2014. Dysregulation of genome-wide gene expression and DNA methylation in abnormal cloned piglets.BMC Gnomics, 15, 811.
Maier T, Marcos J, Wodke J A H, Paetzold B, Liebeke M,Gutierrez Gallego R, Serrano L. 2013. Large-scale metabolome analysis and quantitative integration with genomics and proteomics data inMycoplasma pneumoniae.Molecular BioSystems, 9, 1743–1755.
Pachkova M, Dandekarc T, Korbeld J, Bork P, Schuster S. 2007.Use of pathway analysis and genome context methods for functional genomics ofMycoplasma pneumoniaenucleotide metabolism.Gene, 396, 215–225.
Pegan S D, Rukseree K, Capodagli G C, Baker E A, Krasnykh O, Franzblau S G, Mesecar A D. 2013. Active site loop dynamics of a class IIa fructose 1,6-bisphosphate aldolase fromM.Tuberculosis.Biochemistry, 52, 912–925.
Razin S, Yogev D, Naot Y. 1998. Molecular biology and pathogenicity of mycoplasmas.Microbiology & MolecularBiology Reviews, 62, 1094–1156.
Sorek R, Cossart. 2010. Prokaryotic transcriptomics: A new view on regulation, physiology and pathogenicity.Nature Reviews Genetics, 11, 9–16.
Sun S, Xuan F, Ge X, Fu H, Zhu J, Zhang S. 2014. Identification of differentially expressed genes in hepatopancreas of oriental river prawn,Macrobrachium nipponenseexposed to environmental hypoxia.Gene, 534, 298–306.
Wodke J A H, Puchalka J, Lluch-Senar M, Marcos J, Us E,Godinho M, Gutierrez Gallego R, Martins dos Santos V A,Serrano L, Klipp E, Maier T. 2013. Dissecting the energy metabolism inMycoplasma pneumoniaethrough genomescale metabolic modeling.Molecular Systems Biology, 9,653.
Xu C G, Hao Y Q, Zhang L, Hao R X , Liu X L, Huang Z Y. 2014.Molecular cloning and immune response analysis of putative variable lipoproteins fromMycoplasma mycoidessubspcapri.Genetics & Molecular Research, 13, 1527–1539.
Yus E, Maier T, Michalodimitrakis K, van Noort V, Yamada T,Chen W H, Wodke J A, Güell M, Martínez S, Bourgeois R, Kühner S, Raineri E, Letunic I, Kalinina O V, Rode M,Herrmann R, Gutiérrez-Gallego R, Russell R B, Gavin A C,Bork P,et al. 2009. Impact of genome reduction on bacterial metabolism and its regulation.Science, 326, 1263–1268.
 Journal of Integrative Agriculture2018年2期
- Journal of Integrative Agriculture的其它文章
- Rapid mapping of candidate genes for cold tolerance in Oryza rufipogon Griff. by QTL-seq of seedlings
- A dCAPS marker developed from a stress associated protein gene TaSAP7-B governing grain size and plant height in wheat
- A major quantitative trait locus controlling phosphorus utilization efficiency under different phytate-P conditions at vegetative stage in barley
- Overexpression of IbSnRK1 enhances nitrogen uptake and carbon assimilation in transgenic sweetpotato
- Collision detection of virtual plant based on bounding volume hierarchy: A case study on virtual wheat
- lntegrated management strategy for improving the grain yield and nitrogen-use efficiency of winter wheat