
effects of dietary supplementation of Ulva pertusa and nonstarch polysaccharide enzymes on gut microbiota of Siganus canaliculatus*
2018-05-07 06:07ZHANGXinxu张新旭WUHuijuan吴惠娟LIZhongzhen李忠贞LIYuanyou李远友WANGShuqi王树启ZHUDashi朱大世WENXiaobo温小波LIShengkang李升康
关键词:忠贞
ZHANG Xinxu (张新旭) WU Huijuan (吴惠娟) LI Zhongzhen (李忠贞) LI Yuanyou (李远友) WANG Shuqi (王树启) ZHU Dashi (朱大世) WEN Xiaobo (温小波) LI Shengkang (李升康)
1 Guangdong Provincial Key Laboratory of Marine Biotechnology, Shantou University, Shantou 515063, China
2 Marine Biology Institute, Shantou University, Shantou 515063, China
1 INTRODUCTION
Siganuscanaliculatusis a commercially important aquaculture fish which mainly inhabits the coast of southeast China (Xu et al., 2011). Owing to its tender meat and rich in polyunsaturated fatty acids (Li et al.,2008), growing demands in aquaculture industry have encouraged wide cultivation ofS.canaliculatus. In general, the cost of feed constitutes >50% of the total cost in farming, in which animal-derived materials(e.g., fish meal) are often the most expensive. Despite the fact thatS.canaliculatusis herbivorous and mainly feed on algae and seagrasses in natural habitats(von Westernhagen, 1973), fish meal has a superior effect on fish growth due to its high protein content and favorable amino acid profile (Sinha et al., 2011).As some plant-derived materials (e.g., soybean meal,legume seeds, and seaweeds) contain high quality and energy rich nutrient sources, they are commonly used as important ingredients in aquaculture, which help reducing the cost significantly. Our previous studies have determined the basic nutritional requirements ofS.canaliculatus(Wang et al., 2010), and demonstrated that macroalgaeUlvapertusais a preferred food for this herbivorous species (You et al., 2014a, b). Dietary supplementation ofU.pertusapowder is thus a promising way to cut down the cost without influencing fish growth and quality (Tolentino-Pablico et al., 2008; Güroy et al., 2013).
However, an important problem that hinders the application of plant-derived materials is the presence of abundant non-starch polysaccharides (NSPs, the major component of plant cell wall) that are indigestible for fish and other monogastric animals for lack of specific enzymes (Kuz’mina, 1996), and studies have suggested negative effects of NSPs on digestion and absorption of energy and nutrients in a few fish species (Refstie et al., 1999; Storebakken et al., 1999; Allan et al., 2000). The addition of exogenous NSP-degrading enzymes (e.g., cellulase,xylanase, and β-glucanase) in plant-derived sources is an economical approach to solve this problem, and numerous reports have revealed their effects on improving nutrient utilization in fish (Kumar et al.,2006; Ai et al., 2007), possibly through disrupting cell wall integrity, reducing digesta viscosity, and/or stimulating gastrointestinal microbiota (Sinha et al.,2011).
Fishes represent the highest diversity of vertebrates,and the gastrointestinal tract of fish harbors diverse microbial communities (including adhesive microorganisms and non-adhesive ones) that are involved in digestion and immune responses, and contribute to host nutrition and health (Rawls et al.,2004; Gómez and Balcázar, 2008). A recent study showed that Proteobacteria and Fusobacteria dominated the microbial communities in the gut of zebrafish (Roeselers et al., 2011). Proteobacteria,Firmicutes and Actinobacteria prevailed in Grass carp intestine (Wu et al., 2012). Cyanobacteria,Proteobacteria, Actinobacteria and Bacteroidetes were predominant groups in Silver carp and Gizzard shad (Ye et al., 2014). Firmicutes were detected to be dominant species in the hindgut of three temperate marine herbivorous fishes (Clements et al., 2007).Notably, host diet is known to have a strong influence on indigenous microorganisms that inhabit the gastrointestinal tract (David et al., 2014; Ye et al.,2014), and the composition and diversity of microbial communities is partly determined by dietary preferences (Ley et al., 2008). For herbivorous fishes,diets with abundant NSPs may alter gut microbiota by enhancing volatile fatty acids, lowering pH of intestinal tract, or decreasing oxygen tension (Sinha et al., 2011). Some gut microorganisms, for example,convert indigestible algal components (e.g., cellulose and mannitol) to glucose and short-chain fatty acids that can be assimilated directly by herbivorous fishes(White et al., 2010; Wu et al., 2012). Microbial fermentation of high-starch foods such as cereal grains may also stimulate fatty acid uptake in the gut(Van Soest, 1994; Leenhouwers et al., 2007).
Despite the importance ofS.canaliculatusin aquaculture industry, the microbial communities in its gut is still unknown. This study aims to characterize the gastrointestinal microbial community compositions ofS.canaliculatusthrough three culture-independent methods based on analysis of the bacterial 16S rRNA genes, including denaturing gradient gel electrophoresis (DGGE), clone library construction, and high-throughput sequencing. This would facilitate an overview of the total gut microbiota inS.canaliculatus. The influence of dietary supplementation of macroalgaeU.pertusaand NSP enzymes on gut microbiota was further assayed to better understand its core gut microbiota, and to identify potential NSP-degrading microorganisms.
2 MATERIAL AND METHOD
2.1 Ethics statement
Fish used in this study were captured from the coastal area near Nan’Ao Marine Biology Station(NAMBS) of Shantou University, Guangdong Province, China. No specific permits were required for the described field studies, as the sampling locations were not privately owned or protected in any way. Furthermore these field studies did not involve endangered or protected species. The animals were processed according to “the Regulations for the Administration of Affairs Concerning Experimental Animals” established by Guangdong Provincial Department of Science and Technology on the Use and Care of Animals, and the experiments were approved by the Institutional Animal Care and Use Committee of Shantou University.
2.2 Fish sampling and feeding conditions
S.canaliculatusjuveniles (~15 g) were captured from the coastal area near NAMBS of Shantou University, and were acclimated for 3 weeks with self-prepared feeds. These fish were randomly reared in eighteen 200-L cylindrical tanks (13 fish per tank)equipped with a continuous recirculating seawater system. Group A was fed basal diet (Table S1); Group M was fed basal diet supplemented with 10 wt%U.pertusapowder (collected from the coastal waters near NAMBS) and 0.2 wt% NSP enzymes (90 U/g cellulase, 60 U/g xylanase and 120 U/g β-glucanase(Li et al., 2013)); Group Z was fed basal diet supplemented with 10 wt%U.pertusapowder only.Each treatment was conducted in triplicate tanks. The water temperature was maintained at 22±0.5°C with constant aeration and natural photoperiod. The water salinity was 32. Every day, the fish were fed to apparent satiation at 08:30 and 16:30, respectively;half of the aquarium water was replaced, and the faeces was removed. Detailed information had been described previously (You et al., 2014b). After 8 weeks, three healthy fish with a weight of ~43 g from each group were euthanized, and the whole intestinal tracts with gut contents were immediately removed with a sterile tweeze and clamped to prevent loss of samples. The gut contents were gently squeezed out into eppendorf tubes and stored at -80°C before DNA extraction.
2.3 DNA extraction, 16S rRNA gene amplification and sequencing
Nucleic acid of the gut contents was extracted using the FastDNA™ SPIN Kit for Soil (MP Biomedicals, USA) according to the manufacturer’s instructions. Three parallel extractions were performed for each sample, and the DNA extracts were pooled for subsequent PCR amplification to minimize the biases and contamination. The DNA blank extraction was performed without a sample and processed with the same DNA extraction and PCR amplification kits as the experimental groups. DNA extraction and PCR amplification were considered free of contamination if no target PCR band was seen on an agarose gel from the blank DNA extraction and the PCR negative control.
PCR-DGGE and clone library construction of the extracted DNA samples were performed as described previously (Li et al., 2012). Briefly, a ~180 bp (V3 region) and a ~1 500-bp (near full-length) of the 16S rRNA genes, were amplified for PCR-DGGE analysis and clone library construction, respectively. Three parallel PCR amplifications were performed for each sample and pooled for subsequent sequencing. For PCR-DGGE, the extracted DNA from the intestines of three fish in each group were analyzed separately.However, above DNA extracts were pooled for subsequent PCR amplification for clone library and Illumina sequencing due to limited availability.
For Illumina sequencing, the V6 region of the bacterial 16S rRNA gene was amplified using the multi-tag primers 967F and 1046R, and ~60 bp amplicons were generated. The PCR program involved an initial denaturation step at 94°C for 2 min, followed by 30 cycles of denaturation at 94°C for 30 s, annealing at 57°C for 30 s, and extension at 72°C for 30 s, with a final extension at 72°C for 5 min.Three parallel PCR amplifications were performed for each sample and pooled for subsequent sequencing.The 16S rRNA gene amplicons containing unique 8-mer barcodes used for each sample were pooled at equal concentrations, and sequenced on an Illumina HiSeq2000 platform using 2×100 bp cycles according to manufacturer’s instructions. Raw reads were removed if they contained (1) a ≥ 10 bp poly sequence,(2) more than 2 bp with the quality score less than 20,and/or (3) any ambiguities. Filtered reads were merged together, and the merged sequences were removed if the sequence length was <50 bp. Clean sequences were demultiplexed using the QIIME software pipeline (Caporaso et al., 2010b; Version 1.9.0) with a mapping file containing the sample ID,barcode and primer sequence.
The near full-length 16S rRNA gene sequences have been deposited to GenBank with the accession numbers from HG970977 to HG971024. The Illumina sequence data have been deposited in the National Center for Biotechnology Information (NCBI)Sequence Read Archive under the accession number SRA148879 (A: SRR1203925, M: SRR1206016, Z:SRR1206017). The PCR primers are listed in Table S2.
2.4 Bacterial community composition and phylogenetic analysis
PCR-DGGE and clone library analysis were performed as described previously (Li et al., 2012).Statistical significance between groups in Table 1 were analyzed using Mann-Whitney U test (SPSS 22.0). For Illumina sequencing data, the sequences were aligned with PyNAST (Caporaso et al., 2010a;Version 1.2.2) and clustered into operational taxonomic units (OTUs) at 97% sequence similarity cutoff using usearch61 (Edgar, 2010) with the parameter --minlen=50 in the QIIME software pipeline (Caporaso et al., 2010b; Version 1.9.0).OTUs were assigned to taxa based on the Greengenes database (DeSantis et al., 2006; Version gg_13_5).Chimeric sequences were detected with the UCHIME program (Edgar et al., 2011; Version 4.2) using default parameters, and they were removed from further analysis. For the Venn diagram, sequences were rarefied to an even depth (5 785 029 reads) by random sampling using QIIME. The Venn diagram wascreated with a web tool provided by the Bioinformatics and Systems Biology of Gent (http://bioinformatics.psb.ugent.be/webtools/Venn/). The ternary plot was performed using the PAST software package (Hammeret al., 2001; Version 3.06). Cluster analysis of the microbial community structure was performed inRbased on a Bray-Curtis matrix using average linkage(R Core Team, 2015; Version 3.2.0). In this study,bacterial community composition analysis was mainly based on Illumina sequencing data. The phylogenetic tree was constructed in QIIME using the FastTree method, and the Shimodaira-Hasegawa test was used to estimate the reliability of each branch with 1 000 resamples (Price et al., 2010; Version 2.1.3).

Table 1 Microbial diversity indices calculated from the DGGE banding patterns

Fig.1 The denaturing gradient gel electrophoresis profiles of the intestinal microbiota in S. canaliculatus from different groups
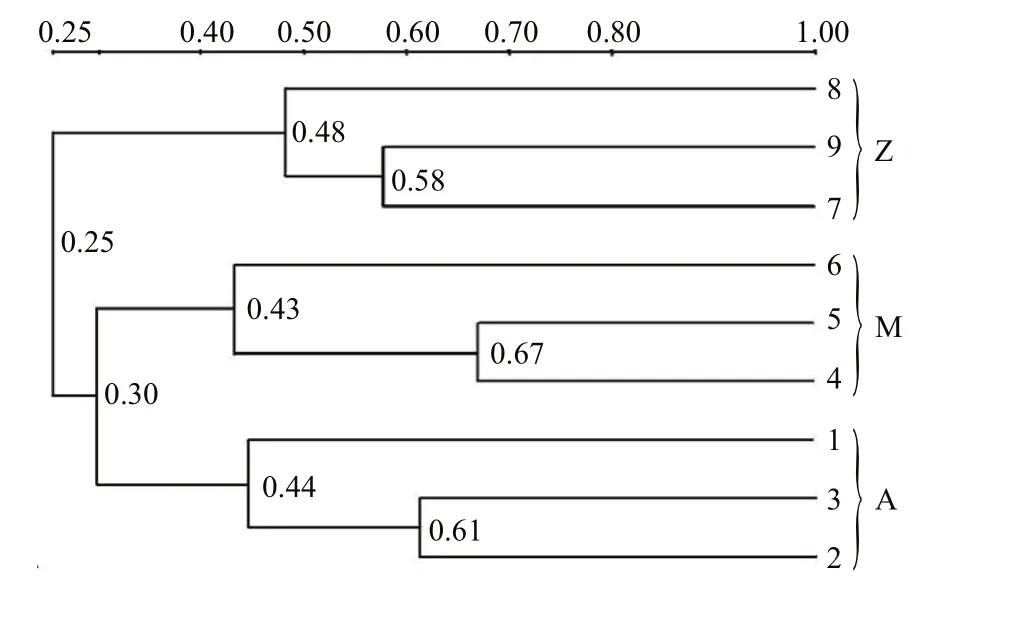
Fig.2 Cluster analysis of the bacterial communities in the intestine of S. canaliculatus based on DGGE profiles
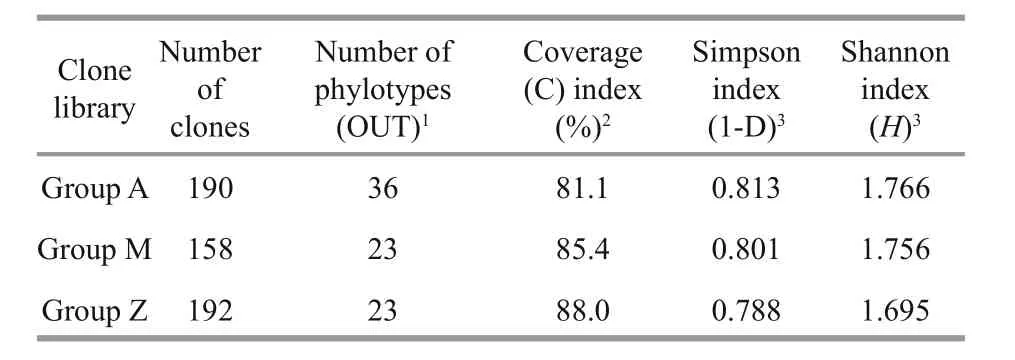
Table 2 Comparison of coverage and diversity indices of 16S rRNA gene clone libraries
3 RESULT
3.1 Microbial diversity analysis based on DGGE and 16S rRNA gene clone library
Approximately 23 DGGE bands with distinct patterns were observed in samples from different treatments (Fig.1; Table 1). Cluster analysis of the DGGE band patterns showed that samples from each dietary supplementation treatment grouped together(Fig.2), suggesting that bacterial community structures varied in the intestine ofS.canaliculatuswith different treatments.

Fig.3 Bacterial community compositions of the three groups by two sequencing methods
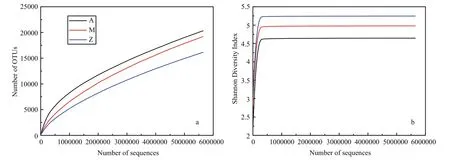
Fig.4 Alpha-diversity analysis of three samples with different treatments based on Illumina data
To investigate the phylogenetic diversity of the intestinal microbial communities, three clone libraries of the 16S rRNA gene from Groups A, M and Z were constructed. In total, 190, 158 and 192 clones with the estimated overall coverage of 81.1%, 85.4% and 88.0% were retrieved from the colony libraries of A,M and Z, respectively (Table 2). Highest sequence population diversity occurred in A as calculated by Shannon diversity index (H), followed by M and Z(Table 2). Forty-three unique sequences were eventually obtained after a filtering procedure removing highly identical sequences with a criteria of 97% sequence similarity cutoff (Table S3). The identified taxa for each clone library generally grouped into six phyla, i.e., Proteobacteria, Firmicutes,Tenericutes, Bacteroidetes, Fusobacteria and Deferribacteres (Fig.3). Firmicutes and Tenericutes dominated the bacterial community across different treatments, constituting 33.5% to 43.7% of the total sequenced clones. Phylogenetic analysis of the near full-length 16S rRNA gene sequences from the three groups showed that highest species diversity occurred in Firmicutes, Bacteroidetes, and Proteobacteria (Fig.S1). Blastn (Altschul et al., 1990) searches of the cloned sequences against GenBank database revealed that >80% of the clones had <97% sequence similarity with known type species (Table S3), indicating that unique bacterial communities inhabit the gut ofS.canaliculatus.
3.2 Microbial community compositions based on Illumina sequencing
The number of high quality bacterial 16S rRNA gene sequences obtained by high-throughput sequencing were between 5 785 029 and 5 881 813,resulting in more than 9 654 OTUs at 97% sequence similarity (Table 3). Alpha-diversity analysis showed that the rarefaction curves for all of the samples did not plateau at this sequencing depth (Fig.4a), but the Shannon Diversity indices were stable (Fig.4b). This indicated that major bacterial communities had largely been covered, although rare new phylotypes could still appear upon further sequencing.

Fig.5 A Venn diagram showing the distribution of shared bacterial groups based on Illumina data

Table 3 Number of high quality bacterial 16S rRNA gene sequences obtained by Illumina sequencing
Similar bacterial groups among the communities of Groups A, M and Z were observed as determined by Venn diagram (Fig.5). The number of overlapping groups were 29 at phylum level (89 at class level),and their relative abundances covered more than 99.9% of the total bacterial community in each sample(Table S4). Most of the bacterial groups were shared by A and M, and they almost had a complete coverage over those in Z (Fig.5). In general, Proteobacteria and Firmicutes dominated the bacterial community,although their relative abundances varied in different samples (Fig.3). For example, Proteobacteria-related sequences constituted more than 62.9% of the total communities in A and M, but their relative abundance was only 24.6% in Z.

Fig.6 Ternary plot for bacterial groups (phylum level) of the three samples based on Illumina data
Ternary plot further showed that bacterial groups including Proteobacteria, Tenericutes, Deinococcus-Thermus, Spirochaetes, WWE1 and NKB19 were evenly distributed in at least two of the samples(Fig.6), indicating their potential importance as an integral component of the gut inS.canaliculatus.Notably, major bacterial groups (relative abundance>1%) including Firmicutes (63.6%), Bacteroidetes(2.9%) and Fusobacteria (1.3%) were relatively enriched in Group Z. Cyanobacteria was enriched in Group M (5.9% in M, 0.6% in A, and 0.02% in Z).Various minor groups with relative abundance <1%(e.g., Actinobacteria, Acidobacteria and Planctomycetes) were enriched in A (Fig.6; Table S5).Cluster analysis revealed that Groups A and M grouped together based on a Bray-Curtis matrix(Fig.7), which was consistent with the DGGE profiles(Fig.2). Notably,RuminococcusandLactobacillusrelated sequences were relatively abundant in Groups M (6.7%, 0.07%) and Z (11.8%, 0.05%), compared to those in Group A (0.8%, 0.01%); Group A was enriched with Enterobacteriaceae,Actinomyces,Vibrio,StreptococcusandLeuconostoc.ClostridiumandBacillushad higher abundances in Group M(0.9%, 0.05%).Enterococcuswas highest in Group Z(0.007%).

Fig.7 The relative abundances of potential NSP-degrading bacteria in the three samples based on Illumina data
Table S6 showed relative abundances of some major OTUs observed in the three samples. In general,distinct distribution of some abundant OTUs was detected in Group Z as compared to Groups A and M.Notably, OTU0 (Vibrionaceae) was highly abundant in Groups A and M, constituting 48.4% and 36.1% of the total sequences, respectively; it was only 1.2% in Group Z. Group Z was enriched with OTU4(Coprobacillus), OTU10 (Caloramator), OTU14(Erysipelotrichaceae), OTU21 (Ruminococcus) and OTU26 (Arcobacter), indicating their importance as candidateU.pertusadegraders.
4 DISCUSSION
Investigations of the microbial community compositions inhabiting the gut of any host is an important step towards understanding the roles of microorganisms in digestion, immune responses, and host health (Flint et al., 2008; Pérez-Sánchez et al.,2014), and studies on fish gut microbiota have been reported recently (Roeselers et al., 2011; Sullam et al., 2012; Ye et al., 2014; Zhang et al., 2016). Similar bacterial species were observed in the intestines of individualS.canaliculatusregardless of different diet ingredients, which were classified into the core microbiota of 86 OTUs with >93% relative abundance in each sample (Table S6). The reason for the high portions of the shared core gut microbiota is unknown due to the limit of this study. We speculate that early colonization events (e.g., live microorganisms from spawn surface, forage, and water) are key factors to determine the gut microbiota (Wong et al., 2013).Previous reports suggested that the intestinal microbial communities in fishes and mammals collected from different populations or habitats, had few shared sequences even though they were from the same host species (Roeselers et al., 2011; Durbán et al., 2012;Shade and Handelsman, 2012; Sullam et al., 2012).Fish performance and proximate composition showed that similar performance occurred for each diet,although the groups withU.pertusaamendment(Groups M and Z) had lower feed conversion ratios than that fed a basal diet (Group A) (Table S7; You et al., 2014b). This indicated that the shared core microbiota was functional resilient and could utilize these substrates through multiple pathways, which further support our previous findings thatU.pertusais an excellent economic alternative to soybean meal and wheat starch as carbon sources (Wang et al.,2010; Zhang, 2012; You et al., 2014a, b).
Proteobacteria and Firmicutes were predominant bacterial groups in each sample based on the Illumina sequencing data (Fig.3). This result was consistent with previous reports about the gut microbial communities in grass carp (Wu et al., 2012), rainbow trout (Wong et al., 2013), zebrafish (Roeselers et al.,2011) and many other fishes (Nayak, 2010; Sullam et al., 2012), indicating that members of these bacterial groups are essential and well adapted to intestinal environments in fish. Higher abundances of Proteobacteria were observed in Groups A and M(72.3% and 62.9%, respectively) than those in Group Z (24.6%); Group Z was relatively enriched with Firmicutes (63.6%, compared to 17.0%–23.2% in Groups A and M). A possible explanation is that the Proteobacterial and Firmicutes groups identified in this study are sensitive to some nutrients from the untreatedU.pertusapowder. For example, macroalgaeU.pertusacontains significant amounts of NSPs that are indigestible for fish. The supplementation ofU.pertusaalone in Group Z resulted in obvious enrichment of Firmicutes, indicating that these bacterial groups are functional related to NSP degradation. Previous reports demonstrated that many species in Firmicutes are NSP-degrading bacteria(Pankratov et al., 2006; Flint et al., 2008). As discussed above, similar bacterial community compositions occurred in Groups A and M (Fig.3), which was also confirmed by cluster analysis (Fig.2). This is possibly because NSP-degrading enzymes in diet Group M were able to break up some indigestible NSPs into liable compounds, and the overall ingredients and compositions in Group M were similar with those in Group A. Notably, highest relative abundance of Cyanobacteria was observed in Group M (Fig.3),indicating that they were likely from theU.pertusaand were ingested as an important food source (Wu et al., 2012; Ye et al., 2014).
We did not tend to determine the types, functions and activities of the potential NSP-degrading bacteria and probiotics in the gut ofS.canaliculatus, but we performed a comprehensive analysis of these bacterial lineages in the three diet groups. The NSP-degrading bacteria identified in the gut of fish and other vertebrates, includingClostridium,Actinomyces,Ruminococcusand Enterobacteriaceae, were reported to produce NSP-degrading enzymes such as cellulase,xylanase, pectinase and/or β-glucanase (Almirall et al., 1995; O’Connell et al., 2005; Saha et al., 2006; Ye et al., 2014). Various bacterial populations with the potential to degrade NSPs were identified in the three groups (Fig.7). The relative enrichment ofRuminococcus,Clostridiumand Lachnospiraceae in Group M and/or Z suggests that they likely participate in the degradation of the indigestible NSPs fromU.pertusa. For example, seven OTUs (OTU7, OTU21,OTU29, OTU36, OTU65, OTU66 and OTU94; Table S6) that assigned toRuminococcuswere the major NSP-degrading bacterial lineages, constituting up to 11.8% of the total bacterial community inU.pertusaamendment groups.Ruminococcusspp. have been reported to facilitate the host to degrade fibrous plant materials in the rumen (Sijpesteijn, 1951; Kong et al.,2010). SomeClostridiumspecies are known cellulosedegrading bacteria (Kato et al., 2004). An increased abundance of Lachnospiraceae-related species is reported in the human gut on a high NSPs diet (Salonen et al., 2014). Other potential NSP-degrading bacteria identified in this study includedActinomyces,Bacteroides,Anoxybacillus,Enterococcus,Leuconostoc,Anaerococcus,VibrioandBacillus. For the potential probiotics in the intestine ofS.canaliculatus, thirteen lineages were observed(Fig.7). For example, the lactic acid bacteria,includingLactobacillus,Streptococcus,LactococcusandBifidobacterium, could produce bacteriocins that inhibit the growth of certain pathogenic bacteria.Some species that belong toPseudomonas,Phaeobacter,MicrococcusandKocuriahave been reported to stimulate immune response and enhance resistance to some pathogenicAeromonasspp. andVibriospp. (as summarized by Pérez-Sánchez et al.,(2014)).Agrobacterium,Brevibacterium,MicrobacteriumandStaphylococcuscould contribute to nutritional process by improving the absorption efficiency of lipids (Ringø et al., 1995). Altogether,identification of these potential NSP-degrading bacteria and probiotics inhabiting the intestine ofS.canaliculatusprovides clues to study their functions and applications in aquaculture industry.
In addition, OTU2 and OTU5 that assigned to Desulfovibrionaceae of Deltaproteobacteria were among the top-ten most abundant OTUs in Groups M and Z, which is approximately four-folds higher than that in Group A (Table S6). Many species in this family such asDesulfovibrioare known anaerobic sulfate reducers. A possible explanation for the enrichment of Desulfovibrionaceae in Groups M and Z is the indigestible NSPs fromU.pertusaincreased the residence time of digesta and decreased oxygen tension in the intestine, thus favoring the development of anaerobic microorganisms such as sulfate reducers(Choct, 1997; Sinha et al., 2011). These sulfate reducers have been reported to utilize short-chain fatty acids (e.g. lactate) to produce hydrogen sulfide(Heidelberg et al., 2004), which is generally a toxic product to the host (Attene-Ramos et al., 2006). This result indicated that supplementation ofU.pertusamight lead to growth of sulfate reducers that were harmful to the host.
One thing should be noted is the Illumina sequencing data and clone library analysis resulted in varied intestinal bacterial diversity ofS.canaliculatusin each diet (Fig.3). We attribute this to the bias caused by PCR primers. different primers may occasionally amplify specific groups and lead to biased community compositions as has been reported previously (Teske and Sørensen, 2008; Pinto and Raskin, 2012; Cruaud et al., 2014). Another possibility is that varied number of 16S rRNA gene copies occur in different microbial cells (Větrovský and Baldrian,2013), which would also influence the 16S rRNA gene abundance in the samples. In this study, the Illumina sequencing data (>5,785,029 reads; Table 3)had much higher overall coverage of the total 16S rRNA genes in the community than those using the clone library construction technique (<192 clones;Table 2), so description and comparison of the bacterial community compositions were only performed by using the Illumina sequencing data. The clone library data were mainly used for investigating the phylogenic diversity of the three samples due to the recovery of near full-length 16S rRNA genes.Nevertheless, our results showed consistent observation of some bacterial groups in each sample,including Proteobacteria, Firmicutes, Tenericutes,Bacteroidetes and Fusobacteria, indicating that they were “true” representation of the gut microbiota inS.canaliculatus.
5 CONCLUSION
In summary, this study provides the first insight into the bacterial community compositions in the intestine of theS.canaliculatus. A core gut microbiota dominated by Proteobacteria and Firmicutes was observed in fish fed three different diets with/without the supplementation ofU.pertusaand NSP enzymes.Higher abundances ofRuminococcus,Clostridiumand Lachnospiraceae-related sequences of Firmicutes were detected in fish fedU.pertusa, indicating that these microorganisms likely participate in the degradation of NSPs derived fromU.pertusa.Meanwhile, diverse potential NSP-degrading bacteria and probiotics were observed in the intestine of theS.canaliculatus. This study supports our previous conclusion thatU.pertusais an economic alternative to soybean meal and wheat starch as carbon sources.Future research on the gut microbiota ofS.canaliculatus, including isolation and characterization of NSP-degrading bacteria and probiotics, may help the production ofS.canaliculatuswith lower costs without compromising quality.
6 ACKNOWLEDGEMENT
We thank Prof. WEI Chiju of Shantou University for critical discussion and proof-reading of the manuscript.
Ai Q H, Mai K S, Zhang W B, Xu W, Tan B P, Zhang C X, Li H T. 2007. effects of exogenous enzymes (phytase, nonstarch polysaccharide enzyme) in diets on growth, feed utilization, nitrogen and phosphorus excretion of Japanese seabass,Lateolabraxjaponicus.Comp.Biochem.Physiol.AMol.Integr.Physiol.,147(2): 502-508.
Allan G L, Parkinson S, Booth M A, Stone D A J, Rowland S J, Frances J, Warner-Smith R. 2000. Replacement of fish meal in diets for Australian silver perch,Bidyanus bidyanus: I. Digestibility of alternative ingredients.Aquaculture,186(3-4): 293-310.
Almirall M, Francesch M, Perez-Vendrell A M, Brufau J,Esteve-Garcia E. 1995. The differences in intestinal viscosity produced by barley and β-glucanase alter digesta enzyme activities and ileal nutrient digestibilities more in broiler chicks than in cocks.J.Nutr.,125(4): 947-955.
Altschul S F, Gish W, Miller W, Myers E W, Lipman D J. 1990.Basic local alignment search tool.J.Mol.Biol.,215(3):403-410.
Attene-Ramos M S, Wagner E D, Plewa M J, Gaskins H R.2006. Evidence that hydrogen sulfide is a genotoxic agent.Mol.CancerRes.,4(1): 9-14.
Caporaso J G, Bittinger K, Bushman F D, DeSantis T Z,Andersen G L, Knight R. 2010a. PyNAST: a flexible tool for aligning sequences to a template alignment.Bioinformatics,26(2): 266-267.
Caporaso J G, Kuczynski J, Stombaugh J, Bittinger K,Bushman F D, Costello E K, Fierer N, Peña A G, Goodrich J K, Gordon J I, Huttley G A, Kelley S T, Knights D,Koenig J E, Ley R E, Lozupone C A, McDonald D,Muegge B D, Pirrung M, Reeder J, Sevinsky J R,Turnbaugh P J, Walters W A, Widmann J, Yatsunenko T,Zaneveld J, Knight R. 2010b. QIIME allows analysis of high-throughput community sequencing data.Nat.Methods,7(5): 335-336.
Choct M. 1997. Feed non-starch polysaccharides: chemical structures and nutritional significance.FeedMillingInt.,(June): 13-26.
Clements K D, Pasch I B Y, Moran D, Turner S J. 2007.Clostridia dominate 16S rRNA gene libraries prepared from the hindgut of temperate marine herbivorous fishes.Mar.Biol.,150(6): 1 431-1 440.
Cruaud P, Vigneron A, Lucchetti-Miganeh C, Ciron P E,Godfroy A, Cambon-Bonavita M A. 2014. Influence of DNA extraction method, 16S rRNA targeted hypervariable regions, and sample origin on microbial diversity detected by 454 pyrosequencing in marine chemosynthetic ecosystems.Appl.Environ.Microbiol.,80(15): 4 626-4 639.
David L A, Maurice C F, Carmody R N, Gootenberg D B,Button J E, Wolfe B E, Ling A V, Devlin A S, Varma Y,Fischbach M A, Biddinger S B, Dutton R J, Turnbaugh P J. 2014. Diet rapidly and reproducibly alters the human gut microbiome.Nature,505(7484): 559-563.
DeSantis T Z, Hugenholtz P, Larsen N, Rojas M, Brodie E L,Keller K, Huber T, Dalevi D, Hu P, Andersen G L. 2006.Greengenes, a chimera-checked 16S rRNA gene database and workbench compatible with ARB.Appl.Environ.Microbiol.,72(7): 5 069-5 072.
Durbán A, Abellán J J, Jiménez-Hernández N, Latorre A,Moya A. 2012. Daily follow-up of bacterial communities in the human gut reveals stable composition and hostspecific patterns of interaction.FEMSMicrobiol.Ecol.,81(2): 427-437.
Edgar R C, Haas B J, Clemente J C, Quince C, Knight R. 2011.UCHIME improves sensitivity and speed of chimera detection.Bioinformatics,27(16): 2 194-2 200.
Edgar R C. 2010. Search and clustering orders of magnitude faster than BLAST.Bioinformatics,26(19): 2 460-2 461.
Flint H J, Bayer E A, Rincon M T, Lamed R, White B A. 2008.Polysaccharide utilization by gut bacteria: potential for new insights from genomic analysis.Nat.Rev.Microbiol.,6(2): 121-131.
Gómez G D, Balcázar J L. 2008. A review on the interactions between gut microbiota and innate immunity of fish.FEMSImmunol.Med.Microbiol.,52(2): 145-154.
Güroy B, Ergün S, Merrifield D L, Güroy D. 2013. effect of autoclaved Ulva meal on growth performance, nutrient utilization and fatty acid profile of rainbow trout,Oncorhynchusmykiss.Aquacult.Int.,21(3): 605-615.
Hammer O, Harper D A T, Ryan P. 2001. PAST: paleontological statistics software package for education and data analysis.PalaeontologiaElectronica,4(1): 1-9.
Heidelberg J F, Seshadri R, Haveman S A, Hemme C L,Paulsen I T, Kolonay J F, Eisen J A, Ward N, Methe B,Brinkac L M, Daugherty S C, Deboy R T, Dodson R J,Durkin A S, Madupu R, Nelson W C, Sullivan S A, Fouts D, Haft D H, Selengut J, Peterson J D, Davidsen T M,Zafar N, Zhou L W, Radune D, Dimitrov G, Hance M,Tran K, Khouri H, Gill J, Utterback T R, Feldblyum T V,Wall J D, Voordouw G, Fraser C M. 2004. The genome sequence of the anaerobic, sulfate-reducing bacteriumDesulfovibriovulgarisHildenborough.Nat.Biotechnol.,22(5): 554-559.
Kato S, Haruta S, Cui Z J, Ishii M, Yokota A, Igarashi Y. 2004.Clostridiumstraminisolvenssp. nov., a moderately thermophilic, aerotolerant and cellulolytic bacterium isolated from a cellulose-degrading bacterial community.Int.J.Syst.Evol.Microbiol.,54(6): 2 043-2 047.
Kong Y H, Teather R, Forster R. 2010. Composition, spatial distribution, and diversity of the bacterial communities in the rumen of cows fed different forages.FEMSMicrobiol.Ecol.,74(3): 612-622.
Kumar S, Sahu N P, Pal A K, Choudhury D, Mukherjee S C.2006. Studies on digestibility and digestive enzyme activities inLabeorohita(Hamilton) juveniles: effect of microbial α-amylase supplementation in non-gelatinized or gelatinized corn-based diet at two protein levels.Fish Physiol.Biochem.,32(3): 209-220.
Kuz’mina V V. 1996. Influence of age on digestive enzyme activity in some freshwater teleosts.Aquaculture,148(1):25-37.
Leenhouwers J I, Ortega R C, Verreth J A J, Schrama J W.2007. Digesta characteristics in relation to nutrient digestibility and mineral absorption in Nile tilapia(OreochromisniloticusL.) fed cereal grains of increasing viscosity.Aquaculture,273(4): 556-565.
Ley R E, Lozupone C A, Hamady M, Knight R, Gordon J I.2008. Worlds within worlds: evolution of the vertebrate gut microbiota.Nat.Rev.Microbiol.,6(10): 776-788.
Li Q, Wang S Q, You C H, Li Y Y. 2013. Comparison of three Non-starch polysaccharide enzymes on the in vitro digestibility of several kinds of marine algae.Siliao Gongye,34(22): 37-41. (in Chinese)
Li S, Sun L, Wu H, Hu Z, Liu W, Li Y, Wen X. 2012. The intestinal microbial diversity in mud crab (Scylla paramamosain) as determined by PCR-DGGE and clone library analysis.J.Appl.Microbiol.,113(6): 1 341-1 351.
Li Y Y, Hu C B, Zheng Y J, Xia X A, Xu W J, Wang S Q, Chen W Z, Sun Z W, Huang J H. 2008. The effects of dietary fatty acids on liver fatty acid composition and Δ6-desaturase expression differ with ambient salinities inSiganuscanaliculatus.Comp.Biochem.Physiol.B Biochem.Mol.Biol.,151(2): 183-190.
Nayak S K. 2010. Role of gastrointestinal microbiota in fish.Aquacult.Res.,41(11): 1 553-1 573.
O'Connell J M, Sweeney T, Callan J J, O'Doherty J V. 2005.The effect of cereal type and exogenous enzyme supplementation in pig diets on nutrient digestibility,intestinal microflora, volatile fatty acid concentration and manure ammonia emissions from finisher pigs.Animal Science,81(3): 357-364.
Pankratov T A, Dedysh S N, Zavarzin G A. 2006. The leading role of actinobacteria in aerobic cellulose degradation inSphagnumpeat bogs.Dokl.Biol.Sci.,410(1): 428-430.
Pérez-Sánchez T, Ruiz-Zarzuela I, de Blas I, Balcázar J L.2014. Probiotics in aquaculture: a current assessment.Rev.Aquacult.,6(3): 133-146.
Pinto A J, Raskin L. 2012. PCR biases distort bacterial and archaeal community structure in pyrosequencing datasets.PLoSOne,7(8): e43093.
Price M N, Dehal P S, Arkin A P. 2010. FastTree 2-approximately maximum-likelihood trees for large alignments.PLoS One,5(3): e9490.
R Core Team. 2015. R: a language and environment for statistical computing. R Foundation for Statistical Computing, Vienna, Austria, http://www.r-project.org/.
Rawls J F, Samuel B S, Gordon J I. 2004. Gnotobiotic zebrafish reveal evolutionarily conserved responses to the gut microbiota.Proc.Natl.Acad.Sci.U.S.A.,101(13):4 596-4 601.
Refstie S, Svihus B, Shearer K D, Storebakken T. 1999.Nutrient digestibility in Atlantic salmon and broiler chickens related to viscosity and non-starch polysaccharide content in different soyabean products.Anim.FeedSci.Technol.,79(4): 331-345.
Ringø E, Strøm E, Tabachek J A. 1995. Intestinal microflora of salmonids: a review.Aquacult.Res.,26(10): 773-789.
Roeselers G, Mittge E K, Stephens W Z, Parichy D M,Cavanaugh C M, Guillemin K, Rawls J F. 2011. Evidence for a core gut microbiota in the zebrafish.ISMEJ.,5(10):1 595-1 608.
Saha S, Roy R N, Sen S K, Ray A K. 2006. Characterization of cellulase-producing bacteria from the digestive tract of tilapia,Oreochromismossambica(Peters) and grass carp,Ctenopharyngodonidella(Valenciennes).Aquacult.Res.,37(4): 380-388.
Salonen A, Lahti L, Salojärvi J, Holtrop G, Korpela K, Duncan S H, Date P, Farquharson F, Johnstone A M, Lobley G E,Louis P, Flint H J, de Vos W M. 2014. Impact of diet and individual variation on intestinal microbiota composition and fermentation products in obese men.ISMEJ.,8(11):2 218-2 230.
Shade A, Handelsman J. 2012. Beyond the Venn diagram: the hunt for a core microbiome.Environ.Microbiol.,14(1):4-12.
Sijpesteijn A K. 1951. On ruminococcus flavefaciens, a cellulose-decomposing bacterium from the rumen of sheep and cattle.J.Gen.Microbiol.,5: 869-879.
Sinha A K, Kumar V, Makkar H P S, De Boeck G, Becker K.2011. Non-starch polysaccharides and their role in fish nutrition-A review.FoodChem.,127(4): 1 409-1 426.
Storebakken T, Kvien I S, Shearer K D, Grisdale-Helland B,Helland S J. 1999. Estimation of gastrointestinal evacuation rate in Atlantic salmon (Salmosalar) using inert markers and collection of faeces by sieving:evacuation of diets with fish meal, soybean meal or bacterial meal.Aquaculture,172(3-4): 291-299.
Sullam K E, Essinger S D, Lozupone C A, O’Connor M P,Rosen G L, Knight R O B, Kilham S S, Russell J A. 2012.Environmental and ecological factors that shape the gut bacterial communities of fish: a meta-analysis.Mol.Ecol.,21(13): 3 363-3 378.
Teske A, Sørensen K B. 2008. Uncultured archaea in deep marine subsurface sediments: have we caught them all?ISMEJ.,2(1): 3-18.
Tolentino-Pablico G, Bailly N, Froese R, Elloran C. 2008.Seaweeds preferred by herbivorous fishes.J.Appl.Phycol.,20(5): 933-938.
Van Soest P J. 1994. Nutritional Ecology of the Ruminant. 2ndedn. Cornell University Press, Ithaca.
Větrovský T, Baldrian P. 2013. The variability of the 16S rRNA gene in bacterial genomes and its consequences for bacterial community analyses.PLoSOne,8(2): e57923.von Westernhagen H. 1973. The natural food of the rabbitfishSiganusoraminand S. striolata.Mar.Biol.,22(4): 367-370.
Wang S Q, Xu S D, Wu Q Y, Zhang L, Zhang T, You C H,Zheng H P, Li Y Y. 2010. Optimal levels of protein and lipid in diets for rabbitfishSiganuscanaliculatusjuvenile.MarineSciences,34(11): 18-22. (in Chinese with English abstract)
White W L, Coveny A H, Robertson J, Clements K D. 2010.Utilisation of mannitol by temperate marine herbivorous fishes.J.Exp.Mar.Biol.Ecol.,391(1-2): 50-56.
Wong S, Waldrop T, Summerfelt S, Davidson J, Barrows F,Kenney P B, Welch T, Wiens G D, Snekvik K, Rawls J F,Good C. 2013. Aquacultured rainbow trout (Oncorhynchus mykiss) possess a large core intestinal microbiota that is resistant to variation in diet and rearing density.Appl.Environ.Microbiol.,79(16): 4 974-4 984.
Wu S G, Wang G T, Angert E R, Wang W W, Li W X, Zou H.2012. Composition, diversity, and origin of the bacterial community in grass carp intestine.PLoSOne,7(2):e30440.
Xu S D, Zhang L, Wu Q Y, Liu X B, Wang S Q, You C H, Li Y Y. 2011. Evaluation of dried seaweedGracilaria lemaneiformisas an ingredient in diets for teleost fishSiganuscanaliculatus.Aquacult.Int.,19(5): 1 007-1 018.
Ye L, Amberg J, Chapman D, Gaikowski M, Liu W T. 2014.Fish gut microbiota analysis differentiates physiology and behavior of invasive Asian carp and indigenous American fish.ISMEJ.,8(3): 541-551.
You C H, Zeng F G, Wang S Q, Li Y Y. 2014a. Preference of the herbivorous marine teleostSiganuscanaliculatusfor different macroalgae.J.OceanUniv.China,13(3): 516-522.
You C H, Zhang W T, Wang S Q, Cheng C H K, Li Y Y. 2014b.Evaluation of green algaUlvapertusaas a dietary ingredient for rabbitfishSiganuscanaliculatusjuveniles.J.J.Aquacul.Res.,1(1): 005.
Zhang M L, Sun Y H, Liu Y K, Qiao F, Chen L Q, Liu W T, Du Z Y, Li E C. 2016. Response of gut microbiota to salinity change in two euryhaline aquatic animals with reverse salinity preference.Aquaculture,454: 72-80.
Zhang W. 2012. Primary Study on the Utilization of Macro-AlgaUlvaPertusaas Dietary Ingredient. Shantou University. (in Chinese with English abstract)
猜你喜欢
读书文摘(下半月)(2019年7期)2019-10-21
卷宗(2019年18期)2019-07-11
东坡赤壁诗词(2019年3期)2019-07-05
青年文学家(2018年21期)2018-10-22
艺术科技(2018年4期)2018-07-23
世界家苑(2018年6期)2018-07-23
东坡赤壁诗词(2018年2期)2018-05-10
青年时代(2018年35期)2018-02-24
都市家教·下半月(2017年10期)2017-11-07
戏剧之家(2017年7期)2017-05-12
 Journal of Oceanology and Limnology2018年2期
- Journal of Oceanology and Limnology的其它文章
- An aftereffect of global warming on tropical Pacific decadal variability*
- Analysis of monthly variability of thermocline in the South China Sea*
- A numerical study of the South China Sea Warm Current during winter monsoon relaxation*
- Predicting the sinkage of a moving tracked mining vehicle using a new rheological formulation for soft deep-sea sediment*
- Chemical characterization of fractions of dissolved humic substances from a marginal sea—a case from the Southern Yellow Sea*
- The morphological and molecular detection for the presence of toxic Cylindrospermopsis (Nostocales, Cyanobacteria) in Beijing city, China*