
Transient aerodynamic characteristics of vans during the accelerated overtaking process *
2018-05-14 01:43LiningLiu刘立宁XingshenWang王省身GuangshengDu杜广生ZhenggangLiu刘正刚LiLei雷丽
水动力学研究与进展 B辑 2018年2期
Li-ning Liu (刘立宁), Xing-shen Wang (王省身), Guang-sheng Du (杜广生), Zheng-gang Liu (刘正刚),Li Lei (雷丽)
1. School of Energy and Power Engineering, Shandong University, Jinan 250061, China
2. Yantai Nanshan University, Yantai 265713, China
3. School of Traffic and Transportation, Beijing Jiaotong University, Beijing 100044, China
Introduction
With the development of the transport industry,more and more trucks and vans are traveling on the roads, with more frequent overtaking manoeuvres.Since these vehicles have large bodies, the flow around them will be disturbed greatly during the overtaking process, to cause great changes of the aerodynamic forces and moments, which would definitely influence the power performance, the stability,and the fuel economy of vehicles. Noger and Széchényi[1], Noger et al.[2]conducted quasi-static and dynamic tests on the overtaking process between two 1/5-scale Ahmed models in wind tunnels to show how the relative velocity, the transversal spacing and the crosswinds might affect the aerodynamic characteristics of vehicles. Clarke and Filippone[3], Corin et al.[4]simulated the overtaking process based on simple 2-D models, focusing also on the effects of the relative velocity and the transversal spacing, as well as the crosswinds. But their results show that the 2-D simulations would overestimate the Venturi effect between two models and a further 3-D research is needed. Gilliéron[5], Uystepruyst and Krajnović[6]studied the overtaking process of 3-D Ahmed models with a quasi-steady simulation and a dynamic simulation, respectively. It is demonstrated that the results obtained by 3-D approach are more consistent with the experimental values than the 2-D results. Wu et al.[7]conducted a transient simulation on 3-D Ahmed models to examine the influence of the relative and absolute velocities on the aerodynamic characteristics of vehicles. Fu et al.[8]investigated the influence of the longitudinal position of two vehicles during the overtaking process.
In the overtaking process between different types of vehicles, such as a car overtakes a truck, the variations of the aerodynamic forces tend to be more complicated. Gu et al.[9]and Sun et al.[10]simulated the overtaking process on scaled models of car-car and car-truck. Their results indicate that the variations of the aerodynamic forces in a car-car overtaking are significantly different from those in a car-truck overtaking. Noger and Grevenynghe[11], Howell et al.[12]carried out experimental tests on 3-D models to investigate the overtaking process between a light car and a heavy truck. Their results show that the vehicle shape, the transversal spacing and the crosswind greatly influence the aerodynamic characteristics of vehicles. Kremheller[13,14]measured the surface pressure distribution of vehicles during an overtaking process in experiments, and provided useful data to validate CFD results in the future. Bruzelius et al.[15]developed a simple real time model that was able to reproduce the lateral force and yawing moment of the overtaking vehicle in an overtake scenario.
The above researches have a common underlying assumption that the overtaking vehicle overtakes its counterpart with a fixed speed, which might not be the case in practice. For drivers, the acceleration is usually necessary to overtake. For a better understanding of the overtaking process, this paper uses two van models to simulate the uniform and the accelerated overtaking processes, focusing on the effects of the acceleration of the overtaking van on the mutual transient aerodynamic characteristics to provide some guidelines for the safe operation of vehicles during the overtaking process.
1. Numerical simulation
1.1 Governing equations
The external flow around vehicles during the overtaking process is 3-D, viscous, unsteady and incompressible. The generic form in the 3-D Cartesian coordinate system of mass, momentum and energy equations is written as

where ρ is the air density,uis the velocity,tis the time scale, φ represents universal variables, Γ andSare the generalized diffusion coefficient and the source term, respectively. Specifically, the terms in Eq. (1) are, from left to right, the transient term, the convection term, the diffusion term and the source term. The forms of φ, Γ andSdepend on the circumstances[16].
1.2 Geometric model
A full scale van model is used in the simulation,as shown in Fig.1. The overtaking and overtaken vans have same dimensions ofL=8.12 m ,W=2.40 m andH=3.52 m in length, width, and height, respectively. The maximum cross sectionA=8.45 m2,is taken as the surface reference. The Reynolds number based on the width of the model isRe=2.68× 10⁶, for a velocity of 20 m/s. Due to the limits of the computational resource, some detailed parts of the model are simplified, such as the side-view mirror,the doorknob and the chassis are neglected. In addition, the bottom of the tire is set to be flat to make sure that the wheels contact the ground through a plane instead of a point.

Fig.1 Van model for simulation
1.3 Computational domain and mesh method
The computational domain is a cuboid of 27Lin length, 8.5Win width, and 5Hin height, as shown in Fig.2. The coordinate directions are shown in the figure. Two vans moved along the negative direction ofX-axis and the transverse spacing between them isW/2. Van 1 represents the overtaking van, and Van 2 the overtaken one. In the following discussion, the longitudinal distance between the two vans is nondimensionalized toX/L,whereLis the van’s length andXrepresents the longitudinal distance between the fronts of Van 1 and Van 2.
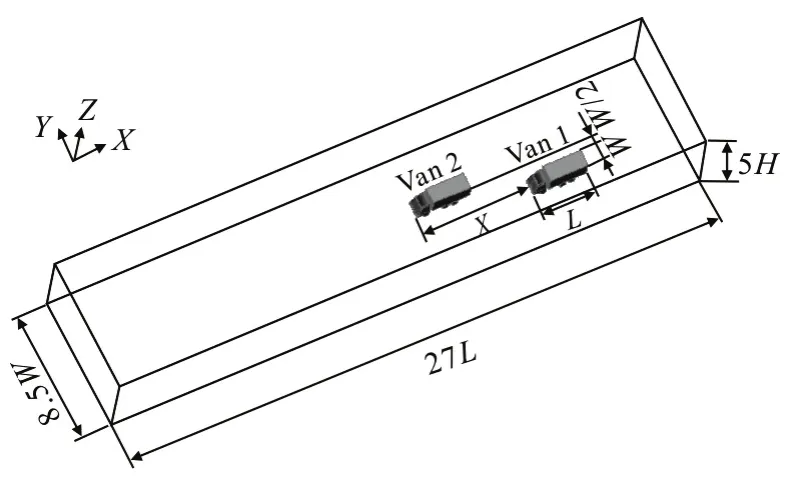
Fig.2 Computational domain
In the numerical simulation, the dynamic mesh and the sliding interface technique are used to update the grids at every time step[17]. A scheme of mixed tetrahedral cells and hexahedral cells is adopted, as shown in Fig.3. The refined tetrahedral cells are around the vans while the coarse hexahedral cells are in the rest region. Zone 1-1, 1-2, and 1-3 form the dynamic mesh region of Van 1, while Zone 2-1, 2-2,and 2-3 form the dynamic mesh region of Van 2. Zone 3 is a stationary mesh region. Data transmission between two regions is realized by a sliding interface.Layering is adopted to update the grids in the dynamic mesh regions. When Van 1 moves forward to overtake Van 2, Zone 1-2 also moves forward with the same velocity, this would compress Zone 1-1 and stretch Zone 1-3, which in consequence merges cells in Zone 1-1 and split cells in Zone 1-3, and then the meshes are rebuilt to continue the calculation. Identical process is taken when Van 2 moves.
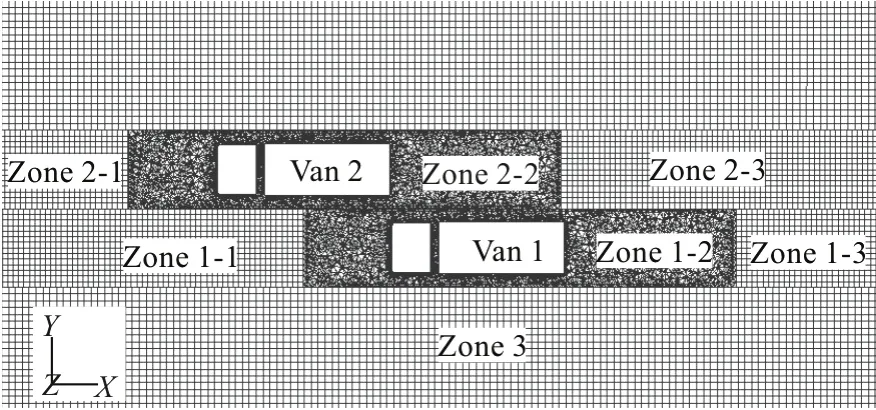
Fig.3 Moving mesh strategy in the overtaking process
1.4 Boundary conditions and numerical method
The inlet and the outlet of the computational domain are located along the van’s moving direction,and their boundary conditions are set as the pressureinlet and the pressure-outlet, respectively. The static pressure on the two boundaries is equal to the atmospheric pressure. The floor and the van body are treated as no-slip wall. Symmetry boundary conditions are adopted on the lateral and roof surfaces. The dynamic mesh and the stationary mesh regions are connected by an interface boundary, while the internal boundary is interpolated within the dynamic mesh region.
A RNGk-ε turbulence model is used in the simulation, whose convective term is solved by the second-order upwind scheme and the pressurevelocity coupling term is solved by the PISO algorithm[18]. The transient overtaking process is simulated with a time step size of 0.005 s.
1.5 Numerical details
This paper only focuses on the overtaking process without consideration of the crosswinds. Case 1 is a uniform overtaking process, Case 2, Case 3 and Case 4 are different accelerated overtaking processes.For Case 1, the initial position of the two vans isX/L=-3 , and the overtaking van and the overtaken van move along the negative direction ofX-axis at constant speeds of 30 m/s and 20 m/s, respectively.For Case 2, Case 3 and Case 4, the overtaking process starts from the position ofX/L=-2. Figure 4 shows the schematic diagram of the accelerated overtaking process. To eliminate the influence of the initial conditions, a preliminary calculation of 2 s is completed before Van 1 starts to accelerate. In this process, Van 1 and Van 2 both move with a velocity of 20 m/s and their longitudinal distance is kept asX/L=-2.After that, Van 1 moves along the negative direction ofX-axis with three different accelerations listed in Table 1. It would speed up to 30 m/s and then overtake Van 2 with this velocity. The moving direction and velocity of Van 2 are kept constant in the whole process.

Table 1 Time and location for Van 1 to complete the acceleration
The value ofX/Lcan be used to describe the overtaking position quantitatively. From Table 1 we can find that the accelerated overtaking processes are always completed within the position range of -1<X/L<1. In order to better reveal the impact of the acceleration on the overtaking process, the following discussion focuses on the aerodynamic characteristics of the vans in the range of -2<X/L<2.
1.6 Definition of aerodynamic force coefficients
The aerodynamic forces and moments of vehicles are referenced to their respective centers of gravity.
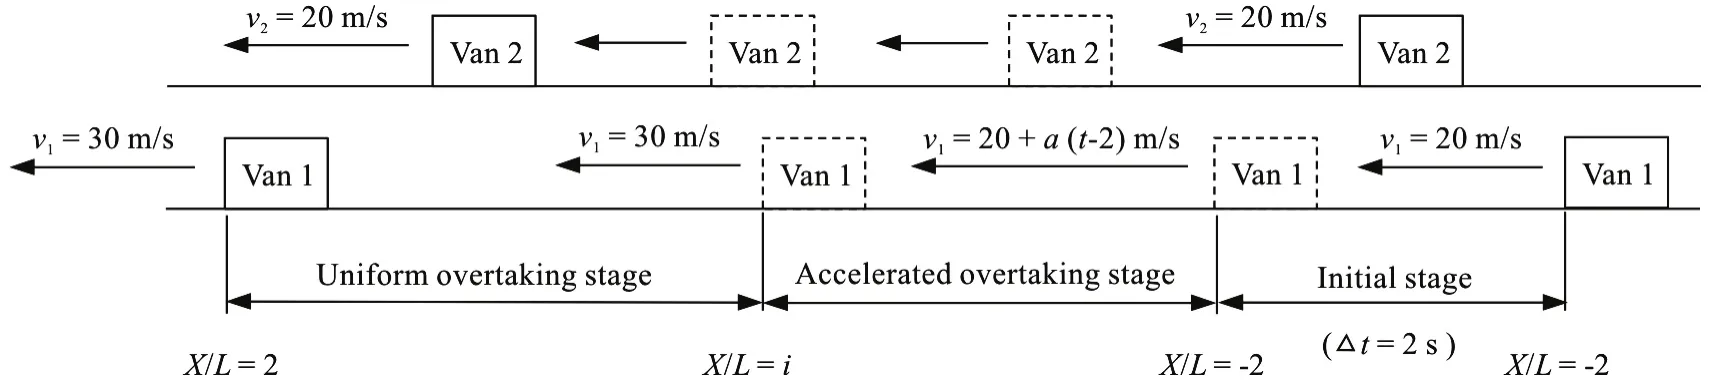
Fig.4 Schematic diagram of the accelerated overtaking process
Non-dimensional coefficients are used to represent the aerodynamic forces and moments during the overtaking process. The drag force coefficientCD, the side force coefficientCSand the yawing moment coefficientCYMare defined as follows:
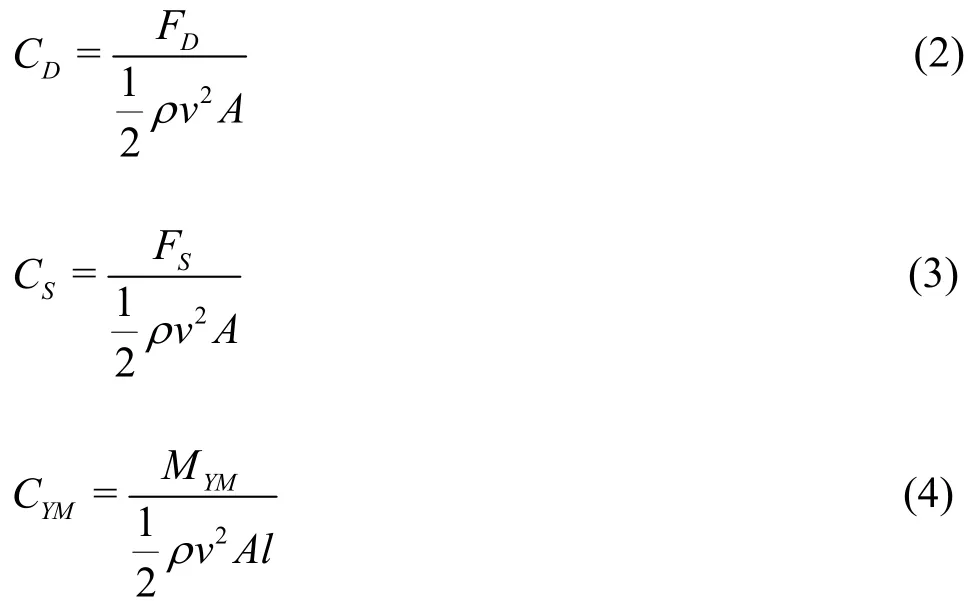
whereFD,FSandMYMrepresent the drag force,the side force and the yawing moment, respectively.The positive direction ofFDis the same as theX-axis, opposite to the direction of vans’ motion. In the same way, the positive direction ofFSis the same as theY-axis and the positive direction ofMYMis anticlockwise around theZ-axis. In the above formulas,vindicates the velocity of the vehicle relative to the flow,lis the characteristic length,equal toW.
2. Results and analyses
2.1 Numerical accuracy
To verify the numerical accuracy, we compare the aerodynamic coefficients of the overtaken van obtained in the simulation with the results of the experiment. The experiment is conducted in the wind tunnel of Shandong University with two simplified 1/10-scale van models. The details of the test can be found in Li[19]. The Reynolds number is 5.75×10⁵based on the width of the van model, with a test speed of 35 m/s. The drag force and side force coefficients of Van 2 in the uniform overtaking process[20]are shown in Fig.5. The dynamic method is used in the simulation, as mentioned in Section 1.5.However, in the experiment, a quasi-steady method is adopted and only the aerodynamic coefficients in the range of -1<X/L<1 are obtained due to some special conditions. It can be seen that the drag force coefficients obtained from the experiment and the simulation have similar variation patterns, and so do the side force coefficients. The error of the absolute values is mainly caused by the application of different methods (dynamic and quasi-steady), as explained in Ref. [19]. From the above discussion, our numerical approach is appropriate.
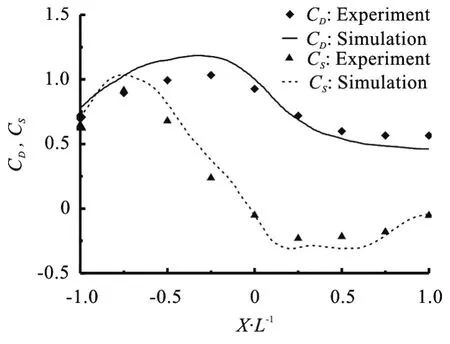
Fig.5 Comparison of experimental results and simulation results (the drag force and side force coefficients on the overtaken van in the uniform overtaking process)
2.2 Comparison of the uniform overtaking and accelerated overtaking processes
Figures 6(a), 6(b) show the variation of the drag force coefficientCDand the side force coefficientCSin the uniform overtaking process (Case 1) and the accelerated overtaking process (Case 2). It can be concluded that the variation patterns of the aerodynamic force coefficients are quite similar in the two cases:CDandCSof Van 2 both change more substantially than those of Van 1. This means that the overtaking process has a greater effect on the overtaken van, as is consistent with the previous research[19]. For the overtaking van, the aerodynamic characteristics are slightly influenced by the change of its speed.CDin Case 2 is a little bit larger than that in Case 1 soon after the overtaking begins, and then this kind of difference decreases until Van 1 finishes accelerating (X/L>1), whenCDassumes the same value. In addition, the values ofCSof the overtaking van in the two cases are close to each other and both of them keep negative during the whole overtaking process, as shown in Fig.6(b).
However, the velocity change of Van 1 has a significant impact on Van 2.CDandCSof the overtaken van both go through an increase-decreaseincrease (increase at first and then decrease and at last increase) variation during the overtaking process.Before Van 1 finishes accelerating,CDandCSof Van 2 in Case 2 are both smaller than those in Case 1.The maximum value ofCD(atX/L=-0.25) in Case 1 is 10.6% higher than that in Case 2 while the maximum value ofCS(atX/L=-0.75) in Case 1 is 15.2% higher than that in Case 2. These discrepancies are so significant that they will defi-nitely influence the aerodynamic characteristics of the overtaken vehicle. So it is important to study the accelerated overtaking process.
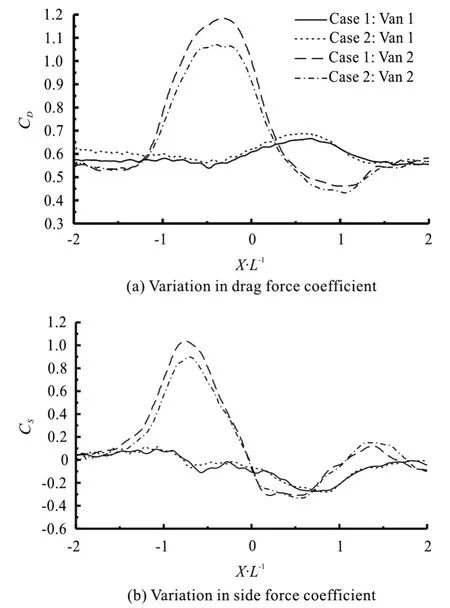
Fig.6 Variations in aerodynamic coefficients of vehicles during the uniform overtaking process (Case 1) and the accelerated overtaking process (Case 2)[21]
2.3 Analyses of the acceleration effects on the aerodynamic characteristics of vehicles
The variations of the aerodynamic coefficients in three accelerated overtaking processes are shown in Fig.7. For the overtaking van, the variations ofCD,CSandCYMare quite small among the three cases,which means that the velocity changes of the overtaking van have little effect on the aerodynamic characteristics of the van itself. In contrast, the parameters of the overtaken van change a great deal as the overtaking van’s acceleration increases, which are mainly discussed as follows.
Before the front end of Van 1 approaches the rear of Van 2, the drag force coefficient of Van 2 keeps constant. But when Van 1 is about to catch up with Van 2, the value ofCDof Van 2 begins to increase and is different in the three cases. As can be seen from Fig.7(a), the value ofCDof Van 2 rises as the acceleration of Van 1 increases. In all three cases,CDalways takes its maximum value atX/L=-0.25,and the maximum values in Case 3 and Case 4 are 6.6% and 10.4% larger than that in Case 2, respectively. AfterX/L=-0.25,CDof Van 2 starts to decrease, and the difference among the three cases vanishes slowly. In the positions ofX/L>0, the variation curves ofCDin Case 3 and Case 4 are almost overlap, for the overtaking van in Case 3 is accelerated to the same speed in Case 4 and then has a similar impact on the overtaken van. In Case 2, Van 1 does not finish accelerating until its rear overtakes the front end of Van 2. This makes the value ofCDof Van 2 in Case 2 smaller than those in Case 3 and Case 4. When Van 1 completes its accelerating process, the drag force coefficients of Van 2 are approximately equal to each other in the three cases.

Fig.7 Variation in aerodynamic coefficients of vehicles during three different accelerated overtaking processes
During the overtaking process, the side force coefficient of Van 2 fluctuates a great deal and changes direction several times. As Van 1 gets closer,the value ofCSof Van 2 starts to increase along the positive direction ofY-axis, but the gradients are different in the three cases. The value ofCSof Van 2 has a more rapid increase and takes a larger maximum value when the acceleration of Van 1 increases.Specifically, the positive peaks ofCSappear atX/L=-0.75, and the values in Case 3 and Case 4 are 6.7% and 14.4% higher than that in Case 2,respectively. After that moment, the three curves ofCSdecline with different slopes. When the front ends of the two vans are in parallel with each other, the value ofCSchanges sign in all cases, and is in a similar pattern (increase along the negative direction ofY-axis at first and then decrease) in Case 3 and Case 4 since Van 1 in these two cases finishes accelerating at this moment. In Case 2, the overtaking van does not stop accelerating untilX/L>1, and the value ofCSof Van 2 is always smaller than those in other two cases. The side force of Van 2 reverses its direction again soon after the overtaking is completed,with some fluctuations before decreasing to 0.Anyway, the direction changes of the side force will affect the overtaken van through the interaction of attracting and repulsing, which can seriously affect the stability of the vehicle.
The yawing moment coefficientsCYMof Van 1 and Van 2 in all three cases are shown in Fig.7(c). It can be seen that the values ofCYMof two vans are nearly zero beforeX/L=-1, but they vary gradually after the front end of Van1 aligns with the rear of Van 2. The value ofCYMof Van1 increases and keeps at a high level in the anticlockwise direction when-0.75<X/L<0.25, consequently, the front end of Van 1 is pushed outward while the rear of Van 1 is pulled inward. Simultaneously, the value ofCYMof Van 2 reaches its first positive peak aroundX/L=-1, and then decreases with its sign reversed atX/L=-0.75. ItsCYMgoes through an increase decrease process in the clockwise direction aroundZ-axis at -0.75<X/L<0.25. In other words,during this process, the front ends of the two vans tend to get farther away from each other but the rears of the two vans tend to get closer. This might probably cause a crash if the space between the two vans is small,especially when at the position ofX/L=-0.25,both values ofCYMof Van 1 and Van 2 are very large. The yawing moment of Van 1 turns to the clockwise direction after its half body passes Van 2(X/L> 0.5). At this moment, the direction ofCYMof Van 2 turns to the anticlockwise direction, which makes the front end of Van 2 move close to Van 1. A scarping between two vehicles is likely to happen if their space is not large enough. What is more, the value ofCYMof Van 1 changes little in all cases while a positive correlation is found between the value ofCYMof Van 2 and the acceleration of Van 1.
Above all, in an accelerated overtaking process,the variation of the overtaking van’s acceleration has no significant effect on its own aerodynamic characteristics, but has a great influence on the overtaken van. The larger the acceleration of Van 1, the greater the aerodynamic coefficients of Van 2, then the more serious the degradation of the dynamic property and the stability will be.
2.4 Analysis of pressure field
From the above analysis, it can be concluded that the differences of the aerodynamic characteristics among the three cases mainly occur in the position range of -1<X/L<0. In order to reveal the mechanism that affects the vehicles’ aerodynamic characteristics, the pressure fields at several key positions are presented here. Figures 8, 9 show the pressure contours at theXYplane ofZ=1.4 m in Case 2 and Case 4. In the pictures, the white shadow on the left represents the overtaking van, and the white shadow on the right represents the overtaken van.
As shown in Figs. 8, 9, a large positive pressure zone is formed in front of the overtaking van. At the position ofX/L=-1, this positive pressure zone has an impact on the rear of the overtaken van, who will be deflected by an instantaneous positive yawing moment. The differential pressure on both sides of the overtaken van induces a positive side force to make it tend to be pulled off the overtaking van. In the meantime, the negative pressure zone on the right side of Van 1 strengthens the negative pressure behind Van 2, which increases the pressure drag and the drag force coefficient of Van 2. However, the aerodynamic characteristics of Van 2 under different accelerating conditions see no evident changes since the flow fields around the two vehicles vary little.
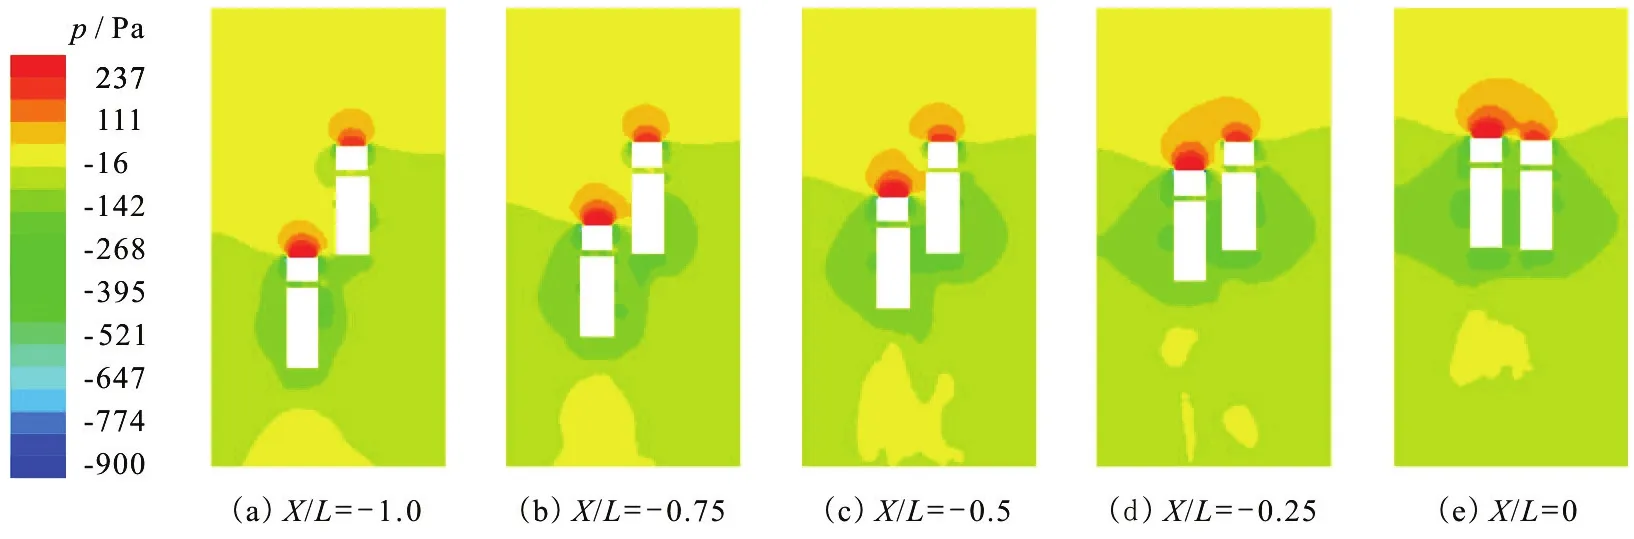
Fig.8 (Color online) Pressure contours at different positions in Case 2 (horizontal section Z =1.4 m )
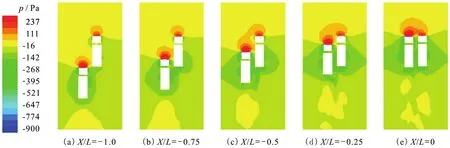
Fig.9 (Color online) Pressure contours at different positions in Case 4 (horizontal section Z =1.4 m )
As the overtaking process continues, a gap is formed between the two vans. The air flow speeds up and the pressure declines in the gap. As the acceleration of Van 1 increases, the negative pressure in the gap is strengthened and the positive pressure zone in front of the vehicles expands. When Van 1 passes Van 2, the positive pressure zone and the negative pressure zone are successively sweeping Van 2 from back to front, changing the side force and the yawing moment of Van 2 significantly. The larger the acceleration of Van 1, the greater the influence on Van 2, and the more intense changes of the aerodynamic coefficients will be. At the position ofX/L=-0 .25, the overtaken van has a positive pressure zone on its left front and a negative pressure zone on its right back,which will lead to a deflection of its body and result in a negative peak value ofCYM. In addition, from Figs.8(d), 9(d), it can be seen that the positive pressure zones in front of Van 1 and Van 2 are integrated and expanded. With a great negative pressure behind Van 2, the pressure drag on Van 2 is very large. SoCDof Van 2 takes the maximum value at this moment and the maximum value increases as the acceleration of Van1 increases.
At the position ofX/L=0, the front ends of two vans are parallel and the positive pressure zones in front of them are totally integrated. The trailing vortices behind Van 1 and Van 2 are also integrated,which makes the negative pressure behind the vehicles very large. These changes are strengthened as the acceleration of Van 1 increases, so the drag force coefficient of Van 2 in Case 4 is slightly greater than that in Case 2. However, the side force coefficients of Van 2 in the two cases are both approximately equal to 0 since the pressure difference between the left and right sides is very small.
3. Conclusions
In this paper, the accelerated overtaking process is studied by using two full scale van models. The dynamic meshes and the sliding interface technique are applied in the transient 3-D numerical simulations.
Firstly, the uniform overtaking process is simulated by using the RANS approach, and the aerodynamic coefficients of the overtaken van are compared with the experimental data, to show the reliability of the simulation.
Secondly, the uniform overtaking process is compared with an accelerated overtaking process in which the overtaking van’s acceleration is 2 m/s2. It is indicated that the overtaking van’s acceleration variation has little effect on the van itself but has a great influence on the overtaken van. In particular, the differences in the maximum drag force coefficient and the side force coefficient of the overtaken van in the two cases are up to 10.6% and 15.2%, respectively,which means that it is important to investigate the accelerated overtaking process.
Then, three different accelerated overtaking processes are simulated to see the influence of the acceleration on the aerodynamic characteristics of vehicles.It is shown that the aerodynamic coefficients of the overtaking van vary little for different accelerations,but the aerodynamic coefficients of the overtaken van vary significantly. The drag force, side force and yawing moment coefficients of the overtaken van increase with the increase of the overtaking van’s acceleration, especially at the peak of each coefficient.In the three cases, the maximum aerodynamic coefficients of the overtaken van appear at the same positions, and the greater the acceleration, the larger the maximum values will be. Compared with the overtaking van, the coefficients of the overtaken van have a wider fluctuation range, and in consequence,the stability of the overtaken van will be more affected by the acceleration of the overtaking van. Therefore,during the overtaking process, the driver of the overtaking vehicle shall pay more attention to the acceleration while the driver of the overtaken vehicle needs to correct his steering appropriately to avoid deflection.
[1] Noger C., Széchényi E. Experimental study of the transient aerodynamic phenomena generated by vehicle overtaking [C].Eighth International Conference on Flow-Induced Vibrations (FIV), Paris, France, 2004.
[2] Noger C., Regardin C., Széchényi E. Investigation of the transient aerodynamic phenomena associated with passing manoeuvres [J].Journal of Fluids and Structures, 2005,21(3): 231-241.
[3] Clarke J., Filippone A. Unsteady computational analysis of vehicle passing [J].Journal of Fluid Engineering, 2007,129(3): 359-367.
[4] Corin R. J., He L., Dominy R. G. A CFD investigation into the transient aerodynamic forces on overtaking road vehicle models [J].Journal of Wind Engineering and Industrial Aerodynamics,2008, 96(8-9): 1390-1411.
[5] Gilliéron P. Detailed analysis of the overtaking process [J].Journal of Mechanical Engineering, 2003, 54(1): 1-16.
[6] Uystepruyst D., Krajnović S. Numerical simulation of the transient aerodynamic phenomena induced by passing manoeuvres [J].Journal of Wind Engineering and Industrial Aerodynamics, 2013, 114: 62-71.
[7] Wu Y. Z., He B. Q., Fu L. M. Influence of velocity on transient aerodynamic characteristics of overtaking and overtaken vehicles [J].Journal of Jilin University (Engineering and Technology Edition), 2007, 37(5):1009-1013(in Chinese).
[8] Fu L. M., He B. Q., Wu Y. Z. et al. Research on aerodynamic characteristics during the vehicle overtaking process [J].Acta Aerodynamica Sinica, 2007, 25(3):351-356(in Chinese).
[9] Gu Z. Q., Jiang B., He Y. B. et al. Numerical simulation on the change of external flow field during vehicle overtaking based on SST turbulence model [J].Automotive Engineering, 2007, 29(6): 494-496, 527(in Chinese).
[10] Sun L., Gu Z. Q., Yang Y. et al. Analysis of transient aerodynamic characteristics of overtaking and overtaken vehicles [J].Journal of Central South University (Science and Technology), 2011, 42(9): 2681-2686(in Chinese).
[11] Noger C., Grevenynghe E. V. On the transient aerodynamic forces induced on heavy and light vehicles in overtaking processes [J].International Journal of Aerodynamics, 2011, 1(3-4): 373-383.
[12] Howell J., Garry K., Holt J. The aerodynamics of a small car overtaking a truck [J].SAE International Journal of Passenger Cars-Mechanical Systems, 2014, 7(2):626-638.
[13] Kremheller A. Aerodynamic interaction effects and surface pressure distribution during on-road driving events [J].SAE International Journal of Passenger Cars-Mechanical Systems, 2015, 8(1): 165-176.
[14] Kremheller A. Experimental investigation of aerodynamic effects during overtaking and passing maneuvers [C].IMechE International Vehicle Aerodynamics Conference,Leicester, UK, 2014, 31-41.
[15] Bruzelius F., Uystepruyst D., Jacobson B. et al. A simple real-time aerodynamic model for vehicles in overtaking situations [J].International Journal of Vehicle Systems Modelling and Testing, 2013, 8(3): 241-259.
[16] Wang F. J. Analysis of computational fluid dynamics [M].Beijing, China: Tsinghua University Press, 2004(in Chinese).
[17] Li L., Du G. S., Liu Z. G. et al. The transient aerodynamic characteristics around vans running into a road tunnel [J].Journal of Hydrodynamics, 2010, 22(2): 283-288.
[18] Liu Z. H., Wang B. L., Peng X. X. et al. Calculation of tip vortex cavitation flows around three-dimensional hydrofoils and propellers using a nonlineark-εturbulence model [J].Journal of Hydrodynamics, 2016, 28(2):227-237.
[19] Li L. Research on vehicle’s transient aerodynamic characteristics at special running situations [D]. Doctoral Thesis,Jinan, China: Shandong University, 2010(in Chinese).
[20] Liu L., Sun Y., Chi X. et al. Transient aerodynamic characteristics of vans overtaking in crosswinds [J].Journal of Wind Engineering and Industrial Aerodynamics, 2017,170: 46-55.
[21] Liu L. N., Du G. S., Fan P. F. Research on transient aerodynamic characteristics of vehicles during the uniform and accelerated overtaking process [C].Proceedings of the 14th National Congress on Hydrodynamics and the 28th National Conference on Hydrodynamics, Changchun,China, 2017, 772-777(in Chinese).
- 水动力学研究与进展 B辑的其它文章
- Revisit submergence of ice blocks in front of ice cover-an experimental study *
- Analytical approach to entropy generation and heat transfer in CNT-nanofluid dynamics through a ciliated porous medium *
- Couple stress fluid flow in a rotating channel with peristalsis *
- 2-D eddy resolving simulations of flow past a circular array of cylindrical plant stems *
- Energy dissipation of slot-type flip buckets *
- Some notes on numerical simulation and error analyses of the attached turbulent cavitating flow by LES *