
Exploring the relationship between the cloud-top and tropopause height in boreal summer over the Tibetan Plateau and its adjacent region
2018-05-24 01:41SHIChunHuCHANGShuJieGUODongXUJinJunndZHANGChenXin
SHI Chun-Hu, CHANG Shu-Jie,, GUO Dong, XU Jin-Jun nd ZHANG Chen-Xin
aKey Laboratory of Meteorological Disaster, Ministry of Education/Joint International Research Laboratory of Climate and Environment Change/Collaborative Innovation Center on Forecast and Evaluation of Meteorological Disasters, Nanjing University of Information Science and Technology, Nanjing, China; bSouth China Sea Institute of Marine Meteorology, Guangdong Ocean University, Zhanjiang, China
1. Introduction
Deep convection with a cloud-top height above 14 km is de fined as ‘overshooting convection’, because the tropical tropopause layer (TTL) can extend from 14 km to about 18 km (Sherwood and Dessler 2000). According to the de finition, overshooting convection has an important effect on stratosphere–troposphere exchange (STE). Overshooting convection occurs more frequently over the Intertropical Convergence Zone (ITCZ) and South Pacific Convergence Zone (Alcala and Dessler 2002). Moreover, 3% of thick clouds can penetrate the TTL (Dessler, Palm, and Spinhirne 2006). In addition, some scholars have studied the STE,which may accompany overshooting convection, during the cut-off low and mesoscale convective complex periods over East Asia (Chen, Lü, and Chen 2014; Li and Bian 2015; Li, Bian, and Fan 2015; Shi, Cai, and Guo 2017; Shi et al. 2014).
Cloud-top above the tropopause (CTAT) events in the low latitudes are often associated with strongly developed deep convective systems (Wang and Dessler 2012), which can easily achieve STE. However, ordinary convection needs the help of large-scale circulation to complete STE,because the out flow area of the cloud anvil is usually below the tropopause. The large-scale circulation of the Asian summer monsoon can collect water vapor transported by convection and strengthen the upward transport of the atmospheric composition (Gettelman et al. 2004; Park et al. 2007). Also, the Asian monsoon region contributes 75%of the global troposphere-to-stratosphere transport (TST)of water vapor in summer (Dessler and Sherwood 2004;Gettelman et al. 2004). Subsequently, Tian et al. (2011),Bian et al. (2012), Bian, Fan, and Yan (2013), Yan et al. (2015),and Shi, Zhang, and Guo (2017) have further con firmed the effect of large-scale circulation from observations of water vapor and ozone in the upper troposphere and lower stratosphere over the Tibetan Plateau. Amongst other factors,STE is also related to the change in ozone and tropopause temperature (Xie, Tian, and Chipper field 2008; Xie et al.2014).
Although CTAT is an important index for STE, little is known about the characteristics of CTAT over the Tibetan Plateau and its adjacent region. Consequently, in the current study, we analyze the relationship between cloud-top and tropopause height to con firm the CTAT frequency over the Tibetan Plateau and its adjacent region in summer.Section 2 describes the datasets and methods. Section 3 presents the summertime characteristics of CTAT in the boreal tropics and subtropics. Section 4 reports the cloudtop distribution over the Tibetan Plateau and its adjacent region in summer. Section 5 provides conclusions and discussion.
2. Data and methods
2.1. Data
The cloud-top height data used in this study are from the Level 2 products of CALIPSO (Cloud–Aerosol Lidar and Infrared Path finder Satellite Observations) between 2008 and 2012. CALIOP (Cloud–Aerosol Lidar with Orthogonal Polarization) is a two-wavelength polarization-sensitive light detection and ranging instrument that provides high-resolution vertical pro files of aerosols and clouds.CALIOP uses three receiver channels: one measuring the 1064-nm backscattered intensity, and another two measuring the orthogonally polarized components of the 532-nm backscattered intensity (Stephens et al. 2002).
The tropopause information given in the CALIPSO cloud-layer data product is based on the Goddard Earth Observing System Model Version 5 (GEOS5) (Suarez et al.2008). The zonal wind and potential vorticity data, whose horizontal resolution is 1° × 1°, are from ERA-Interim (Dee et al. 2011). The relative vorticity and divergence, used to calculate the stream function and velocity potential, are also from ERA-Interim.
2.2. Methods
The thermodynamic tropopause is from GEOS5. The dynamic tropopause, de fined as 2–4 potential vorticity units (PVU; 1 PVU = 10−6m2s−1K kg−1), is from ERA-Interim.
The top layer, with ‘Integrated_Attenuated_Backscatter_532’ greater than 0.01 sr−1km−1, is recognized as the cloud top (Biondi et al. 2012; Dessler 2009). A CTAT event is identified when the height of the cloud top is 500 m greater than the GEOS5 thermodynamic tropopause height.
The cloud-top height and CTAT are recognized every 500 m vertically. In the horizontal direction, the observation pro files are analyzed in each 4° × 2° longitude and latitude grid, which means there are roughly 2000–3500 pro files in each grid in most areas to the south of 55°N.The frequency of occurrence for CTAT is then de fined as the ratio of the number of pro files where CTAT happens to the total pro file number in each grid.
All CTAT results are at nighttime, because the frequency patterns are similar in daytime as they are at nighttime(Figure 1), but are more reliable at nighttime (Dessler 2009). CTAT frequency patterns are bimodal both in daytime and at nighttime (Figure 1). The peaks are located at 10°–20°N and near 50°–60°N (Figure 1). In other words,the difference in CTAT frequency between daytime and nighttime is in magnitude rather than pattern. Particularly,the CTAT peak in the ITCZ is underestimated in daytime,which may be related to the solar background noise during CALIPSO’s daytime detection. Thus, detection at nighttime is more reliable (Dessler 2009).
Stream functionψand velocity potentialχcan be used to separate horizontal general circulation into rotational and divergent components. The rotational flow,Vψ=k× ∇ψ, moves along the contours of the stream function; and the divergent wind,Vχ= −∇χ, moves along the gradient of velocity potential.
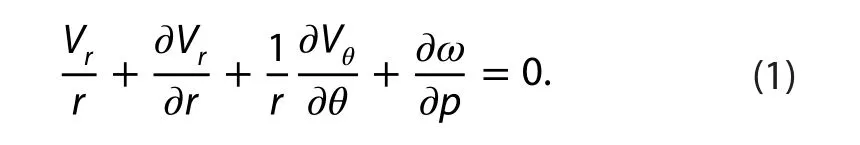
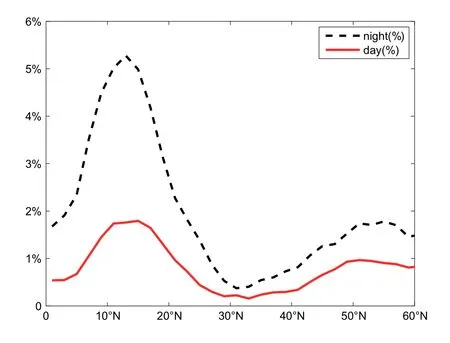
Figure 1. Total frequency of zonal-mean CTAT (daytime in red and nighttime in black; units: %) in boreal summer (June–July–August) 2008–2012 from CALIPSO.
Consider the continuous equation in the cylindrical coordinate system:HereVr,Vθ, andωare radial velocity, tangential velocity,and vertical velocity, respectively. In the Asian summer monsoon region, we assume the rotational flow (tangential velocity) is uniform, and the radial velocity in the ideal cylindrical coordinates is close to the divergence wind. Thus, the horizontal divergence is mainly caused by the divergent wind and the divergence of the tangential velocity is ignored approximately. If the vertical velocityωis assumed to be reduced from 1ωat 200 hPa toα ωat 150 hPa (0 <α< 1), then the vertical velocity at 200 hPa can then be obtained as follows:
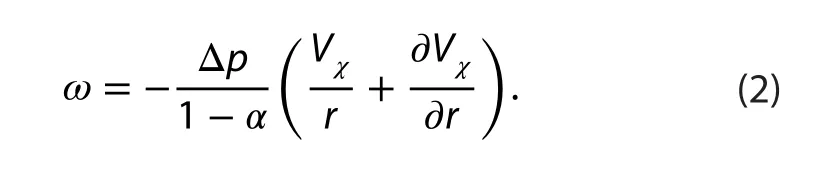

Figure 2. Thermodynamic tropopause height (pink contours; units: km) from GEOS5, stream function (units: 107 m2 s−1) at 200 hPa (black)from ERA-Interim, and area-weighted CTAT total frequency (shading; units: %) from CALIPSO in boreal summer (June–July–August)2008–2012.

3. Summer CTAT characteristics in the boreal tropics and subtropics
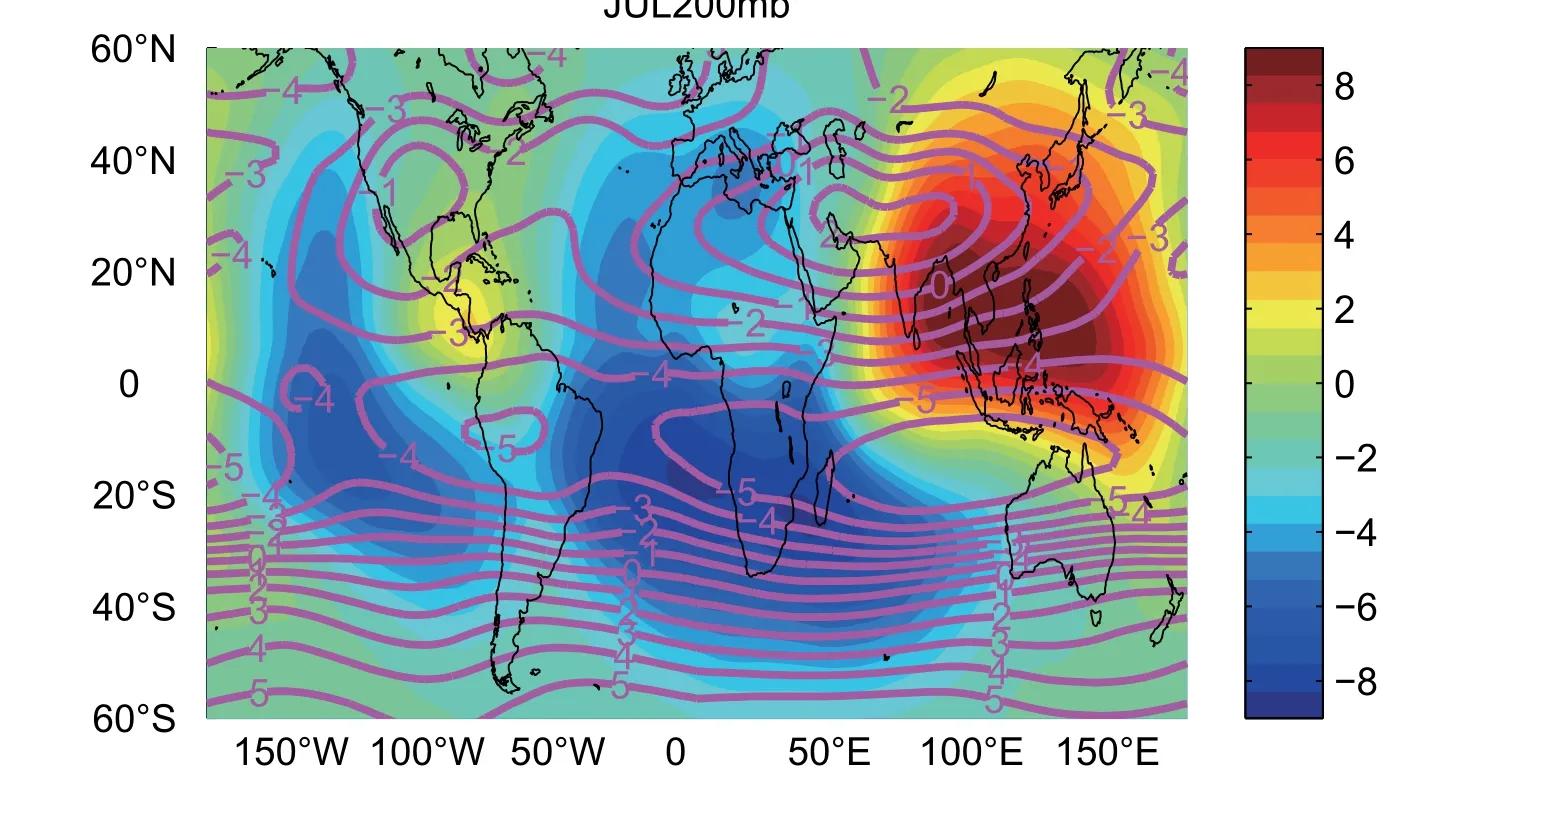
Figure 3. Stream function (contours; units: 107 m2 s−1) and velocity potential (shading; units: 106 m2 s−1) at 200 hPa in boreal summer(June–July–August) 2008–2012 from ERA-Interim.
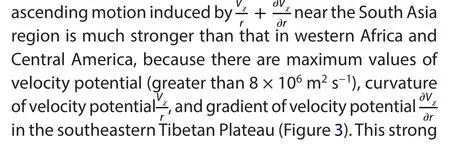
CTAT has the largest probability of occurrence in the ITCZ,according to the total vertical cumulative frequency of CTAT in boreal summer (Figure 2). Furthermore, the zonal distribution of CTAT frequency is uneven and there are three regions with maximum CTAT frequency. The largest region is the Asian summer monsoon region, with the maximum frequency of CTAT reaching 22%, extending from the Indian Peninsula to the east of the Philippines(Park et al. 2007). Another two regions are in Central America, with the frequency reaching 20%, and in western Africa, with the frequency reaching 16%. The regional contributions of the total CTAT frequency in the Asian summer monsoon region, Central America, and western Africa to the total CTAT frequency of the Northern Hemisphere are 49.0%, 13.5%, and 12.4%, respectively (Table 1). Moreover,the largest velocity potential is in a similar area to the Asian summer monsoon region, corresponding to the location of the largest CTAT frequency (Figure 3).
The CTAT characteristics in the Asian summer monsoon region are related to the regional circulation. The thermodynamic tropopause height inside the Asian summer monsoon anticyclone (ASMA) is generally above 16.5 km,and even reaches 17 km in some places where the tropopause is the highest in the world (Figure 2). The average ascending motion area coincides with the maximum CTAT frequency (Figures 2 and 3). Since the speed and material concentration (water vapor and aerosol) of transport controlling the TST are both large in the southeastern Tibetan Plateau, the regional contribution to the global TST will be much greater than 50%.
The maximum CTAT frequency in the Asian monsoon region is not fully consistent with the center of the ASMA(Figure 2) for interactions between the large-scale circulation and deep convection in the southeastern Tibetan Plateau. Gettelman et al. (2004) argued that the large-scale circulation can collect an atmospheric composition transported by deep convection and enhance the TST. James et al. (2008) proved that transport by large-scale circulation is more effective than that by convection at 100 hPa.Therefore, atmospheric compositions with high concentrations can be transferred from convection centers over the Bay of Bengal at and below 200 hPa to the ASMA center at 100 hPa (Park et al. 2007).
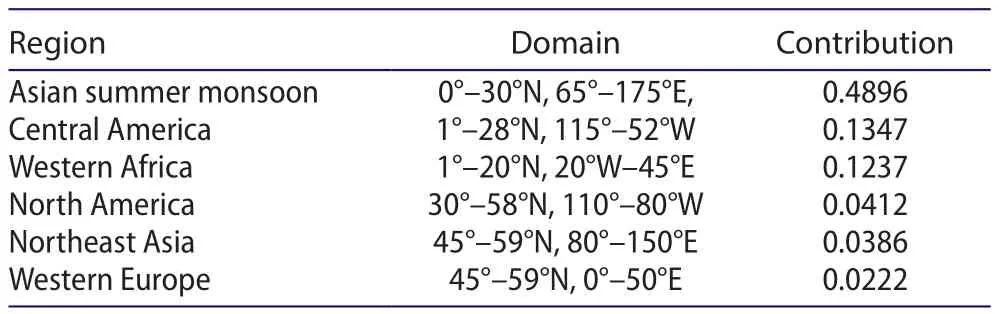
Table 1. Regional contributions of total CTAT frequency in the Northern Hemisphere in summer (June–July–August) 2008–2012 from CALIPSO.
4. Unique distribution of cloud-top height near the Tibetan Plateau region in summer
The frequency of CTAT occurrence over the Tibetan Plateau and its adjacent region is very special in terms of its intensity and position (Figure 4). CTAT occurs more frequently in the south of the Tibetan Plateau (>4%/500 m) than in the zonal mean (no more than 2%/500 m). The frequency of CTAT is centered on the climatic tropopause height in low latitudes. The zonal-mean maximum CTAT frequency extends northward from the equator to 20°N, but the maximum CTAT frequency near the Tibetan Plateau is located within 0°–30°N.

Figure 4. (a) Zonal-mean CTAT frequency (shading; units: %/500 m) and tropopause height (red line) in boreal summer (June–July–August) 2008–2012. (b) As in (a) but for the 70°–100°E mean, with topography along 85°E in black.
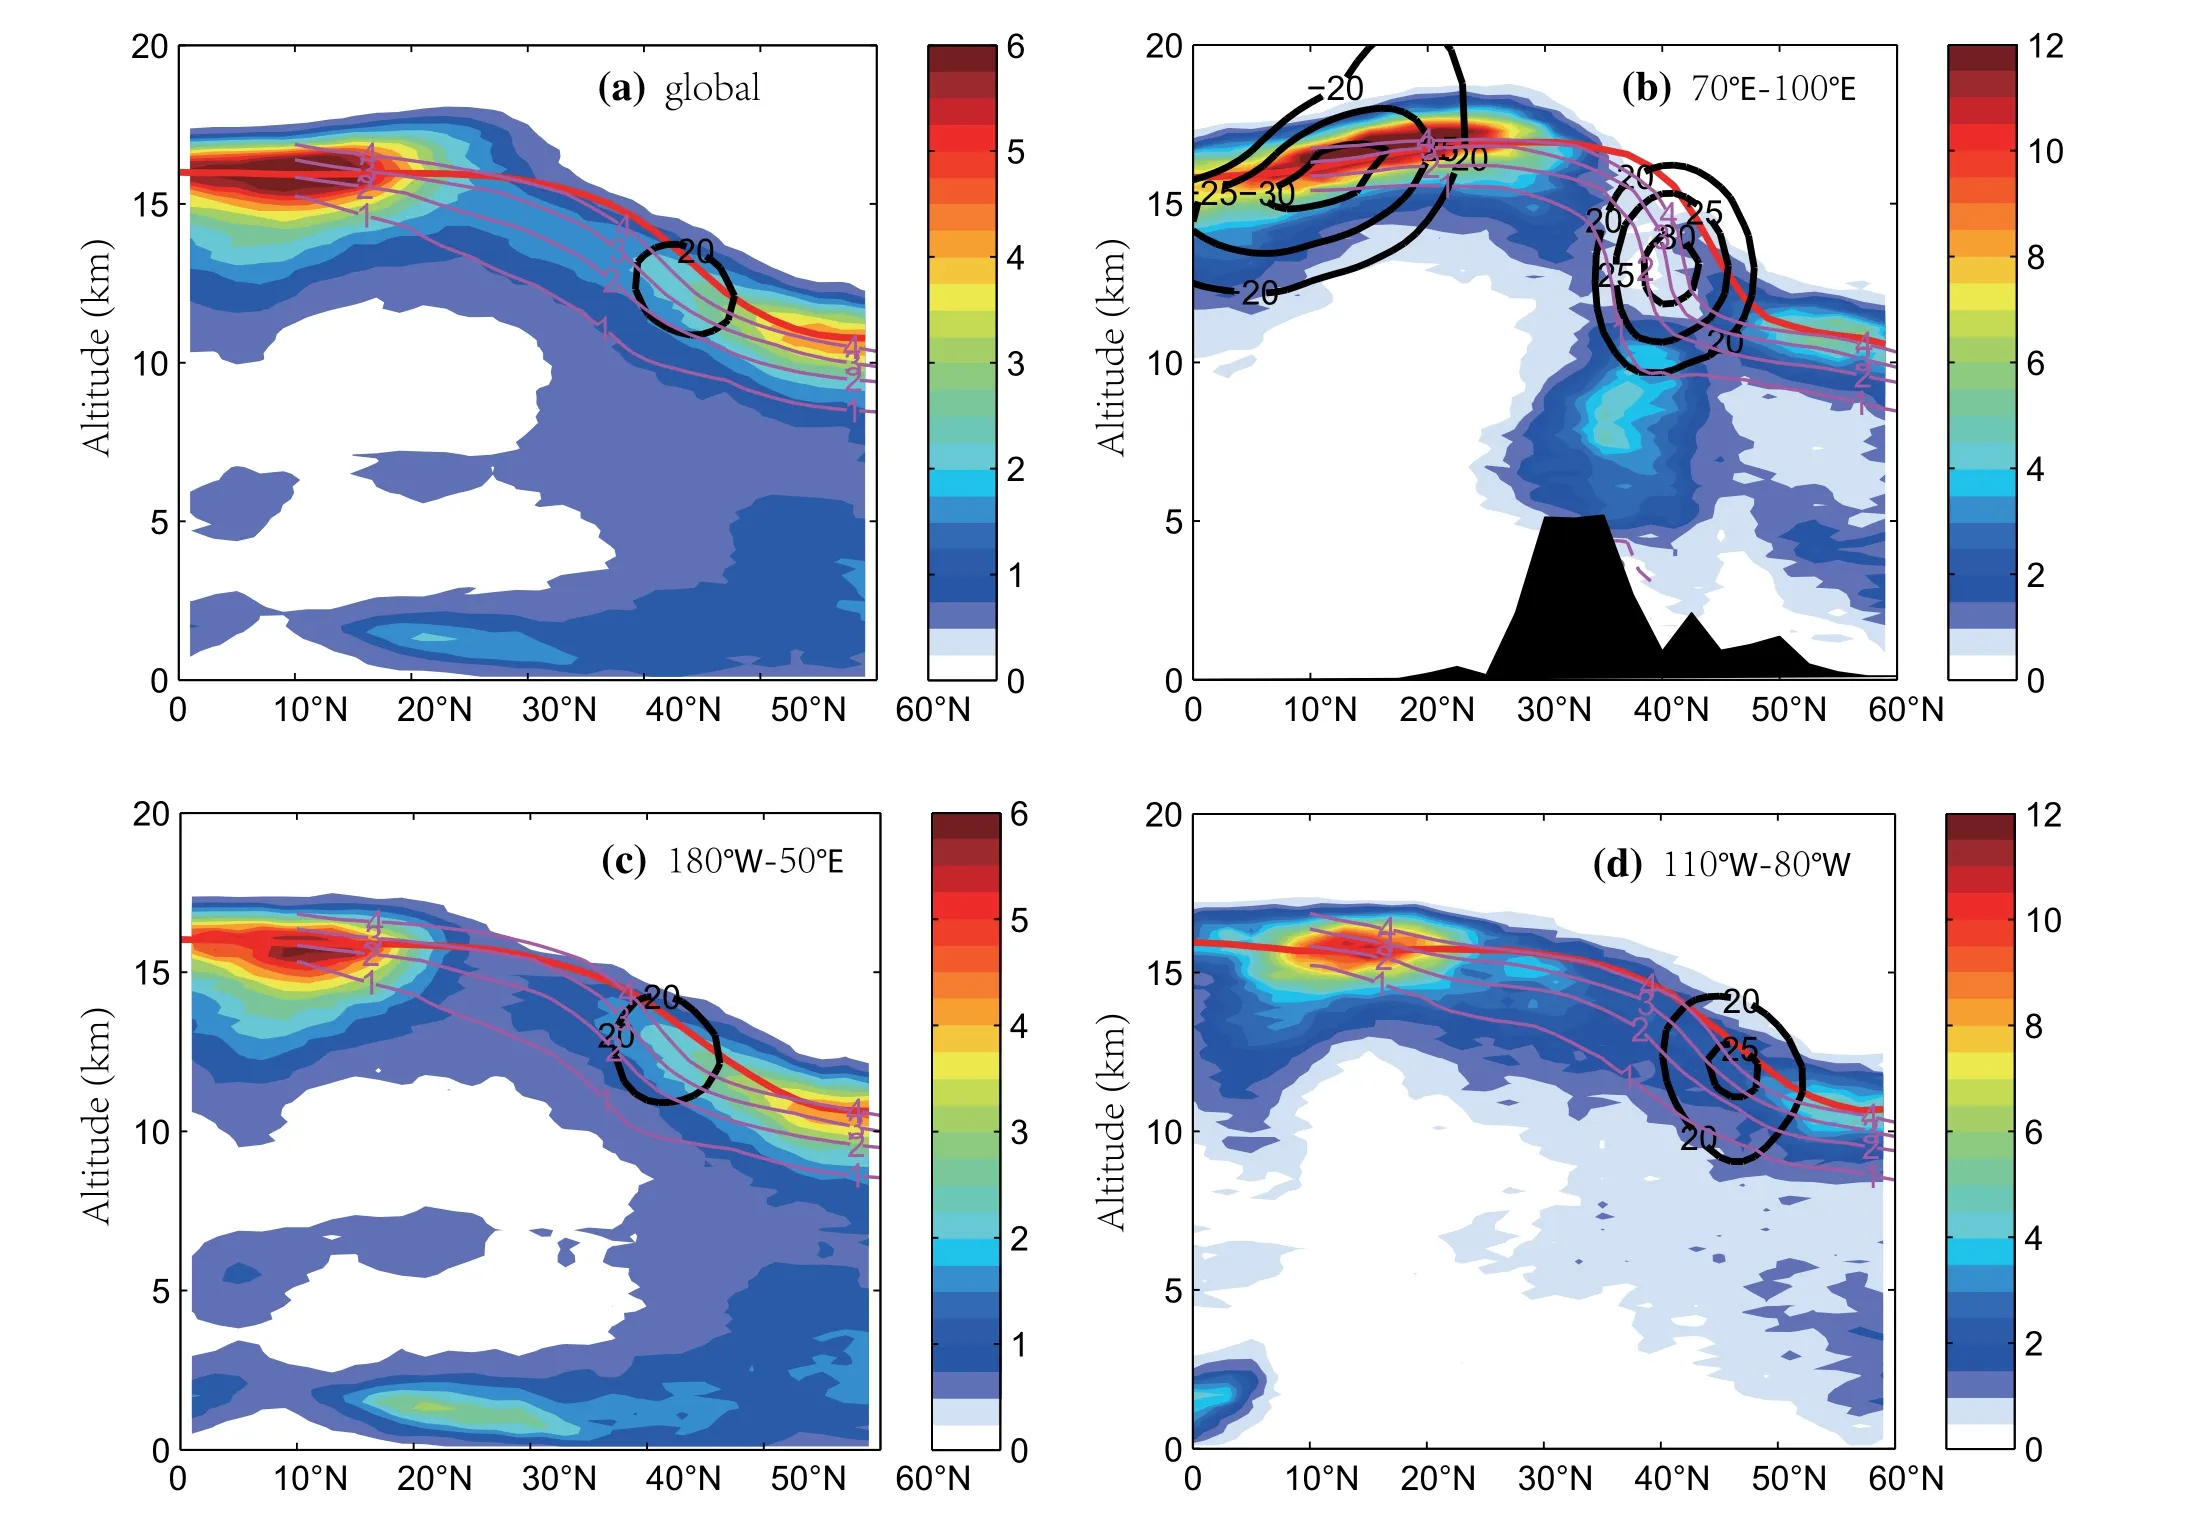
Figure 5. (a) Zonal-mean frequency of relative cloud top (shading; units: %/500 m), potential vorticity (pink; units: PVU), zonal wind(black; units: m s−1), and zonal-mean tropopause height (red) in boreal summer (June–July–August) 2008–2012. (b) As in (a) but for the 70°–100°E mean, with topography along 85°E in black. (c, d) As in (a) but for the 180°W–50°E and 110°–80°W mean, respectively.
To understand the regional characteristics of CTAT events, we analyze the distribution of cloud-top height,because the occurrence of CTAT is closely related to the height of the cloud top. We compare the vertical structure of the frequency of cloud-top height over the Tibetan Plateau and its adjacent region (70°–100°E; Figure 5(b)), outside the Asian summer monsoon circulation(180°W–50°E; Figure 5(c)), in Central America (110°–80°W;Figure 5(d)), and the zonal average, which is mainly along the tropopause height, especially in the tropics (Figure 5(a)).
The relationship between the positions of the cloud top and the tropopause over the Tibetan Plateau and its adjacent region (Figure 5(b)) is very different from that outside the Asian summer monsoon region (Figure 5(c)) and in Central America (Figure 5d). Due to the control of the ASMA, the easterly jet and westerly jet lie on the south side and over the Tibetan Plateau (Figure 5(b)), respectively.The maximum winds in the two jet cores are greater than 30 m s−1, and the position of the easterly jet core is higher than that of the westerly jet core. Furthermore, the height of the thermodynamic tropopause between these two jets is nearly 17 km higher than the two jets. The maximum cloud-top frequency of greater than 10%/500 m is along the tropopause (16.5 km) in the easterly jet core. Moreover,the height and value of the maximum frequency in the easterly jet core are both greater than those in the other regions. Here, warm and moist water vapor from the Indian Ocean is transported upwards by the Asian summer monsoon circulation system on the south side of the Tibetan Plateau, which is the most active region of deep convection(Wu, Qie, and Yuan 2013). The position of the cloud-top frequency greater than 3%/500 m is suppressed below the westerly jet (11 km), which is far from the thermodynamic tropopause but close to the dynamic tropopause (2 PVU).Compared to the other regions at the same latitude (Figure 5(c) and (d)), the location of the maximum cloud-top frequency is lower (referencing the height of the thermodynamic tropopause), and the maximum frequency is larger and close to 5%/500 m (Figure 5(b)), which agrees with the TRMM observations reported by Wu, Qie, and Yuan (2013).Near the westerly jet, the heights of the thermodynamic tropopause and dynamic tropopause (2–4 PVU contours)are quite different. The dynamic tropopause can represent the tropopause folding near the strong westerly jet better than the thermodynamic tropopause. Furthermore,tropopause folding usually accompanies stratospheric intrusion and dry air from the stratosphere can restrain cloud formation. Therefore, the dynamic tropopause is more appropriate than the thermodynamic tropopause for understanding the distribution of the cloud top over the Tibetan Plateau. Different from the situation near the Tibetan Plateau, the maximum cloud-top frequency of about 4%/500 m is always along the thermodynamic tropopause height outside the Asian summer monsoon region(Figure 5c), especially in the low latitudes of 0°–20°N and mid–high latitudes of 40°–60°N. In the subtropical upper troposphere, the maximum cloud-top frequency is less than 1%/500 m.
5. Conclusion
This study analyzes the distribution characteristics of cloud-top and tropopause height in the tropics and subtropics based on CALIPSO satellite data and GEOS5 reanalysis data in boreal summer. The results can be summarized as follows:
The maximum values of vertical cumulative CTAT frequency are concentrated in three tropical regions: the Asian summer monsoon region, Central America, and western Africa. The contributions of the area-weighted CTAT frequency in the three regions to the Northern Hemisphere are 49.0%, 13.5%, and 12.4%, respectively. Moreover, the global contribution of TST in the Asian monsoon region can be far greater than 50%, according to the analysis of the continuous equation, velocity potential, and divergent wind in ERA-Interim data.
The Asian summer monsoon circulation system controls the cloud-top distribution. On the south side of the Tibetan Plateau, the maximum cloud-top frequency of more than 10% per 500 m vertically is most likely to appear in the core of the easterly jet near the tropopause height(16.5 km). Over the Tibetan Plateau, the maximum cloudtop frequency of greater than 3% per 500 m vertically is suppressed below 11 km, far away from thermodynamic tropopause height but close to the dynamic tropopause height of 2 PVU. In addition, the dynamic tropopause is more appropriate than the thermodynamic tropopause for understanding the cloud-top distribution over the Tibetan Plateau.
Acknowledgments
The authors would like to thank NASA and ECMWF for the data providing.
Disclosure statement
No potential conflict of interest was reported by the authors.
Funding
This work was jointly supported by National Key Research and Development Program of China [grant number 2017YFC1501802]; the National Natural Science Foundation of China [grant number 41375047], [grant number 91537213], and[grant number 41675039].
References
Alcala, C. M., and A. E. Dessler. 2002. “Observations of Deep Convection in the Tropics Using the Tropical Rainfall Measuring Mission (TRMM) Precipitation Radar.”Journal of Geophysical Research Atmospheres107. doi:10.1029/2002JD002457.
Bian, J. C., L. L. Pan, L. Paulik, H. Vömel, H. B. Chen, and D. Lu. 2012.“In Situ Water Vapor and Ozone Measurements in Lhasa and Kunming during the Asian Summer Monsoon.”Geophysical Research Letters39: L19808. doi:10.1029/2012GL052996.
Bian, J. C., Q. Fan, and R. Yan. 2013. “Summertime Stratosphere-Troposphere Exchange over the Tibetan Plateau and Its Climatic Impact.”Advances in Meteorological Science and Technology3 (2): 22–28.
Biondi, R., W. J. Randel, S. P. Ho, T. Neubert, and S. Syndergaard.2012. “Thermal Structure of Intense Convective Clouds Derived from GPS Radio Occultations.”Atmospheric Chemistry and Physics12 (12): 5309–5318.
Chen, D., D. R. Lü, and Z. Y. Chen. 2014. “Simulation of the Stratosphere-Troposphere Exchange Process in a Typical Cold Vortex over Northeast China.”Science China Earth Sciences57(7): 1452–1463.
Dee, D. P., S. M. Uppala, A. J. Simmons, P. Berrisford, P. Poli, S.Kobayashi, U. Andrae, et al. 2011. “The ERA-Interim Reanalysis:Con figuration and Performance of the Data Assimilation System.”Quarterly Journal of the Royal Meteorological Society137: 553–597. doi:10.1002/qj.828.
Dessler, A. E. 2009. “Clouds and Water Vapor in the Northern Hemisphere Summertime Stratosphere.”Journal of Geophysical Research114. doi:10.1029/2009JD012075.
Dessler, A. E., and S. C. Sherwood. 2004. “The Effect of Convection on the Summertime Extratropical Lower Stratosphere.”Journal of Geophysical Research109: D23301.
Dessler, A. E., S. P. Palm, and J. J. Spinhirne. 2006. “Tropical Cloud-Top Height Distributions Revealed by the Ice, Cloud and Land Elevation Satellite (ICESat)/Geoscience Laser Altimeter System (GLAS).”Journal of Geophysical Research111 (D12):4792.
Gettelman, A., D. K. Kinnison, T. J. Dunkerton, and G. P. Brasseur.2004. “Impact of Monsoon Circulations on the Upper Troposphere and Lower Stratosphere.”Geophys Res109.doi:10.1029/2004JD004878.
James, R., M. Bonazzola, B. Legras, K. Surbled, and S. Fueglistaler.2008. “Water Vapor Transport and Dehydration above Convective Out flow during Asian Monsoon.”Geophysical Research Letters35: 1531. doi:10.1029/2008GL035441.
Li, D., and J. Bian. 2015. “Observation of a Summer Tropopause Fold by Ozonesonde at Changchun, China: Comparison with Reanalysis and Model Simulation.”Advances in Atmospheric Sciences32 (10): 1354–1364.
Li, D., J. Bian, and Q. Fan. 2015. “A Deep Stratospheric Intrusion Associated with an Intense Cut-off Low Event over East Asia.”Science China Earth Sciences58 (1): 116–128.
Pan, L. L., and L. A. Munchak. 2011. “Relationship of Cloud Top to the Tropopause and Jet Structure from CALIPSO Data.”Journal of Geophysical Research116: 929. doi:10.1029/2010JD015462.
Park, M., W. J. Randel, A. Gettelman, S. T. Massie, and J.H. Jiang. 2007. “Transport above the Asian Summer Monsoon Anticyclone Inferred from Aura Microwave Limb Sounder Tracers.”Journal of Geophysical Research112.doi:10.1029/2006JD008294.
Sherwood, S. C., and A. E. Dessler. 2000. “On the Control of Stratospheric Humidity.”Geophysical Research Letters27 (16):2513–2516.
Shi, C., H. Li, B. Zheng, D. Guo, and R. Q. Liu. 2014. “Stratosphere-Troposphere Exchange Corresponding to a Deep Convection in Warm Sector and Abnormal Subtropical Front Induced by a Cutoff Low over East Asia.”Chinese Geophys.57 (1): 21–30.doi:10.6038/cjg20140103.
Shi, C. H., W. Cai, and D. Guo. 2017. “Composition and Thermal Structure of the Upper Troposphere and Lower Stratosphere in a Penetrating Mesoscale Convective Complex Determined by Satellite Observations and Model Simulations.”Advances in Meteorology. doi:10.1155/2017/6404796.
Shi, C. H., C. Zhang, and D. Guo. 2017. “Comparison of Electrochemical Concentration Cell Ozonesonde and Microwave Limb Sounder Satellite Remote Sensing Ozone Pro files for the Center of the South Asian High.”Remote Sensing9 (10): 1012. doi:10.3390/rs9101012.
Stephens, G. L., D. G. Vane, R. J. Boain, G. G. Mace, K. Sassen, Z.Wang, A. J. Illingworth, et al. 2002. “The CloudSat mission and the A-Train.”Bulletin of the American Meteorological Society83:1771–1790. doi:10.1175/BAMS-83-12-1771.
Suarez, M. J., M. M. Rienecker, R. Todling, J. Bacmeister, L. Takacs,H. C. Liu, W. Gu, et al. 2008. “The GEOS‐5 Data Assimilation System Documentation of Versions 5.0.1, 5.1.0, and 5.2.0.”NASA Technical Report27: 97. TM‐2008–104606.
Tian, W., H. Tian, S. Dhomse, and W. Feng. 2011. “A Study of Upper Troposphere and Lower Stratosphere Water Vapor above the Tibetan Plateau Using AIRS and MLS Data.”Atmospheric Science Letters12 (2): 233–239. doi:10.1002/asl.319.
Wang, T., and A. E. Dessler. 2012. “Analysis of Cirrus in the Tropical Tropopause Layer from CALIPSO and MLS Data-a Water Perspective.”Journal of Geophysical Research117: D04211.doi:10.1029/2011JD016442.
Wu, X. K., X. S. Qie, and T. Yuan. 2013. “Regional Distribution and Diurnal Variation of Deep Convective Systems over the Asian Monsoon Region.”Science China Earth Sciences56: 843–854.doi:10.1007/s11430-012-4551-8.
Xie, F., W. Tian, and M. P. Chipper field. 2008. “Radiative Effect of Ozone Change on Stratosphere-Troposphere Exchange.”Journal of Geophysical Research113: D00B09.doi:10.1029/2008JD009829.
Xie, F., J. P. Li, W. S. Tian, Y. J. Li, and J. Feng. 2014. “Indo-Pacific Warm Pool Area Expansion, Modoki Activity, and Tropical Cold-Point Tropopause Temperature Variations.”Scientific Reports4: 4552. doi:10.1038/srep04552.
Yan, X. L., X. D. Zheng, X. J. Zhou, H. Vömel, J. Y. Song, W. Li, Y. H.Ma, and Y. Zhang. 2015. “Validation of Aura Microwave Limb Sounder Water Vapor and Ozone Pro files over the Tibetan Plateau and Its Adjacent Region during Boreal Summer.”Science China Earth Sciences58: 589–603. doi:10.1007/s11430-014-5014-1.
 Atmospheric and Oceanic Science Letters2018年2期
- Atmospheric and Oceanic Science Letters的其它文章
- Perspectives on the non-stationarity of the relationship between Indian and East Asian summer rainfall variations
- Energetic processes regulating the strength of MJO circulation over the Maritime Continent during two types of El Niño
- Broadening of cloud droplet size distributions and warm rain initiation associated with turbulence: an overview
- A southward withdrawal of the northern edge of the East Asian summer monsoon around the early 1990s
- Assessment of the regional source contributions to PM2.5 mass concentration in Beijing
- Effective approaches to extending medium-term forecasting of persistent severe precipitation in regional models