
The effects of the rotor-stator interaction on unsteady pressure pulsation and radial force in a centrifugal pump *
2018-09-28 05:34IssaChalghoumSamiElaoudHatemKanfoudiMohsenAkrout
水动力学研究与进展 B辑 2018年4期
Issa Chalghoum , Sami Elaoud , Hatem Kanfoudi , Mohsen Akrout
1. Research Laboratory “Applied Fluid Mechanics, Process and Environment Engineering”, National Engineering School of Sfax, Sfax, Tunisia
2. Research Laboratory “Laboratory of Hydraulics and Environment Modeling”, National Engineering School of Tunis, ENIT, Hydraulic Engineering, Tunis, Tunisia
Abstract: An unsteady numerical analysis has been conducted to study the strong interaction between impeller blade and volute tongue of a centrifugal pump. The 3-D-URANS equations were solved with the shear stress transport turbulence model for a wide range of flow rates. These unsteady interactions are mostly related to the unsteady radial force due to an imbalance in the pressure field at the impeller periphery. This force represents dynamic load that are one of the most important sources of vibration and hydraulic noise.Based on this phenomenon, this work analyzes and gives a more realistic prediction of the pressure fluctuation and the radial force during steady and unsteady calculation by considering the effect of the change in the pump operating point. Actually, the pressure fluctuations in the impeller and the volute were recorded by mounting nine monitoring points on the impeller and volute casing. The results of the existing analysis has proven that the pressure fluctuation is periodic due to the relative position of impeller blade to volute tongue. The characteristics of the time domain and frequency domain of the pressure pulsation were analyzed under different coupling conditions. Fast Fourier transform was performed to obtain the spectra of pressure pulsation. Besides, the steady and unsteady forces were calculated around the impeller periphery to fully characterize the pump behavior. The obtained pump performance curves were numerically compared with the experimental ones, and the outcome have shown an acceptable agreement between both curves.
Key words: Unsteady simulation, blade-tongue interaction, unsteady pressure distribution, blade-passing frequency
Introduction
Centrifugal pumps are broadly used to transport liquids in the majority of economic development fields. However, the centrifugal pumps' complex inner flow phenomena, namely strong rotor–stator interaction, can produce hydraulic excitation forces and lead to pressure fluctuations[1]. Such fluctuations have a considerable impact on performance, vibration, stability and noise in centrifugal pumps[2-3]. Hence, it is indispensable to analyze the unsteady pressure fluctuations and estimate the unsteady radial forces around the impeller’s periphery[4-5]or within the passageways[6]. Over the past years and thanks to the development of the numerical methods and computer technology, the CFD has proven to be a very advantageous tool in the analysis of turbo machinery[7-8].Therefore, several research works have been carried out to implement the CFD tool methods in the simulation of three-dimensional turbulent flow inside a centrifugal pump.
The main characteristics of the fluid flow through a centrifugal pump are mainly a circumferentially non-uniform unsteady pattern and a blade-passing frequency[9]. Among the main causes of the hydraulic disturbances that follow the fluid dynamic interaction of the blades with the volute of the pump, we can mention the pressure fluctuations at the blade-passing frequency. This phenomenon causes many troubles in centrifugal pump as noise, vibration, and extra load on the bearings[10-11]. Therefore, the flow characteristics should be further clarified through a centrifugal pump to help designers realize more elevated efficiency pumps. Due to fluid-structure interaction, the unsteady pressure pulsation has considerable effects on the stable and safe operation of the centrifugal pump.Since the rotor-stator interaction between impeller and volute is intense, severe vibration can be generated resulting in some unexpected damage to the mechanical components, such as the size bearing and the pump seal[12]. In a previous research work,Chalghoum et al.[13]have studied the effect of the turbulence model on the flow field’s characteristics inside centrifugal pump. They have found that the shear stress transport turbulence model predicts better results than those obtained using k-ε and SST-CC models[14]. Besides, several researchers have affirmed that the shear stress transport turbulence model is the best model for RANS method[15-16]. Khalifa et al.[17]have investigated the unsteady pressure field and vibration phenomenon emanating from the interaction between impeller and volute of a centrifugal pump.The obtained results have revealed that the pressure fluctuations depend upon the flow rate value, the pump speed and the monitoring point locations inside the pump.
On the basis of the Fourier approach and the time–frequency analysis, Pavesi et al.[18-19]identi- fied and characterized experimentally and numerically the unsteady phenomena produced in a centrifugal pump with a vanned diffuser. By experimental and numerical methods, they have proven the existence of the unsteady pattern and detection of the fluiddynamical origin in the blade load as in the jet-wake instability. Liu et al.[20]have suggested a numerical procedure to model the unsteady flow fields in a centrifugal pump at the shut-off condition using the shear stress transport turbulence model. They carried out a detailed analysis of the pressure fluctuation on the impeller and volute, whose numerical results are in a good agreement with the experimental ones. To reduce the rotor–stator interaction in centrifugal pump,Zhang et al.[21]presented an experimental analysis of the pressure pulsations at nine monitoring points on two volute types (slope volute and spiral volute). At the blade passing frequency, they found that the pressure pulsation in the slope volute is much smaller than that in the spiral volute. For a low specific speed centrifugal pump, GonzáLez and Santolaria[22]provided a relationship between the universal variables and the dynamic flow structure. Their results showed that the pressure fluctuations correlated with the secondary flow and played the major role in the flow patterns at the blade passing frequency (BPF).
The objective of the present work is to numerically study the unsteady strong impeller volute interaction characteristics of the flow field through centrifugal pump over a wide range of flow rates.Firstly, the steady and unsteady numerical results were corroborated through the experimental data at the overall characteristics of the centrifugal pump.When the unsteady numerical model was validated, it was used to analyze the pressure pulsation of the pump’s internal flow fields. The characteristics of time and frequency domains of the pressure pulsation were analyzed using different monitoring points situated at the impeller and volute walls. The steady and unsteady forces at the blade passing frequency were calculated by the radial integration of the pressure distributions at the impeller periphery. The accumulative results of the unsteady flow field analysis inside a centrifugal pump may be a significant aspect for obtaining an optimum design and a more stable inner flow of the centrifugal pump.Moreover, the prediction of pressure fluctuations and radial force can help in reducing the flow-induced vibration and noise in different parts of pump.
1. Description of the numerical model
1.1 Governing equations
The governing equations for an incompressible fluid flow are solved for the flow field inside the centrifugal pump. The basic equations in a manner of Reynolds averaged Navier-Stokes (RANS) are the following continuity and momentum equations,respectively

where u is the velocity vector, p is the pressure,r and m are the density and dynamic viscosity of the simulated fluid, respectively, Fiis the body force, and g is the gravitational acceleration.
1.2 Pump geometry
The numerical pump model is divided into four parts, (1) inlet pipe, (2) impeller (3) volute and (4) the outlet pipe. Each region of these parts is created and discretized independently; a structured grid is used for the inlet, outlet and rotary part (impeller), but an unstructured grid is used for the volute.
Additional geometric and performance parameters of the pumps are summarized in Table 1 and presented in Fig. 1.
Near the solid walls, the mesh grids are refined and a boundary layer is created to ensure the+y value on the surface in a reasonable range[23]. A sensitivity mesh analysis was done by comparing their effects on the pump head. After mesh sensitivity check, it is found that the performance of the model pump does not change more than 0.4% when the overall mesh element exceeds 2×10⁻⁶, as shown in Table 2. Finally, the overall mesh element used in the calculation is about 2.4×10⁻⁶. Figure 2 presents the detailed mesh of the impeller.
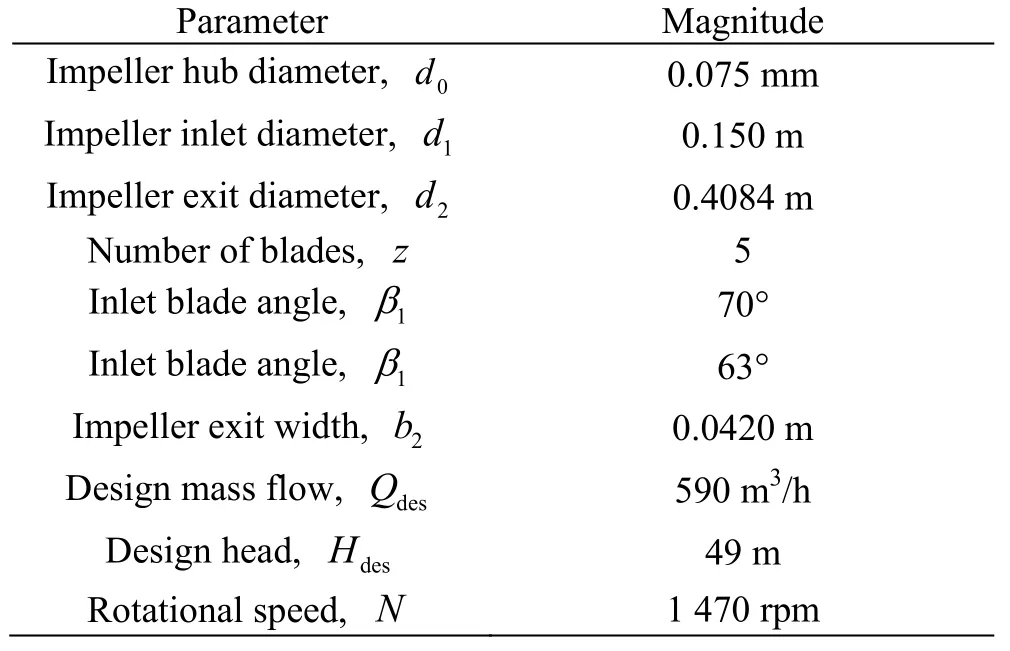
Table 1 Main parameters of the test centrifugal pump

Fig. 1 (Color online) Impeller geometric parameters
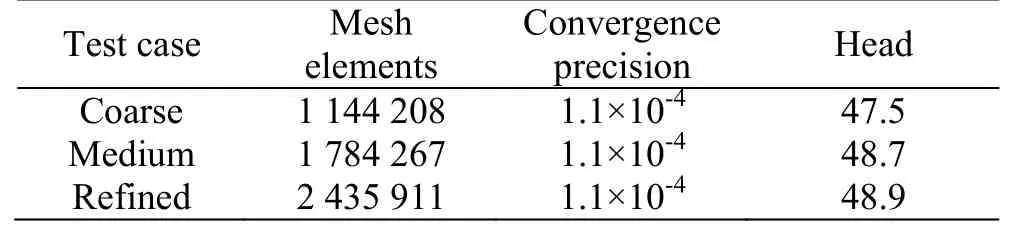
Table 2 Mesh sensitivity check
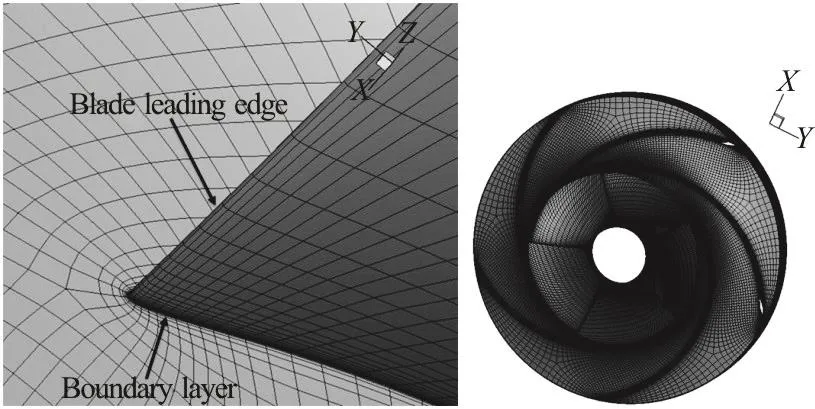
Fig. 2 Detailed mesh of the impeller
The mesh generation of the centrifugal pump model is shown in Fig. 3.
1.3 Numerical simulation methodology
The coupling between pressure and velocity was established by means of the simple algorithm[24]. The time-dependent term is a first-order implicit scheme.The second-order upwind scheme is used for the discretization of the convection terms and the central difference scheme is applied for the discretization of the diffusion terms.
In this numerical study, SST k-ω turbulence model was adopted to simulate the three dimensional and complex turbulent flow in the currently investigated pump. The SST model is more accurate in theory so that the predicted results are closer to the experiments[13,19]. Current numerical simulation was carried out in two parts, steady and unsteady computation. Firstly, the fluid flow inside centrifugal pump is simulated under steady state condition using a wide range of mass flow rates (0.5Qdes, 0.8Qdes,1.0Qdesand 1.2Qdes). Next, the unsteady numerical computation was conducted to capture the strong impeller volute interaction phenomenon and flow dynamics. The steady computation was realized using multiple frames of reference approach (also known as“frozen-rotor” approach) in which the interactions between rotating part (impeller) and stationary part(volute casing) are negligible. The numerical computation was performed with a convergence precision equal to 10-4 for both steady and transient methods,which is sufficient to obtain exact results. Once steady convergence was realized, the output (pressure and velocity fields) were used as initial conditions for the unsteady flow computations through the centrifugal pump. For the unsteady calculation, the interface between the intake, impeller, volute and exit pipe was set to "transient rotor-stator" in order to capture the strong unsteady impeller-volute interaction phenomenon. The time step for this calculation method was set to 10-5seconds (about 5 of impeller revolution).The general boundary conditions for the current numerical simulation of pump are listed in Table 3.

Table 3 Boundary condition
2. Analyses of numerical results
2.1 Validation of CFD simulations, experimental validation
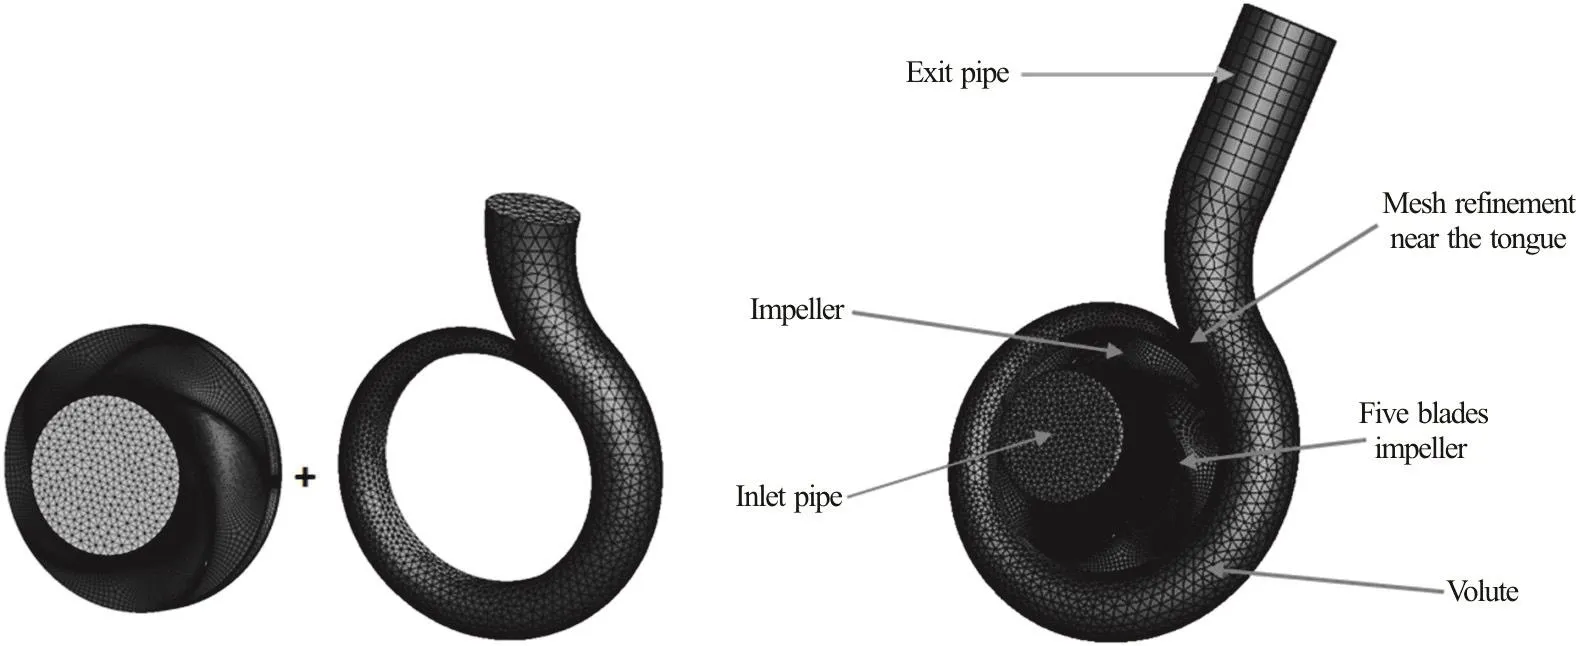
Fig. 3 Sketch of the pump mesh (Inlet and outlet pipe portions are added)

Fig. 4 Performance curves for the test pump obtained numerically and experimentally
In order to support the exactness of the obtained numerical results, Fig. 4 shows the comparison of the experimental and the numerically predicted performance curve of the pump using steady and unsteady computation. The unsteady results are plotted after averaging the obtained values of a whole cycle. As can be seen from Fig. 4, the performance curve from the unsteady model is in good accordance with the experimental results for a wide range of operating flow rates (0.5Qdes, 0.8Qdes, 1.0Qdesand 1.2Qdes).
At the design flow rate (Qdes), the difference between the experimental and numerical head curve is about 0.3m, which corresponds to an error that is less than 0.6%. Furthermore, for the numerical performance curve obtained with the steady state computation, the calculation error is much larger compared to unsteady and experimental results. At the rated condition, the calculation error is about 7.9%. The increase of these errors is accredited to the disability of the steady computation to capture some extra flow instabilities. Nevertheless, the unsteady numerical analysis is used to capture the complex phenomena and treat them at off-design conditions, which result in elevated calculation accuracy with this method.
2.2 Transient head fluctuation
Figure 5 shows the periodic fluctuating head against times under three flow rates (0.5Qdes, 1.0Qdesand 1.2Qdes) during five impeller rotations. It can be seen that there are different wave peaks and troughs,and the value of each peak and trough varies. The appearance of the peaks in unsteady head can be explained by the fact that the number of impeller blades is five. As for the appearance of the troughs, it is mainly due to the presence of unsteady and complex flow field inside the pump.
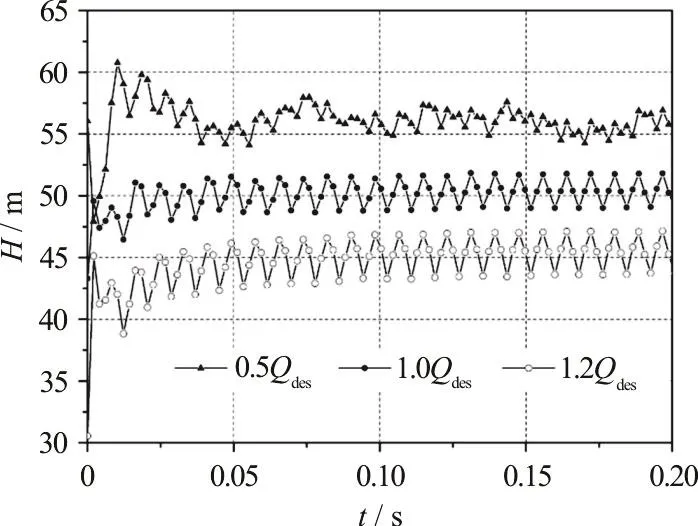
Fig. 5 Temporal evolutions of the nominal transient head during five-impeller revolution
The root mean square of the transient head is higher than that issued from the steady state calculation (Fig. 4). This is due to the fact that the steady state method considers only the average flux at rotating and stationary components interfaces, unlike the unsteady method which updates the flow fields for every times step at the interfaces between the rotating and stationary parts.
2.3 Numerical predictions of the flow field
When the numerical model was validated, it was used to explore the internal characteristics of the flow field inside a centrifugal pump. Figure 6 displays the contours of the immediate static pressure close to the tongue for three test flow rate values. These results were obtained at mid plane, normal to the impellerrotating axis of the pump. It can be noted that the static pressure augments steadily from the impeller eye to the outer impeller periphery due to the impulse of the blades. Besides, as can be noted from Fig. 6, the pressure magnitude increases constantly with the decrease of the flow rate value.

Fig. 6 Instantaneous static pressures at the near-tongue region for three test flow rates
Moreover, proximate volute tongue and for a relative position between blade and volute tongue, a high pressure at the part load operation (0.5Qdes) is noted. At the design flow condition (Q=Qdes), the static pressure progresses easily at both sides of the volute tongue, indicating a stagnation point at its tip.At 1.2Qdesflow rate that is higher than the rated condition, a low pressure region can be seen near the volute tongue. In fact, the results of Fig. 6 indicate that the impeller-volute interaction is considerably affected by the magnitude of the mass flow rate values.
Figure 7 shows the total velocity vectors near the tip of the tongue of the pump at mid-span of the impeller for three test flow rates. Through this figure,the effect of the flow rate on the position of stagnation point on the tongue can be deduced. At design flow rate condition (Qdes), it can be seen that the angle of exiting fluid flow at the level near-tongue region reveals a smooth progression and a good direction with the volute casing geometry (Fig. 7). Under partial flow rates values (0.5Qdes), the fluid flow vectors exit with a small incidence angle compared to the rated flow rate. In this case, the fluid flow vectors presented a recirculation zone near-tongue of volute. Furthermore, it is clearly seen that the fluid flow vectors at 1.2Qdesmass flow leave the impeller with a higher angle than that at partial and rated conditions.
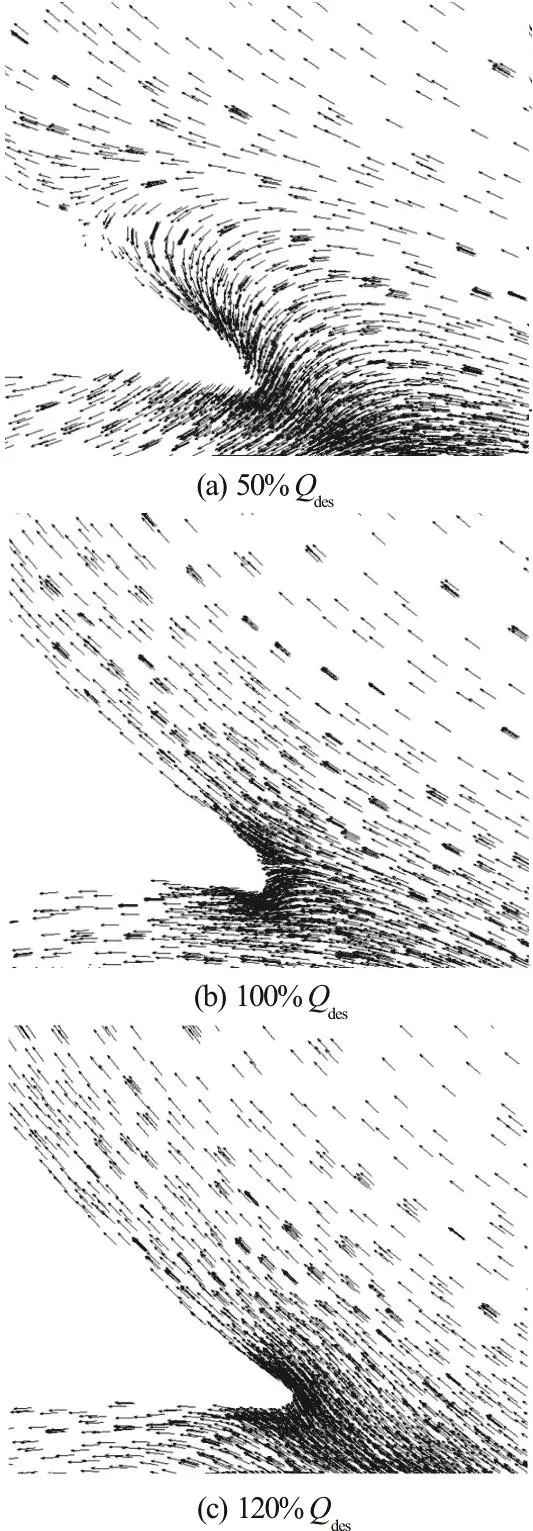
Fig. 7 Velocity vectors in the tongue region of pump, for three mass flow rates
Figure 8 elucidates the temporal and local unsteady pressure distributions near-tongue region at rated conditions for three time steps during a single blade-passage. Hence, the dynamic effect of the bladetongue interaction phenomenon on the unsteady pressure field distribution has been analyzed. Therefore,the temporal pressure distribution near volute tongue is so much influenced by the angle between the blade trailing edge and the volute tongue.

Fig. 8 Local unsteady pressure distributions due to impeller relative position under design flow rate
In this case, the impeller is rotating in anti-clockwise direction. The pressure contour is found to increase inversely relative to the distance between the blade and the tongue (Fig. 8). When the blade moves closer to the volute tongue (T=T2), the unsteady pressure distribution attains a maximum magnitude near the volute tongue. Besides, the pressure reaches a minimum magnitude and a large low-pressure.Actually, during the impeller rotation, the unsteady pressure illustrates an instantaneous fluctuation around the impeller periphery. These fluctuations affect the unsteady pump head as well (Fig. 5).
The static pressure fields around the impeller periphery were measured and calculated. Figure 9 elucidates the pressure distribution for various flow rates ranging from 50% to 120% of the design flow rate. It is observed that for mass flow rates outside the design flow range, a more significant amplitude variation of the pressure pulsation occurs. Furthermore, Fig. 9 shows that the static pressure amplitude reaches a maximum value for lower flow rate(0.5Qdes). At the design condition, the weakest amplitude of pressure pulsation was obtained. Moreover,the pressure pulsation reaches the minimum value for a high flow rate (1.2Qdes).
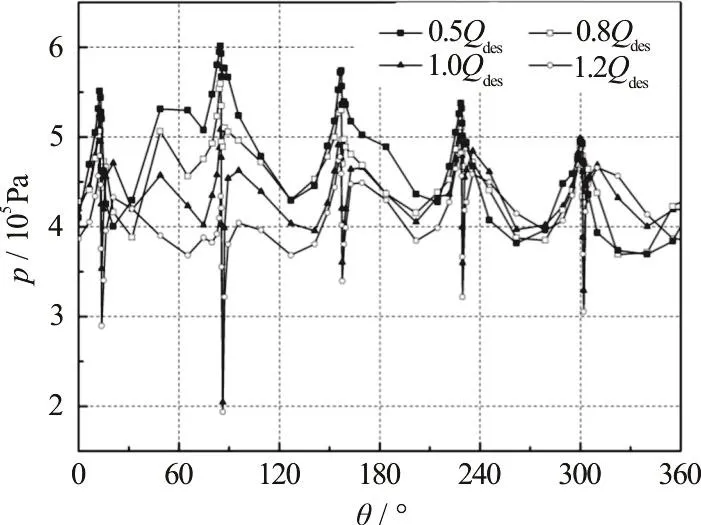
Fig. 9 Static pressures around the volute for four flow rates
Overall, the static pressure distribution around the impeller periphery (Fig. 9) lead to dynamic important loads at this location. Hence, an analysis of the dynamic load variation under different flow condition is necessary to further understand their distribution and effect on pump performance.
2.4 Radial force on the impeller
From the previously mentioned results, and bearing in mind the existing differences, the radial force can be identified by an integration of the rudimentary forces around the impeller periphery.
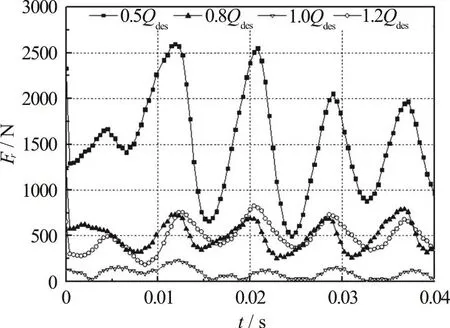
Fig. 10 Time domain diagram of the transient radial force on the impeller

Fig. 11 Locations of monitoring points in pump
Figure 10 exhibits the variation of the unsteady radial force around the impeller periphery during one impeller revolution, under four running conditions.From this figure, it is clear that the amplitude variation of the unsteady radial force is inversely relative to the mass flow rates values. Moreover, the unsteady force curve indicates a sporadic fluctuation with five major peaks, in which the number of the impeller blade numbers is the same. For different flow rate values, it worthy to note that the unsteady radial force varies sporadically with the blade impeller rotation. Therefore, the effects of the blade-tongue interaction phenomenon on the unsteady radial force evolution were examined. A minimum amplitude of radial force were obtained when the centrifugal pump operate nearer to the design flow rate (Q=Qdes).Under partial load conditions (0.5Qdes), a more unstable and maximum radial force compared to the design flow condition. The maximum force at 0.5Qdes,1.0Qdes, 1.2Qdesare 2 600 N, 200 N and 800 N,respectively. The most stable and smallest amplitude variation of the unsteady radial force around the impeller periphery were obtained at the design flow rate.
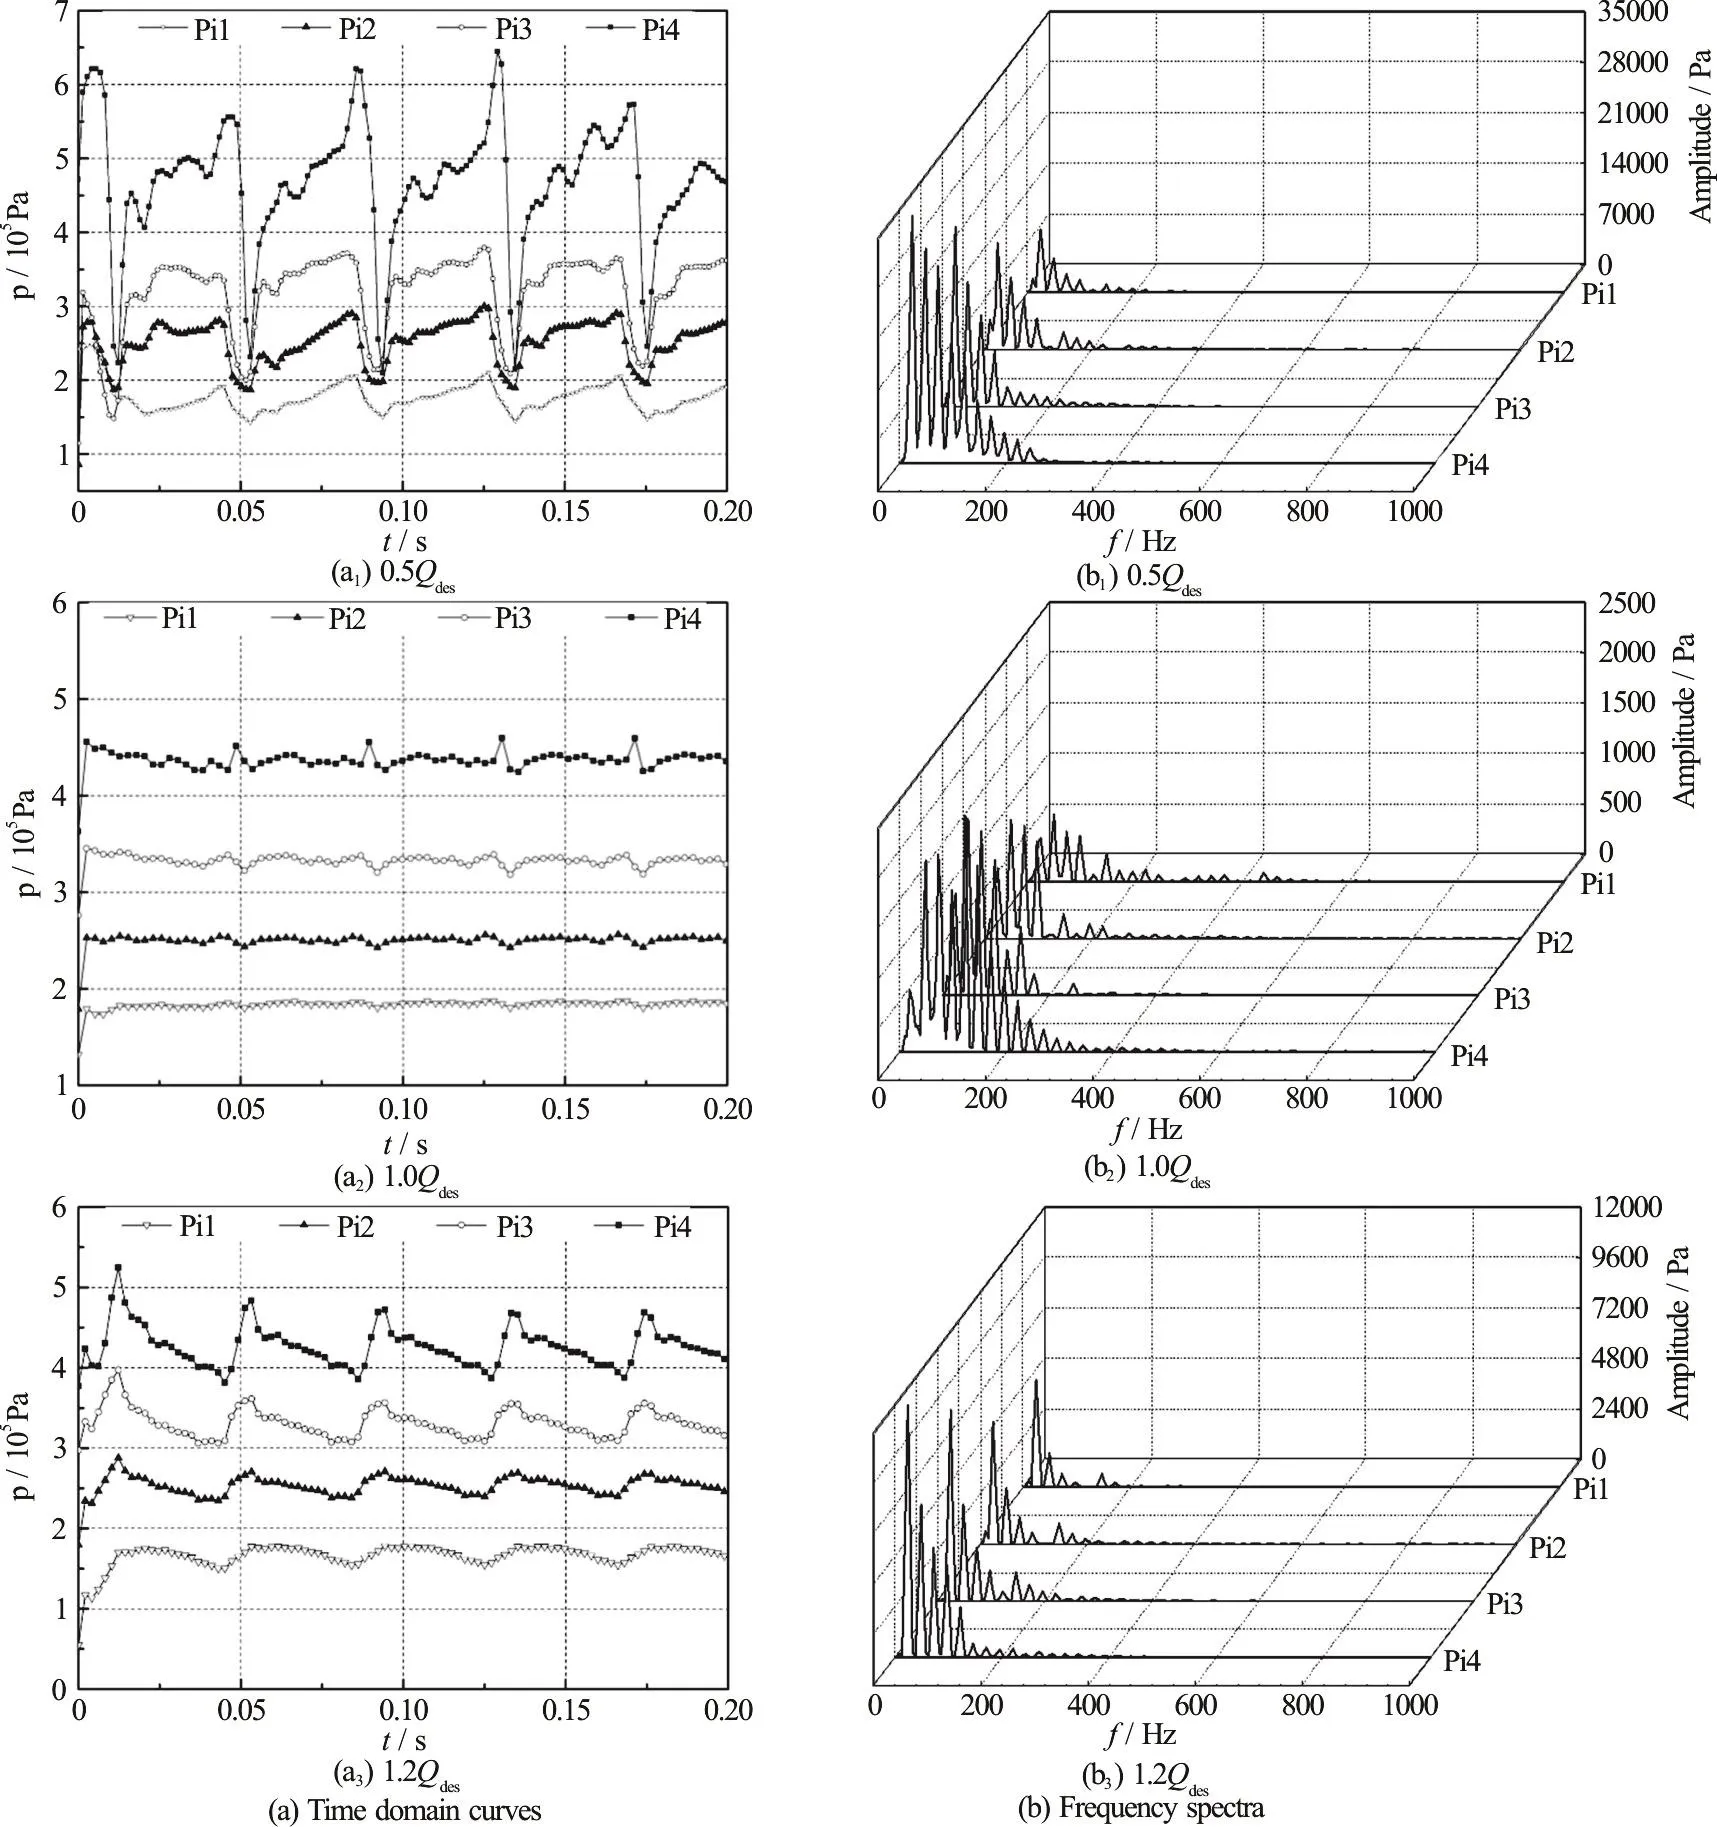
Fig. 12 Pressure fluctuations in the impeller
3. Unsteady pressure pulsations
During the passage of the impeller blade by the volute tongue, a pressure pulse pledges by bladetongue interaction. In the case of a strong bladetongue interaction, the unsteady pressure fluctuation becomes high enough to produce an elevated vibration phenomenon on the pump. The aim is to analyze the pressure fluctuation against time in various pump locations and under three flow rate values. The pressure fluctuations analysis was based on both amplitudes variation and the spectral analysis using the fast Fourier transform (FFT) algorithm. To realize unsteady pressure fluctuation in the pump, many monitoring points are fixed on the impeller and the volute, as shown in Fig. 11. Altogether, there are 4 points in the impeller and 5 points in the volute wall.
3.1 Pressure pulsation at the impeller
Figures 12 (a), 12(b) shows the amplitude and frequency spectra curves of the pressure at indicator points (Pi1, Pi2, P3 and Pi4) under three flow rates(0.5Qdes, 1.0Qdesand 1.2Qdes). For the three tested flow rates, it is found that the energy amplitude of pressure fluctuations progressively increases from the inlet to the outlet of the impeller (Fig. 12(a)). At design flow rate, the pressure fluctuation amplitudes at Pi1 and Pi2 are lower than those obtained for monitoring points (Pi3 and Pi4), which means that the pressure fluctuations in the passage away from the volute tongue are small and the flow is quite smooth.
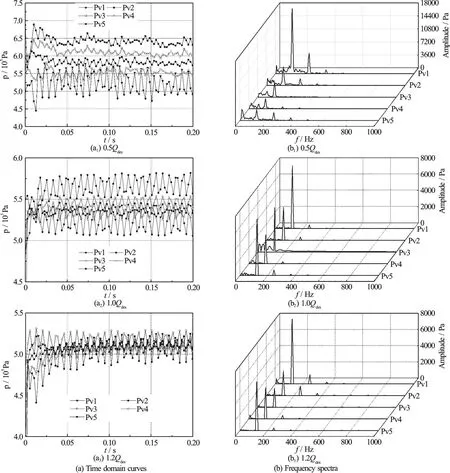
Fig. 13 Pressure fluctuations in the impeller
In addition, the pump flow rate has a substantial effect on the variation of the pressure amplitudes situated at the impeller. From Figs. 12(a), 12(b), it can be noted that the amplitude of the pressure variation at blade passing frequency (fBPF=122.48 Hz)is the largest for partial load condition, reaching 35 000 Pa(0.5Qdes). Such amplitudes diminish when a centrifugal pump operates at 1.2Qdes, reaching 10 000 Pa.These considerable variations occurring outside the pump’s design flow rate may explain the occurrence of the unstable swirl and backflow phenomena. The latter engenders a high-pressure amplitude, leading to the appearance of a vibration phenomenon of the pump components. The above analysis proves that the interactions between the rotated impeller and the static volute have more effects as a function of the location of the monitoring points, which increase with the increase of the impeller radius, and when the pump works outside the design flow condition.
Figure 12(b) shows the spectra of pressure fluctuations at the Pi1, Pi2, Pi3 and Pi4 impeller monitoring points, at different operating conditions. It is obviously clear that the dominant pressure frequencies in these locations accord well with the rotation frequency (fr=24.49 Hz), which corresponds to the off-design conditions. Under the design condition, the predominant pressure frequencies of Pi1,Pi2 and Pi3 are at 49Hz (2fr). Concerning Pi4, the pressure frequency is dominant at 122.48 Hz, which is equal to the blade passing frequency (fBPF=z. fr). In fact, the smallest spectra of pressure fluctuations are situated at the impeller inlet, where the impact of the rotor-stator interaction phenomenon is trivial.Moreover, the amplitude of the pressure spectrum was found to vary as a function of the pump operating condition.
At partial flow, the spectra of the pressure fluctuations are larger and the corresponding flow characteristics are more complex and unstable.However, under design flow rate, these spectra are the smallest because the flow field at design condition is increasingly smooth and well directed (see Fig. 7).
3.2 Pressure pulsation in the volute
The pressure amplitudes fluctuation in the volute are shown in Fig. 13(a). Under various operating conditions, the pressure amplitude diminishes steadily in the volute wall from Pv1 to Pv5. The maximum pressure fluctuation amplitude is at Pv1, which is closer to the volute tongue than that at Pv4, which is minimum. This may be explained by the fact that the flow characteristics near the volute tongue are very complex and unsteady. Along spiral flow direction,the amplitude of the pressure fluctuation decreases progressively owing to the large eddy-dissipation. As in the preceding section, the largest pressure amplitudes were found at off-design conditions.
The distributions of the pressure spectrum in the volute wall are shown in Fig. 13(b). Furthermore, this figure indicates that the prevailing frequency of the pressure fluctuations for all locations in the volute is set at 122.48 Hz, which is equal to the blade passing frequency (fBPF=122.48 Hz). The largest pressure amplitude is obtained for Pv1, because it is very close to the volute tongue where the interaction phenomenon between the impeller and the volute is significant.Nonetheless, the lowest amplitudes were obtained at Pv3 and Pv4, which are far away from the volute tongue. For all the monitoring points situated in volute wall, the smallest pressure amplitudes were found at design flow conditions.
4. Conclusions
In this paper, the unsteady flow field behaviors inside a centrifugal pump were explored under different running conditions. The results offer a reasonable estimation of the general pump characteristics with an adequate precision compared with the existing data.The obtained numerical head under steady and unsteady computation conditions have been in a good accordance with the experimental one. The transient head curves exhibit a sporadic fluctuation, but the fluctuation amplitudes of each peak are not the same,which is caused by the unsteadiness of the flow field inside the pump. It can be seen that the amplitude of the transient head fluctuation at the design flow rate is smaller than the other flow rates. The dynamic effects of the flow resulting from the impeller-volute interaction for diverse operating conditions were investigated to lessen the flow-induced vibration and noise in certain pump components. The main goal of the present work was to estimate the steady and unsteady characteristics of the pressure and the radial force on the impeller periphery at each test flow rate. It was observed that the maximum amplitude of the unsteady radial force component was attained when operating at off-design conditions.
In order to determine the rule governing the pressure fluctuation in the pump, many tests have been carried out in numerous monitoring points in the impeller and the volute wall. The analysis emphasized the pressure amplitude evolution in both time and frequency domains. The registered amplitude of the pressure fluctuations was found to be dependent on both location and pump operating conditions. The obtained data have shown that the amplitude and the frequencies of the pressure fluctuations rise from the inlet to the outlet of the impeller for the whole flow range owing to the rotor-stator interaction. The maximum pressure amplitude values in the impeller and the volute are found when the pump is running at off-design conditions. At the volute tongue region, the pressure amplitude is much larger than that at other regions due to the existence of vortices.
For 0.5Qdesand 1.2Qdes, the prevailing pressure frequencies in the impeller location are all in good agreement with the rotation frequency (24.49 Hz). Moreover, the dominant pressure frequency at volute wall is found at the blade passing frequency(fBPF=122.48 Hz)for all flow rate values. According to the analysis of the pressure fluctuations characteristics on time and frequencies domains, the strong interaction between impeller and volute in pump appears to be more dominant in the volute than that in the impeller.

- 水动力学研究与进展 B辑的其它文章
- Call For Papers The 3rd International Symposium of Cavitation and Multiphase Flow(ISCM 2019)
- Investigation of the hydrodynamic performance of crablike robot swimming leg *
- Determination of epsilon for Omega vortex identification method *
- Transient curvilinear-coordinate based fully nonlinear model for wave propagation and interactions with curved boundaries *
- Tracer advection in a pair of adjacent side-wall cavities, and in a rectangular channel containing two groynes in series *
- Numerical simulation of transient turbulent cavitating flows with special emphasis on shock wave dynamics considering the water/vapor compressibility *