
Large eddy simulation of tip leakage cavitating flow focusing on cavitation-vortex interaction with Cartesian cut-cell mesh method *
2018-09-28 05:34XiaoruiBai白晓蕊HuaiyuCheng程怀玉BinJi季斌XinpingLong龙新平
水动力学研究与进展 B辑 2018年4期
关键词:新平
Xiao-rui Bai (白晓蕊), Huai-yu Cheng (程怀玉), Bin Ji (季斌), Xin-ping Long (龙新平)
1. State Key Lab of Water Resources and Hydropower Engineering Science, School of Power and Mechanical Engineering, Wuhan University, Wuhan 430072, China
2. Hubei Key Laboratory of Waterjet Theory and New Technology, Wuhan University, Wuhan 430072, China
3. Science and Technology on Water Jet Propulsion Laboratory, Shanghai 200011, China
Abstract: In the present paper, flow configurations of cavitating flow around a straight NACA0009 foil with a gap between the foil tip and sidewall are investigated numerically by large eddy simulation (LES) coupled with Zwart-Gerber-Belamri (ZGB) cavitation model.A Cartesian cut-cell method is used for mesh generation, which is of good orthogonality and high quality. A good agreement is obtained between simulation and experiment. Two influencing factors on vorticity distributions, the interaction between different vortices and the occurrence of cavitation, are discussed in detail based on the numerical results. A series of Ω-shaped loops are observed during the development of the induced vortex, which is a result of the instability of vortex pair. This finding may provide a new viewpoint to control the evolution of tip-leakage vortex (TLV) cavitation. Moreover, it is found that the dilatation term plays a much more important role in the evolution of TLV cavitation compared with that in sheet cavitation.
Key words: Cavitation, tip-leakage vortex, large eddy simulation (LES), Cartesian cut-cell mesh, vortex dynamics
Gaps between the rotating and the stationary components are indispensable in hydraulic machines,where tip-leakage vortex (TLV) and tip-separation vortex (TSV) develop[1-2]. Cavitation may thus occur due to low pressure and produces performance loss,vibration, noises and blade erosion[3-4].
For decades, numerous experiments have been carried out on hydraulic machines aiming at figuring out the variation law of different flow parameters and characteristics of TLV[1-2]. In the cases of various clearance levels, Inoue and Kuroumaru[5]obtained the velocity and pressure fields in the tip gap region of two axial compressors. Detailed inner structure of the TLV in a waterjet pump were obtained by Miorini et al.[2]using PIV. Measurements showed that several wrapping vortices developed separately in the vortex region rather than merging together. Quite abundant,while the above literatures mainly focus on the TLV,with the effects of cavitation rarely mentioned.Recently, a few experiments were conducted on cavitating flow to study the mutual effects of TLV and cavitation[6]. Groups of experiments conducted have also inspired and facilitated the proceeding of many numerical works. Zhao et al.[7]proposed a new cavitation model, in which the effects of vortex on the mass transport process were considered. This transport-based model showed a good performance in predicting the TLV cavitation. Guo et al.[8]calibrated the traditional Zwart cavitation model based on the referenced test, which significantly improves the prediction of the TLV cavitation and velocity in the vortex core. Although much progress has been made,predicting TLV cavitation with high accuracy is still a challenging but important work[9-10].
Inspired by previous work, the present paper pays attention to flow configurations in the tip gap region of the cavitating flow around a NACA0009 foil.The simulation results are checked carefully. With the numerical results, the characteristics of tip vortices and the effects of cavitation on vortex dynamics are discussed by the vorticity transport equation.Moreover, a special structure of the induced vortex,Ω-shaped loop and its influence on TLV cavitation is analyzed in the current paper.
As shown in Fig. 1, the TLV under investigation is induced by a NACA0009 foil with chord length C=100 mm . The angle of incidence is fixed to 10°and the gap τ=0.1C. Details of the foil shape can be found in Ref. [6]. According to the previous investigation[6], the TLV reaches quite far to the downstream. Therefore, a huge number of grids around the TLV is needed to gain an adequate local resolution for structured mesh. In order to minimize the total grid number and meanwhile to ensure the accuracy, mesh 1-mesh 3 of different resolutions are obtained through an effective mesh generation approach, called Cartesian cut-cell method[11]. Fig. 2 shows typical distributions of the grids around the foil.The especially refined region is the same for all meshes, while the only difference is the minimum size of cell edge. Meanwhile, the dimensionless first layer distance y+from the foil surface is ensured to be between 0-2, in order to resolve the boundary layer appropriately. Details of the three generated meshes are shown in Table 1. In accord with settings of the referenced experiment[6], the inlet static pressure is set to 1 bar and the outlet velocity V∞=10m/s . The simulation is initialized with a completely wetted profile computed by k-ε SST model, and then LES coupled with ZGB model is adopted to solve the cavitating flow.
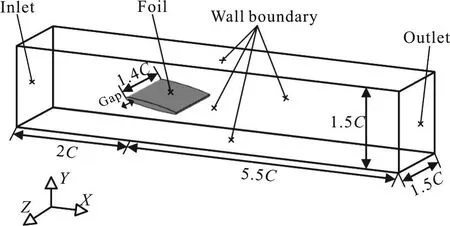
Fig. 1 Computational domain and boundary conditions
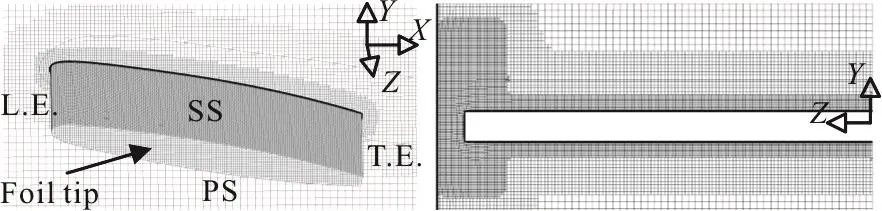
Fig. 2 Typical grid distributions around the foil surface
Table 1 Mesh parameters
The sketch of three monitored planes x/ C=1.0,x/ C=1.2, x/ C=1.5 is shown in Fig. 3 with the non-dimensional coordinate marked. Each plane represents anarea of52×55mm2surrounding the TLV in accord with the experiment[6].
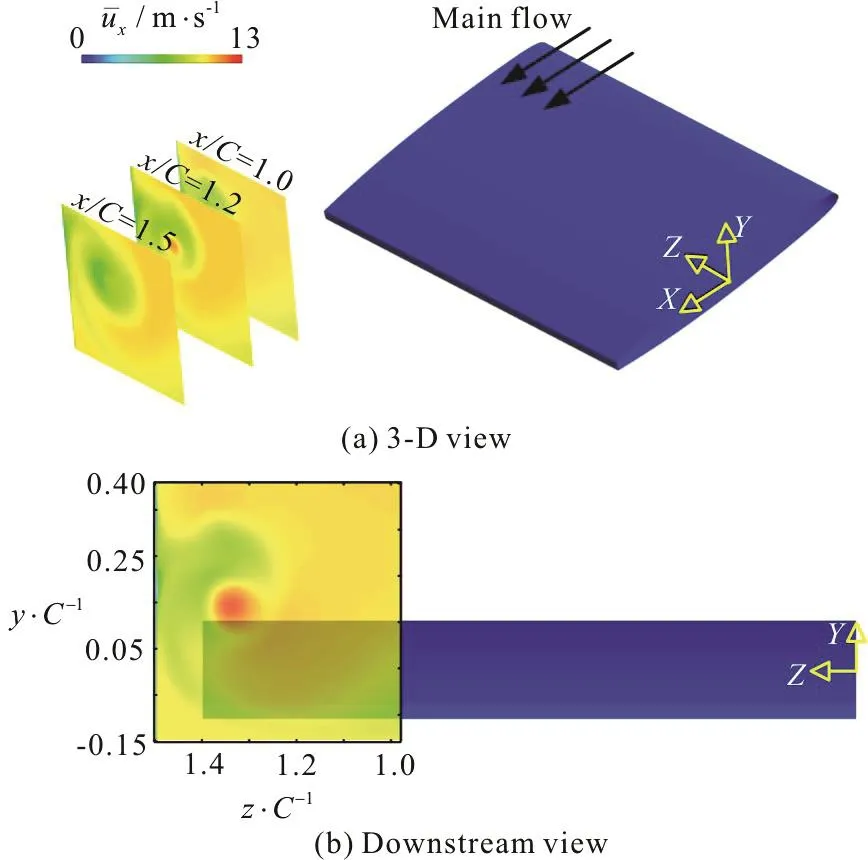
Fig. 3 (Color online) Sketch of three measurement planes
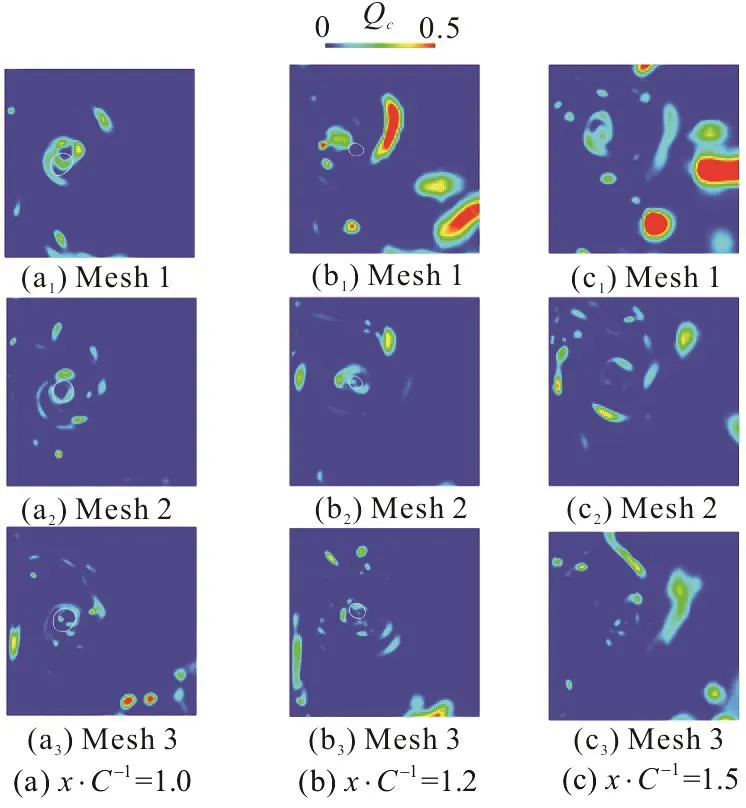
Fig. 4 (Color online) Qc on three monitored planes
To examine if the gap flow is resolved with sufficient accuracy, a criterion Qcis used here proposed by Benard et al.[12], which is required to be lower than 0.2 to ensure that more than 80% of the total turbulent kinetic energy is explicitly resolved.Fig. 4 shows Qcon the planes in Fig. 3, with iso-line of the time-averaged vapor volume fraction(αv=0.1) marked with white circles. As shown in Fig. 4, Qcobtained with mesh 1 is over 0.2 around the TLV, and exceed 0.5 for a large proportion on the planes at x/ C=1.2 and x/ C=1.5. The requirement is satisfied for mesh 2 and mesh 3, with Qcbasically below 0.2, which indicates that both mesh 2 and mesh 3 are sufficient for the LES employed here.Nevertheless, to gain a balance between accuracy and computational resources, mesh 2 is finally adopted in the current paper.
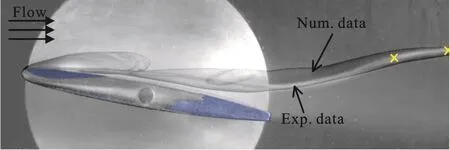
Fig. 5 (Color online) Comparison of simulated time-averaged cavitating TLV and experiment photo[6]
To further validate the simulation results, the predicted time-averaged TLV cavitation is compared with experimental measurements[6]. The development of TLV and TSV cavitation is captured well shown in Fig. 5 by iso-surface of αv=0.1. The predicted time-averaged cavity is in good agreement with experimental result, which indicates that the numerical result obtained with Mesh 2 is sufficiently accurate and reliable for our following discussion.
The vortex structures in the gap are displayed in Fig. 6 with iso-surface of instantaneous Q criterion(Q =2× 10⁶s-2) colored by the axial vorticity. It is observed that the TLV is generated at the suction side of the foil, in the meanwhile intense flow separation happens as the jet flow pass through the gap and produces the TSV at the pressure side. Both primarily driven by the main flow and the pressure gradients in the gap, TLV and TSV are co-rotating vortices characterized with negative vorticity in the axial direction. The TLV and TSV are found to fuse together at about 0.3C-0.7C downstream the leading edge and roll up the surrounding induced vortex as well as the wake vortices of the foil.
With presence of the tip vortices, opposite-signed vorticity generates in the boundary layer and is rolled up to form the induced vortex. It should be noted that,as the induced vortex wraps around the TLV, severalΩ-shaped loops are observed around the TLV (shown in Fig. 7), which are caused by the so called Crow instability of vortex pairs[13]. Although the instability of vortex pairs has been discussed widely, the Crow instability of the induced vortex in a tip-leakage cavitating flow is still rarely reported. One of the main reasons is that the detailed vortex structures in this flow have not been reproduced so well. Thanks to the Cartesian cut-cell method, the induced vortex is captured successfully and makes it possible to observe this flow phenomenon. It should be noted that strength of the TLV is found to decrease dramatically with the existence of the induced vortex[13], which indicates the instability of induced vortex may provide a new viewpoint for the control of TLV cavitation.
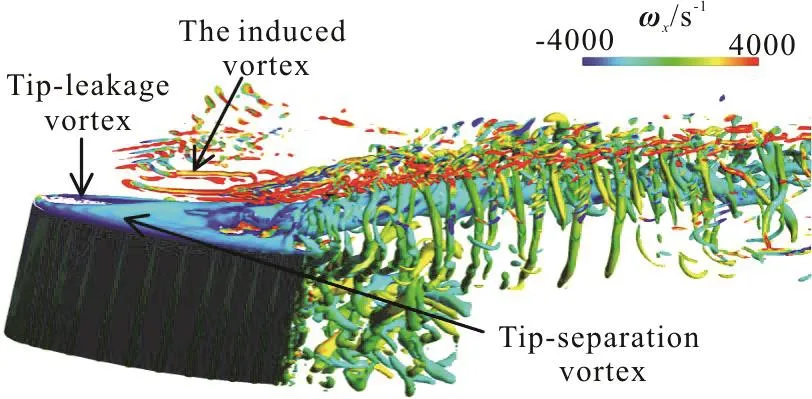
Fig. 6 (Color online)The instantaneous iso-surfaceof Q criterion
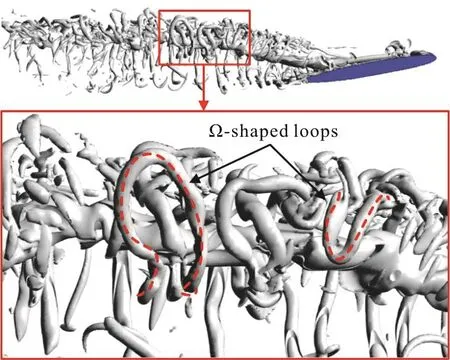
Fig. 7 (Color online) Typical Ω-shaped loops of induced vortex
To gain an insight into the interactions between vortex and cavitation, the vorticity transport equation in the axial direction for compressible fluid is employed as follows
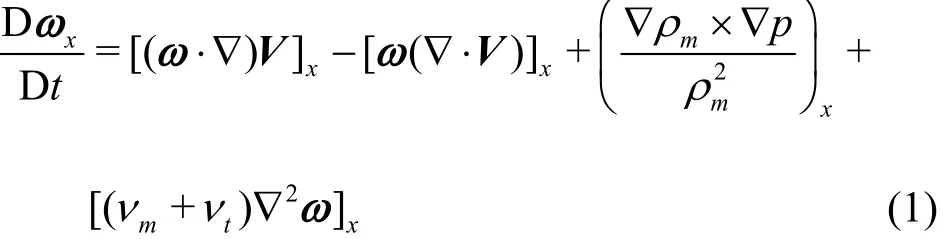
where the rate of change of vorticity is dominated by four terms on the right hand side of the equation,namely the stretching term, the dilatation term, the baroclinic torque and the viscous diffusion term. Since the last term is much smaller when compared with other three terms, it will be omitted in current paper.
The stretching term, the dilatation term and the baroclinic torque are shown in Fig. 8 together with the vortical cavity (iso-surface of αv=0.1) in a typical instant. It is clearly illustrated that, along the tip vortical cavity from the leading edge of the foil to the downstream of about x/ C=1.2, the vortex stretching is dominant especially after the confluence of TLV and TSV. It indicates that this term exerts a great influence on the production and reallocation of local vorticity. Figure 8(c) shows the distribution of dilatation term, which mainly concentrates in the region of phase changing. It can be observed that the dilatation term in the cavitation core is minus, which indicates a reduction of local vorticity. Conversely,the dilatation term is quite high around the cavitation core, which will increase the local vorticity. As a result of that, the vorticity in the TLV cavitation decreases during the development of TLV cavitation,as shown in Fig. 8(a). The baroclinic torque is much smaller when compared with the other two terms, but its influence on cavitation is not negligible being affected by the evaporation and condensation process.
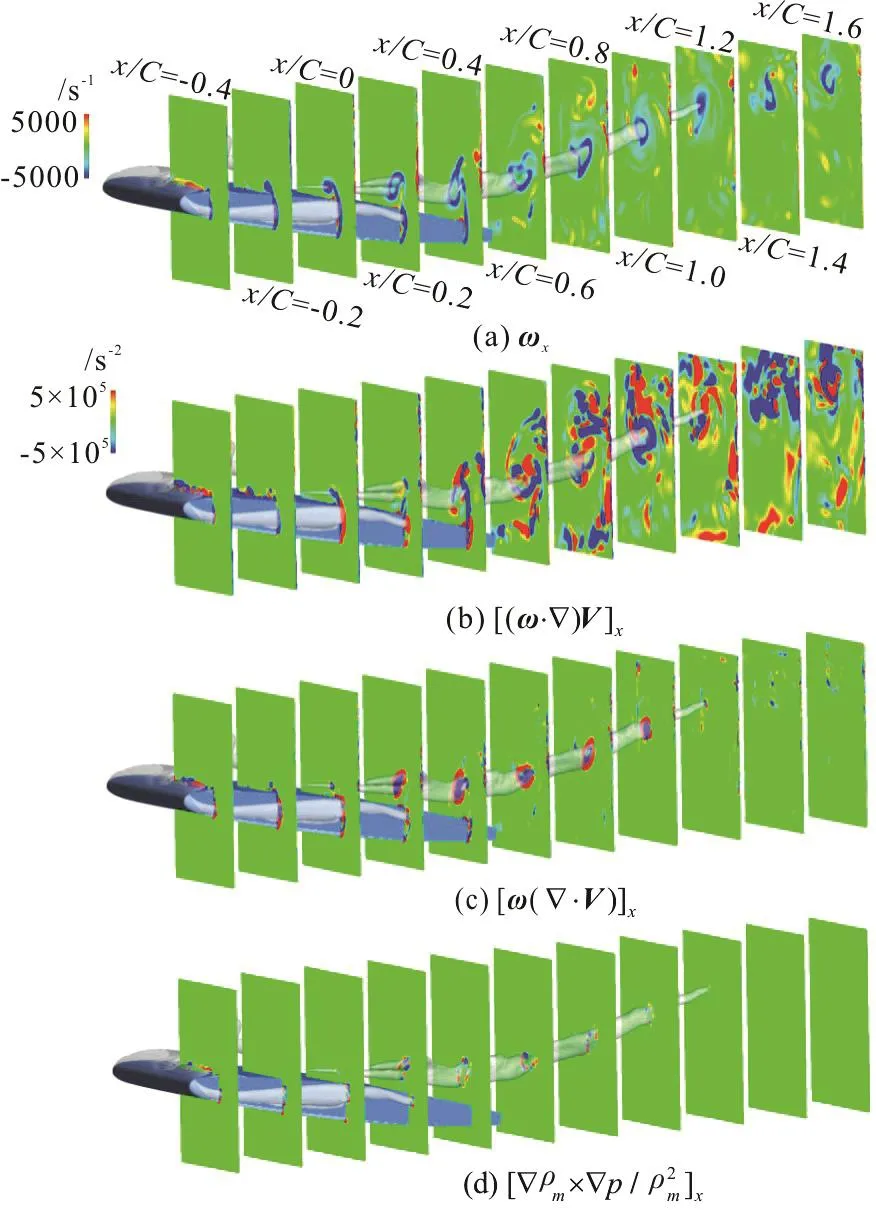
Fig. 8 (Color online) Distributions of xω, stretching, dilatation and baroclinic torque terms
In this paper, flow configurations in the gap region of a NACA0009 hydrofoil is simulated with LES and ZGB cavitation model. The main conclusions are drawn as follows:
(1) Based on the numerical results, formation mechanisms of the TLV and the TSV are provided that they are induced and entrained by the main flow and pressure gradients between two sides of the foil.
(2) The instability of the induced vortex is captured successfully, which exhibits a significant influence on the behavior of TLV cavitation. The instability of the induced vortex may provide a new viewpoint for the control of TLV cavitation.
(3) The vortex dynamics in the cavitating flow is studied with the corresponding vorticity transport equation. It showed that the dilatation term plays an important role in the development of TLV, which will transport the vorticity from the inside of cavitation core to the outside.
猜你喜欢
幼儿园(2021年18期)2021-12-06
幼儿园(2021年16期)2021-12-06
金秋(2021年22期)2021-03-10
幼儿园(2020年3期)2020-03-27
幼儿园(2020年1期)2020-03-25
新疆艺术(2019年3期)2019-07-17
北方音乐(2018年17期)2018-10-31
水动力学研究与进展 B辑(2018年3期)2018-07-06
初中生世界·九年级(2016年4期)2016-04-21
婚姻与家庭·性情读本(2009年8期)2009-09-22

- 水动力学研究与进展 B辑的其它文章
- Call For Papers The 3rd International Symposium of Cavitation and Multiphase Flow(ISCM 2019)
- Investigation of the hydrodynamic performance of crablike robot swimming leg *
- Determination of epsilon for Omega vortex identification method *
- Transient curvilinear-coordinate based fully nonlinear model for wave propagation and interactions with curved boundaries *
- Tracer advection in a pair of adjacent side-wall cavities, and in a rectangular channel containing two groynes in series *
- Numerical simulation of transient turbulent cavitating flows with special emphasis on shock wave dynamics considering the water/vapor compressibility *