
The effect of downstream resistance on flow diverter treatment of a cerebral aneurysm at a bifurcation: A joint computational-experimental study *
2018-10-27 09:10AndersonTsangBillyYiuAbrahamTangChungGilbertoLeungAlexanderPoonAlfredYuSimonLaiChow
水动力学研究与进展 B辑 2018年5期
Anderson C.O.Tsang , Billy Y.S.Yiu , Abraham Y.S.Tang , W.C.Chung , Gilberto K.K.Leung ,Alexander K.K.Poon , Alfred C.H.Yu , Simon S.M.Lai , K.W.Chow
1.Department of Surgery, Li Ka Shing Faculty of Medicine, University of Hong Kong, Hong Kong, China
2. Department of Electrical and Computer Engineering, University of Waterloo, Waterloo, Canada
3. Department of Mechanical Engineering, University of Hong Kong, Hong Kong, China
4. Department of Electrical and Electronic Engineering, University of Hong Kong, Hong Kong, China
Abstract: Intracranial aneurysm can lead to hemorrhagic stroke upon rupture.Deployment of flow diverters can restrict the blood flow into aneurysm and mitigate the rupture risk.Computational fluid dynamics (CFD) and ultrasonography with pulse-wave and color Doppler ultrasound measurements were employed jointly to investigate the complex flow pattern in cerebral aneurysms, both before and after the deployment of flow diverters.Patient-specific configurations of both bifurcation and side-wall aneurysms were selected.The effect of downstream flow resistance was investigated by adjusting the volume flow rate and pressure at the outlet vessels computationally and experimentally.Velocity profiles in the aneurysm measured from ultrasonography showed good agreement with those from computer simulations.The discrepancy in velocity between the computational and experimental sets of data is less than 10%.The downstream resistance can alter the volume flux into a bifurcation aneurysm with a flow diverter deployed by 236%, while the corresponding value of a side-wall aneurysm is negligible.The vorticity of the aneurysmal flow was reduced by more than 80% in both cases after stenting.This study demonstrated that careful investigation of downstream flow resistance of a bifurcation aneurysm is essential to provide an accurate assessment of the aneurysmal flow dynamics after flow diverter deployment.
Key words: Intracranial aneurysms, computational fluid dynamics (CFD), doppler ultrasound
Introduction
Intracranial aneurysms are abnormal focal dilations of the brain arteries.They are commonly found near the arterial bifurcations in the Circle of Willis[1].The occurrence rate of intracranial aneurysm is about 5% in the population.As the aneurysm swells, the weakened part may rupture, causing intracranial hemorrhage and high mortality rate[2].
Flow diverters such as the Pipeline Embolization Device (Medtronic, Minneapolis, MN, USA) (PED)are gaining popularity in the treatment of unruptured cerebral aneurysms.They are mesh-like metallic devices deployed into the blood vessel through endovascular repair.These flow diverters are expected to reduce the blood flow into the aneurysm, mitigating the risk of aneurysm rupture.Their clinical efficacy has been studied widely, with merits including the treatment of wide-neck aneurysms and giant aneurysms.However, aneurysm rupture has been reported in some cases in spite of flow reduction after flow diverter treatment.Intra-aneurysmal thrombus formation is believed to play a role in the causes of delayed aneurysm rupture[3].Computational fluid dynamics (CFD) is a well-developed technique in the study of aneurysm flow dynamics[4-7], and has recently been adopted to investigate the effect of flow diverters[8-10].Treatment outcome may also be predicted by hemodynamic parameters obtained computationally[11].The merits of CFD include a relatively low cost and the noninvasive nature.Furthermore, CFD can provide realistic estimates of critical hemodynamic parameters such as shear stress and shear stress gradient which are otherwise difficult to measure experimentally or clinically[12-13].
Indeed, computational studies on the hemodynamics of intracranial aneurysm have been performed intensively by utilizing both idealized and patientspecific models.An important clinical issue is the prediction of rupture of an aneurysm from the flow dynamics.Intensive research work and review papers indicated that geometry of aneurysm, the aneurysm neck width and inflow angle between vessel and aneurysm may affect the wall shear stress on the aneurysmal wall, which is believed to play a crucial role in aneurysm rupture[12,14-17].Due to the intrinsic complexity of aneurysmal flow, scientists cannot conclude whether high or low shear stress alone will lead to the aneurysmal growth and rupture, but it is well-known that regions associated with low wall shear stress are more prone to atherosclerosis[18-19].The site of intimal hyperplasia was subject to low and oscillatory wall shear stress, while the location of thrombus was associated with oscillatory shear stress.
However, the inherently three-dimensional,complex and pulsatile flow dynamics in an aneurysm still poses great difficulties for such numerical modeling.The inlet and outlet boundary conditions,equivalent to the blood-flow proximal and distal to the aneurysm, can critically alter the computer flow dynamics simulations.Phase contrast magnetic resonance imaging (MRI) has been utilized to enhance the understanding of the dynamics in varying the boundary conditions, especially if a feedback process is used to improve the validity of numerical performance[20].Verification of the computational results by such imaging techniques has been achieved[21].Besides phase contrast MRI, other techniques like one-dimensional circulation model have also been applied to improve the prospect of CFD for large cohort studies[22].Systematic comparisons between simulations using patient-specific (as measured by dual-sensor pressure and velocity guidewires) and literature established boundary conditions have been conducted, and the former is found to have a better performance[23].However, such parameters are difficult to obtain in usual clinical practice.
For aneurysms located at an arterial bifurcation,earlier computational studies had shown that varying the volume flux at the inlets or the outlets might have a profound impact on the hemodynamics, in terms of sizable variations in the streamline configurations and shear stress distributions[8,24-25].Given the intrinsic simplifying assumptions in CFD and the complexity of the flow dynamics, it will be highly desirable to conduct a full scale, joint computational-experimental work on the hemodynamics with varying outflow conditions at the two downstream vessels of an aneurysm at an arterial bifurcation, both before and after the flow diverter treatment.This investigation on downstream resistance is crucial, as many previous joint computational-experimental works in the literature did not vary the boundary conditions under the important situation of stent deployment.In terms of laboratory measurement, ultrasonography will be employed instead of particle image or Doppler laser velocimetry[26-27].Indeed joint computational and experimental study with ultrasonography had been performed previously with the post-treatment aneurysm models[28].With the same downstream resistance at two outlets, the computational results matched with the experimental results, with a discrepancy of about 10%.However, the effect of downstream resistance on the aneurysmal flow had not been evaluated.This issue is particularly important, as the outflow conditions may alter the aneurysmal flow significantly.In some earlier publications, the peripheral resistance of the outlets has been investigated, but the effect of relative resistance between two outlets on a treated bifurcation aneurysm remains unclear[29].Furthermore, it may not be evident to have similar results between in-vitro experiments and CFD simulations[30].While the reductions in volume flow rate after stent deployment had been noted before, here another indicator, the vorticity of the flow, was also studied.The vorticity of a fluid is the curl of the velocity vector and physically represents the degree of rotation (twice the local angular velocity) of the flow field.In fluid mechanics,elevated vorticity can be present near the boundary shear layers or near the vortex cores inside the fluid.We shall focus on the latter here.Complex flow pattern associated with higher vorticity may lead to greater risk of aneurysm wall inflammation and rupture[31-32].In terms of post-treatment hemodynamics, great reduction in vorticity inside aneurysm might be related to weak fluid influx into the aneurysm.The enhancement in turnover time may result in a greater chance of thrombosis[33].This effort of joint computational and experimental study constitutes the goal of the present work.
1.Materials and methods
1.1 Patient-specific aneurysm models
This study was approved by the Institutional Review Board of the University of Hong Kong, and the patients’ consent was obtained.Two patients with intracranial aneurysms were selected for detailed computational and experimental analysis.Patient 1(female, age: 60 years) had a bifurcation aneurysm located at the posterior communicating artery(PComA), while patient 2 (female, age: 71 years) had a side-wall aneurysm situated at the distal internal carotid artery (dICA).The size and nearby morphology are similar for both aneurysms as indicated in Fig.1.In terms of clinical procedure, the bifurcation aneurysm (patient 1) persisted 18 months after treat-ment with a single PED, while the side-wall aneurysm(patient 2) was obliterated at six months after flow diverter treatment.
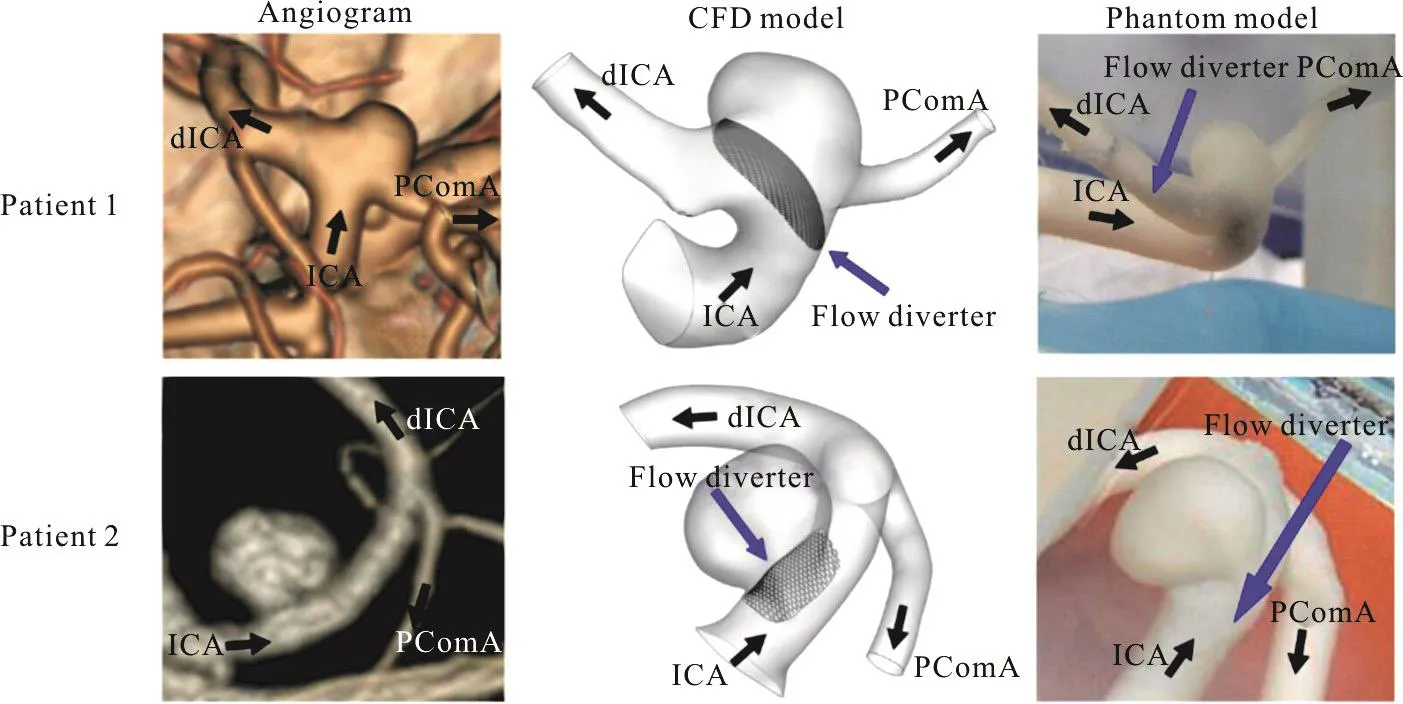
Fig.1(a) (Color online) The configurations of the bifurcation aneurysm (patient 1) and the side-wall aneurysm (patient 2).(left)CT angiograms, (middle) computational models, (right) phantom models.ICA = internal carotid artery, dICA = distal internal carotid artery, PComA = posterior communicating artery
The three-dimensional computational models were reconstructed from the computed-tomography(CT) angiographs by the software Mimics (Materialise,Leuven, Belgium) for CFD analysis (Fig.1).Utilizing the computer aided design software SOLIDWORKS(Dassault Systemes, USA), the experimental phantom models with uniform wall thickness of 0.8 mm were printed with a high-resolution stereolithography machine (Eden 350 V, Objet Geometries, Rahovot,Israel), with a compliant photopolymer (FullCure 930,Objet Geometries) and removable supporting photosensitive resin (FullCure 705, Objet Geometries) (Fig.1)[34].
1.2 Computational fluid dynamics simulations
A virtual flow diverter was designed following the configuration of a Pipeline Embolization Device(PED), and was implanted into the aneurysm models on the SOLIDWORKS platform[35].Basically, the stent was created by following the curvature of the parent vessel.At the aneurysm neck region, the stent was generated by extrapolating the vessel wall with the use of three dimensional sketch in SOLIDWORKS.This computational stent was a mesh-like device, with the rhombus-shaped closed cells assumption and the pore size matching that of the PED in fully deployed conditions.The porosity of the stent was about 65% -70%[36], with an assumption that this porosity matched with that in the experiments.The diameter of the stent struts was 0.03 mm.As the stent was postulated to be a rigid device, the part in contact with the blood vessel was not modeled in order to reduce the computational effort[37].This simplifying assumption is reasonable as the dimension of the stent struts is much smaller compared with that of the parent vessel.
Computational mesh with tetrahedral elements was created with GAMBIT 2.4.6 (ANSYS, Canonsburg, Pennsylvania, USA) and CFD simulations were performed by FLUENT 6.3 (ANSYS, Canonsburg,Pennsylvania, USA).A spatial grid size of 0.3 mm was selected in the models, and the grids were locally refined if necessary to maintain the spatial resolution,ensuring that the aneurysmal flow can be visualized clearly.For the post-stenting models, the spatial grids were further refined to 0.015mm.Furthermore,validation of the numerical results through mesh independence tests had been performed, which ensured that the hemodynamic parameters determined would only differ by 1%-2% if the number of elements were doubled[28].
The three-dimensional fluid flow was governed by mass conservation (the continuity equation) and the momentum consideration (the Navier-Stokes equations).These equations are (repeated indices imply summation):
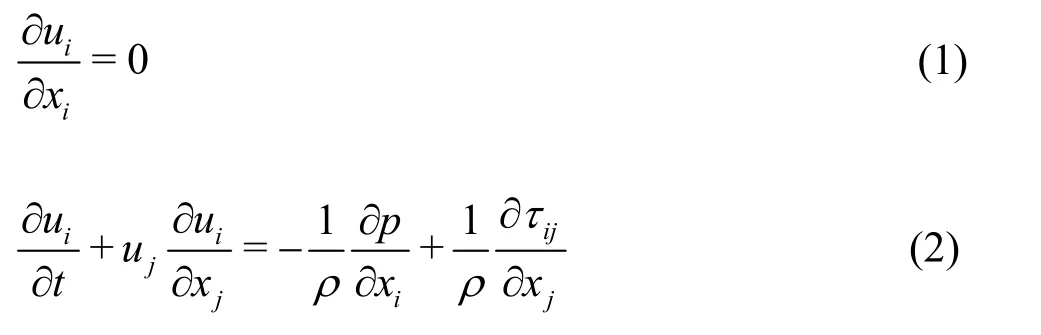
whereui(i= 1,2,3) is the components of the velocity vector,ρis the fluid density,pis the pressure,andijτis the normal stress and tangential shear stress.These equations were iteratively solved by the unsteady solver in FLUENT with a time step size of 0.001 s and a residual error of continuity of 10–6[38].The modeled fluid is blood and blood cells are neglected.Blood is treated as a Newtonian fluid[31,33],with a density of 1 037 kg/m3and a viscosity of 4.096× 10⁻³kg/m⋅s-1.The vessel walls and the stent were postulated to be rigid and no-slip condition were imposed.
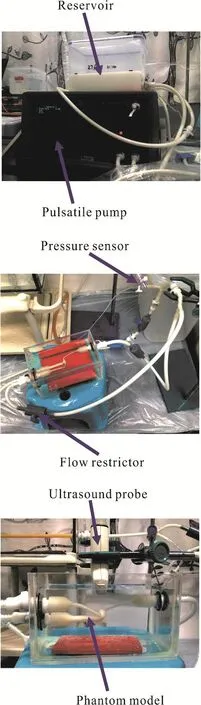
Fig.1(b) (Color online) The experimental set-ups showing all the major components
A flat pulsatile velocity waveform was prescribed at the inlet.The peak systolic flow rate was set as 6 mL/s (6 000 mm3/s), mimicking the flow in internal carotid artery (ICA).On the other hand, a time-dependent pressure waveform of 120/80 mmHg(1 mmHg = 133.3 Pa) was imposed at the outlets (Fig.1).Such profile was also utilized in our work and other papers in the literature[28].The cardiac period was selected as 0.8 s (modeling a heart rate of 75 beats per minute).The maximum Reynolds number at the inlet during the systole phase was 340, and hence the flow could be treated as laminar[13].Furthermore,the Womersley numberα, which measures the transient effects of the fluid flow, was taken as 3.8 in this study.
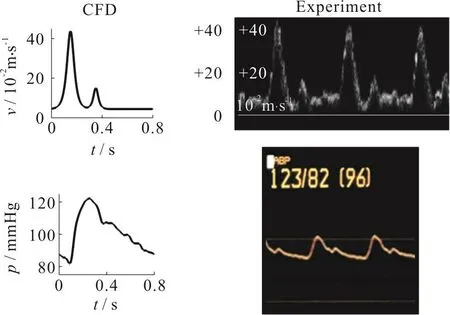
Fig.1(c) (Color online) (top) Volume flow rate waveform at inlet, (bottom) Pressure waveform at outlets
The effect of downstream flow resistance was investigated by varying the pressure boundary conditions at the distal internal carotid artery (dICA)outlet.The CFD pressure waveforms at the dICA outlet were adjusted by adding or subtracting constant pressure values (less than 3 mmHg) to match the experimental setting using the volume flow split ratios as reference.The flow velocity and streamline patterns in the interior domain and inside the aneurysm obtained from CFD simulations and experimental measurements were then compared.Typically three cycles of computations were needed for a periodic output, and the systole phase properties of the last cycle were reported in the subsequent presentations below.
1.3 Ultrasonography measurements in the physical models
Each aneurysm model with or without PED deployed was mounted and aligned on an acrylic casing (Fig.1).The pulsatile flow was generated by a computer controlled gear pump (AccuFlow-Q, Shelley Medical Imaging, London, ON, Canada)[34].A physiological monitor (HP Agilent CMS-2001/M1006B,Agilent Technologies, Böblingen, Germany) with pressure sensing catheter was deployed at the outlets to record the real-time intraluminal pressure.A blood-mimicking fluid integrated with acoustic scattering strength and an acoustic speed of 1 548 m/s(Shelley Medical Imaging) was used as the flow medium[39].
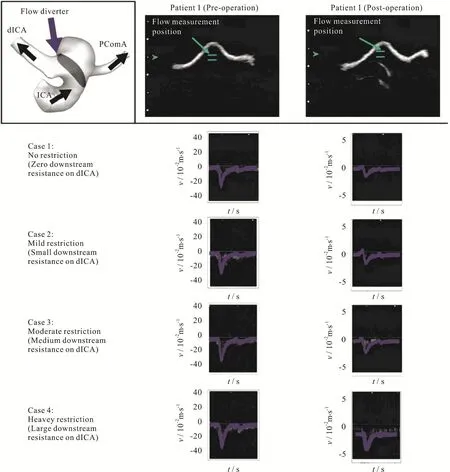
Fig.2 (Color online) Computational simulations and pulse-wave Doppler spectrograms for patient 1 showing the velocity field near the neck of the aneurysm, before (left column) and after (right column) deployment of the flow diverter stent.Effects of downstream resistance simulated by varying the valve at the dICA outlet.Flow velocity inside the stented aneurysmal sac in the “heavy restriction” case much higher than that of the “no restriction” case.Blue curves indicates the computational results while the white signals are from ultrasound flow measurements
To investigate the effect of downstream resistance, the valve of the dICA outlet was adjusted to 0%,40%, 70% and 90% restriction, termed here as “no,mild, moderate and heavy restriction” respectively.The flow split ratios between the two outlets and the pressures were recorded for the numerical simulations.Since measurements of blood flow rate in a specific artery are feasible with the use of MRI techniques[40],the flow in the PcomA and nearby vasculature has been investigated previously.The blood flow rate in the distal internal carotid artery (dICA) will be much higher than that in PcomA under normal circumstances.However, if the patient suffers from P1 hypoplasia, then the blood flow in PcomA will be dramatically enhanced[41].Consequently, the downstream resistance of the vessels and the flow split ratio might be patient dependent, and could vary to a great extent.
For the flow measurement inside the aneurysmal sac, an ultrasound scanner (SonixTouch, Ultrasonix,Richmond, BC, Canada) embedded with a linear array transducer (L14-5, Ultrasonix) transmitting at frequency 5 MHz was utilized.The transducer was placed 1 cm above the aneurysm apex, while an imaging plane was selected to maximize the flow visualization.The experiment was repeated by another candidate to ensure the reproducibility of the results.The axial flow velocity at the neck of the aneurysm was measured with pulse-wave Doppler for over 30 pulse cycles[42].Color Doppler technique was emplo-yed to capture the global axial flow profile, and represented by a two dimensional color map.In addition, the pulse repetition frequency was chosen to be 1.3 kHz and 2.0 kHz for Patient 1 and 2 respectively, both with a 31 Hz wall filter to allow flow visualization comparison between the prestenting and post-stenting cases.

Fig.3 (Color online) Computational simulations and pulse-wave Doppler spectrograms for patient 2 showing the velocity field near the neck of the aneurysm, before (left column) and after (right column) deployment of the flow diverter stent.Effects of downstream resistance simulated by varying the valve at the dICA outlet.Flow velocity inside the stented aneurysmal sac in the “heavy restriction” case almost identical to than that of the “no restriction” case.Blue curves indicates the computational results while the white signals are from ultrasound flow measurements
2.Results
It is believed that the formation of high velocity flow jet inside an aneurysm can lead to a dangerous scenario.A point with spatial maximum velocity at the neck of the aneurysm was chosen as an illustrative example to assess the velocity field in this computational-experimental analysis.Firstly, for both patients, the velocity profiles over one pulse cycle from CFD exhibited reasonably good agreement with those obtained experimentally (left column of Figs.2,3), over a range of realistic volume flow split ratios as described in Tables 1, 2.Both the waveform and the maximum amplitude matched with the experimental measurements, with a discrepancy of about 10% when comparing the two columns for velocity data in Table2.Generally speaking, after the deployment of the flow diverter, the velocity was reduced considerably,but again matching with about 10% discrepancy was found between CFD and experiments for both patients(right column of Figs.2, 3 and Table2).This observation is consistent with the findings presented in the previous work[28].It should be noted that the same phantoms and the CFD configurations were utilized here as in the previous work[28].The main difference is that the effect of downstream resistance has been investigated in the current work.
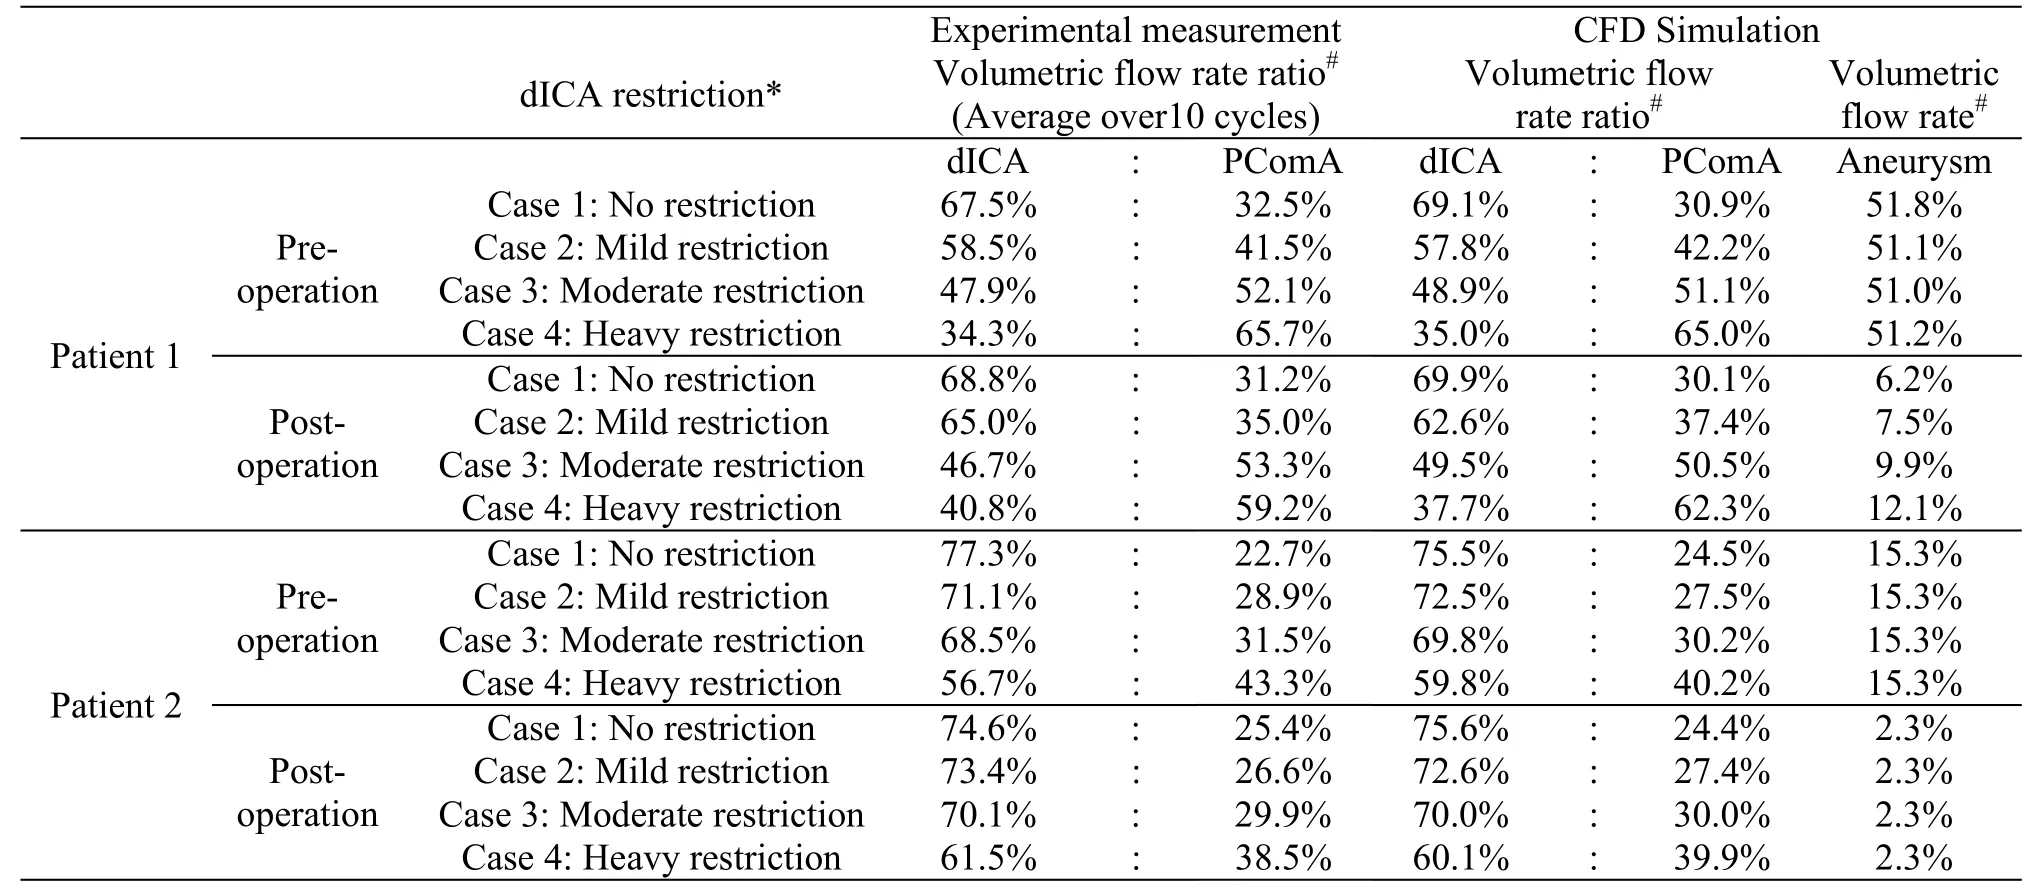
Table1 The volume flow split ratios for different dICA restrictions are determinedbothcomputationally and experimentally.The volume flow rate into the aneurysmal sac, a crucial factor in the thrombosis process, is also determined computationally.This flow rate would vary considerably in stented bifurcation aneurysm (patient 1) under different dICA restrictions
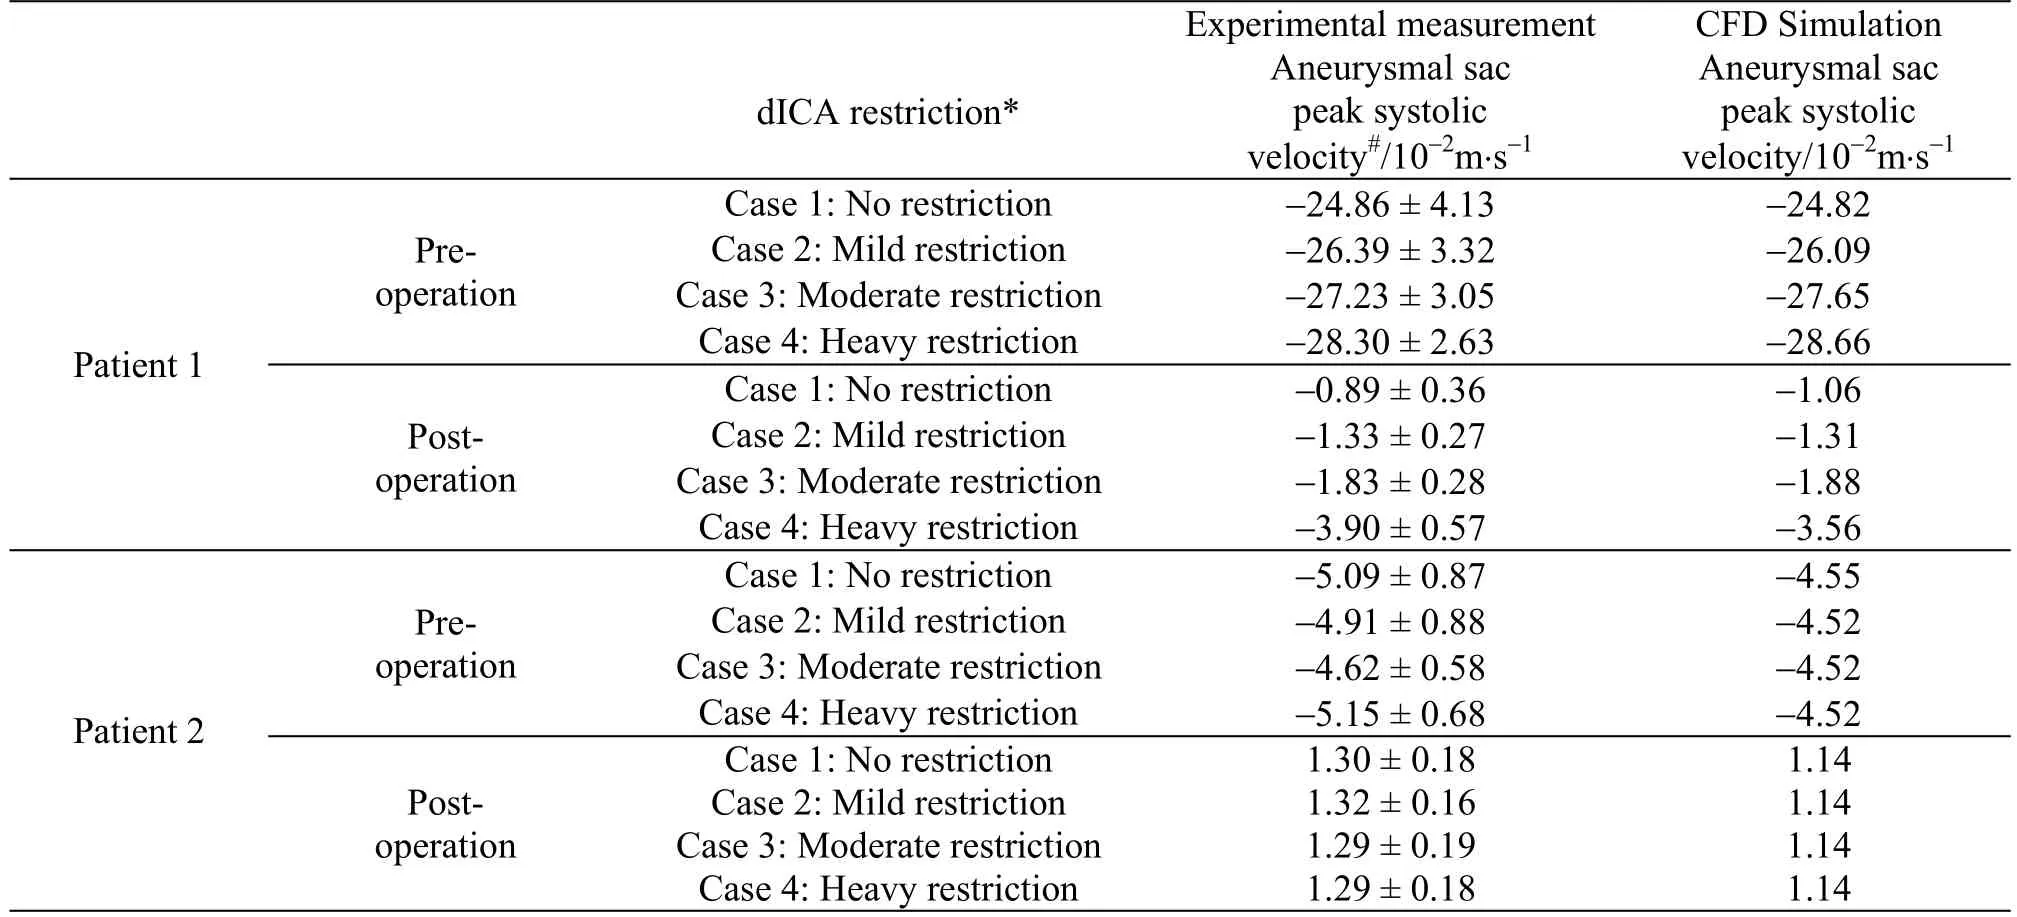
Table2 The peak systolic velocities inside the aneurysmal sac for different dICA restrictions are determined both computationally and experimentally.This velocity would vary considerably in a bifurcation aneurysm (patient 1),especially after deployment of the flow diverter stent, under different dICA restrictions
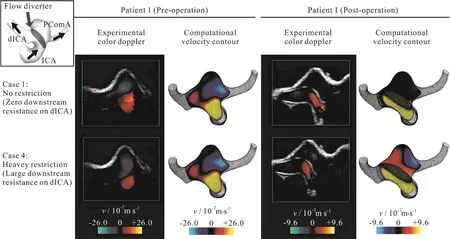
Fig.4 (Color online) Computational velocity contour plots and color Doppler ultrasonography for patient 1 showing considerable velocity reduction inside the aneurysm after deployment of the flow diverter stent.Color scales of the pre-operative and post-operative cases are different.Restriction on the dICA outlet resulting in sizable flow reduction into the aneurysm for a stented bifurcation aneurysm
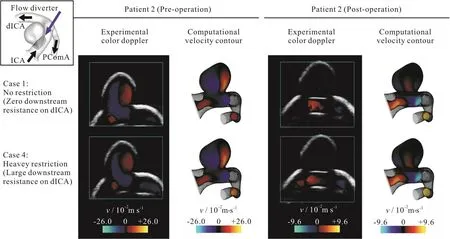
Fig.5 (Color online) Computational velocity contour plots and color Doppler ultrasonography for patient 2.Color scales of the pre-operative and post-operative cases are different.Flow into the aneurysm independent of the level of restriction at the dICA outlet for a side-wall aneurysm
Secondly,the importance of downstream resistance was illustrated by varying the flow split ratios at the two outlets.As the downstream resistance of one branch (the dICA) increased, more blood would flow to the other branch (the PComA).However, this change in flow split ratio in the daughter branches would not dramatically alter the flow into an aneurysm, except for the case of stented bifurcation aneurysm (right column of Fig.2, Tables 1, 2).For a bifurcation aneurysm treated with flow diverter, the flow rate into the aneurysm could be almost doubled(from 6.2%-12.1% of the total influx into the model,Table1) as the valve of the dICA outlet was adjusted from 0% to 90% restriction.Here a 90% restriction would indicate an extremely high downstream resistance.Furthermore, the corresponding change in the flow speed inside the aneurysm was even more dramatic.The flow speed could be three times greater(from 1.06 -3.56 m/s) as the dICA valve was adjusted from 0% to 90% restriction.
Thirdly, color Doppler imaging was employed to assess the entire flow domain.Experimental measurements were compared against the computed flow configuration and reasonably good agreements were observed qualitatively.Here, only the vertical component of the velocity was shown, as an ultrasound probe can only measure the flow direction parallel to the ultrasound beam.The matching was also observed for the post-operation stage of patient 1 (right column of Fig.4, Table1).As the downstream resistance of dICA increases, more blood flow would enter the bifurcation aneurysm.For patient 2, the flow dynamics was basically independent on the volume flow split ratio downstream (Fig.5, Table1).
Finally, the vorticity of the aneurysm flow and the streamline pattern before and after flow diverter were also studied using CFD simulations (Fig.6).Computational results here suggested that the maximum vorticity of the fluid flow inside the aneurysmal sac was reduced by more than 80% in both aneurysms after the deployment of the flow diverter at the peak systole.The aneurysmal flow pattern was also altered by the presence of flow diverter.With the stent deployed, blood flow was diverted to the downstream portion of the parent artery instead of entering the aneurysm.Consequently,the velocity inside the aneurysm was reduced significantly.However, the effect of downstream resistance on the aneurysmal vorticity pattern was negligible.
3.Discussion
The clinical efficacy of flow diverters in the treatment of an aneurysm depends on the degree such pathological swellings can be isolated from the main circulation.This stimulated a growing interest in applying computational fluid dynamics models to predict the treatment outcome of flow diverters in patient-specific cases.The present study focused on the different hemodynamic effects of a flow diverting stent on the aneurysm for various downstream flow configurations, in both side-wall and bifurcation aneurysms.The computational results were further verified in an experimental setting with realistic phantom model and Doppler ultrasound flow measurement.
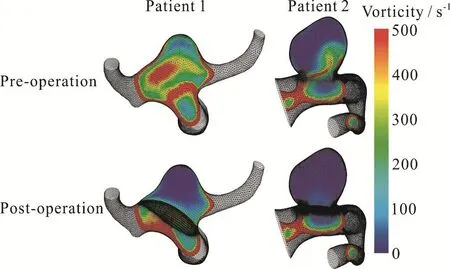
Fig.6(a) (Color online) Computational vorticity contour plots of patient 1 and patient 2 before and after deployment of the flow diverter stent.Vorticity inside the aneurysm effectively destroyed after the deployment of the flow diverter

Fig.6(a) (Color online) Computational vorticity contour plots of patient 1 and patient 2 before and after deployment of the flow diverter stent.Vorticity inside the aneurysm effectively destroyed after the deployment of the flow diverter
Recent works have suggested that employing patient-specific boundary conditions in CFD might provide a more accurate assessment of the clinical outcome[8].Furthermore, varying the volume flux split ratio at the outlets for a constant inflow will have a dramatic influence on the flow into the aneurysmal sac located at an arterial bifurcation[24-25].Indeed the flow to one branch may remain intact, while flow to the aneurysmal sac and the other outlet is severely hindered by the stent if the downstream resistance there is large.Hence the precise assessment of such“peripheral” resistance is essential.
The effect of flow diverter on an aneurysm located at the bifurcation of the posterior communicating artery (PComA) was illustrated in patient 1.With increasing flow via the PComA, as in the case of large persistent fetal PComA, the flow diversion effect on the aneurysm was reduced.The residual flow in the aneurysm sac after PED treatment is almost doubled if the proportion of blood-flow through the PComA was increased from 30.1% to 62.3% of total inflow.Such effect was not observed if the aneurysm is located more proximally at the side-wall of the parent artery.For a side-wall aneurysm as illustrated for patient 2,the inflow into the sac will depend more on the local geometry, the flow angle and possible jet formation rather than the boundary conditions at a bifurcation further downstream.
To verify these CFD results, a joint computational-experimental study was performed on both the bifurcation and side-wall aneurysm models.Ultrasonography measurements of aneurysm flow and CFD simulations produced results which were in reasonably good agreement, with a discrepancy in velocity data of about 10%.In contrast with many joint studies earlier in the literature which concentrated on the flow properties alone, we verified the success of the flow diverter stents in isolating such pathological swellings from the main circulation.Most importantly, we varied the flow split ratios of the two daughter branches and illustrated how the downstream resistance affects the aneurysmal flow in the upstream portion of the artery.An increase in the downstream resistance of one outlet will alter the flow into a stented bifurcation aneurysm upstream by 236%.Furthermore, our results also support the notion that flow rate along an outlet branch will decrease if the resistance further downstream is increased.
Many risk factors of aneurysm rupture have been studied in the literature, from geometric ones like size and aspect ratio to more recent ones involving hemodynamics like stability of the aneurysmal flow patterns and a steady state analysis[25].The vorticity of the flow, the vector product of the gradient operator and the velocity vector, is a measure of flow circulation and degree of rotation, and as such indicates the degree of complexity of the flow inside the domain[5].Absence of vorticity in a flow pattern with curved streamlines is consistent with a higher likelihood of thrombosis[33].Vorticity as spatial gradients of the velocity field will be difficult to measure experimentally but can be obtained from CFD effectively.Indeed this parameter has been calculated for idealized models of side branch aneurysm and coiling[43-44].Our study provided information on the vorticity in patient-specific configurations of bifurcation aneurysms after flow diverter treatment.The annihilation of vorticity after stent deployment may correspond to subsequent thrombosis and is potentially another useful parameter in the study of treatment effect on aneurysms.
From earlier studies, the choice of imaging modality generally will not have a large impact in the comparisons with the results of computer simulations for a given patient[45], and we have demonstrated that ultrasonography will be a promising candidate in the future.The blood flow velocity data, however, do vary from one patient to another[46].Hence the precise downstream resistance for a bifurcation aneurysm,which will profoundly influence the boundary conditions, must be assessed accurately.A possible solution might be prescribing patient-specific outflow conditions of a bifurcation aneurysm.Studying other hemodynamic parameters discussed in the literature,e.g., oscillatory shear index, is important, as these parameters may play a role in aneurysm rupture too.Furthermore, these indicators are believed to vary with changing downstream resistance as well, and the precise dependence will be reported in future publications.
4.Conclusion
Computational fluid dynamics technique is an important tool in determining the complex blood flow patterns in an intracranial aneurysm[47-51].The importance of utilizing patient-specific boundary conditions in numerical simulations has been addressed recently in the literature[8,24-25].A joint computational-experimental study is conducted here on patient-specific configurations using ultrasonography and the software FLUENT.Reasonably good agreements between the velocities from the two approaches are obtained, with a discrepancy of about 10% between the two sets of data.The flow resistance downstream, i.e., boundary conditions, at the outlets will play a pivotal role in determining the splitting of the volume flux at the daughter vessels.This splitting will in turn significantly affect the flow into the aneurysmal sac of a stented bifurcation aneurysm but not that of a side-wall one.Future work including performing fluid-structure interaction simulations may provide further insight[52-54].Consequently, downstream resistance of a bifurcation aneurysm should be carefully assessed when investigating the post-treatment flow dynamics for clinical management.Utilizing patientspecific outflow conditions might be a possible solution.
Acknowledgement
Partial financial support has been provided by the Seed Funding Program for Basic Research of The University of Hong Kong, and Innovation and Technology Fund (ITS/150/15) of the Government of the Hong Kong Special Administrative Region.We thank Synapse Therapeutic Limited (Hong Kong) for donating the Pipeline Embolization Device used in this study.

- 水动力学研究与进展 B辑的其它文章
- Call For Papers The 3rd International Symposium of Cavitation and Multiphase Flow
- Two-phase SPH simulation of vertical water entry of a two-dimensional structure *
- A selected review of vortex identification methods with applications *
- Tracer advection in an idealised river bend with groynes *
- Simulation of the overtaking maneuver between two ships using the non-linear maneuvering model *
- Nonlinear dynamic characteristics of a multi-module floating airport with rigid-flexible connections *