
High-speed experimental photography of collapsing cavitation bubble between a spherical particle and a rigid wall *
2019-01-05 08:08YuningZhang张宇宁XiaoyangXie谢箫阳YuningZhang张宇宁YongxueZhang张永学
水动力学研究与进展 B辑 2018年6期
Yu-ning Zhang (张宇宁), Xiao-yang Xie (谢箫阳), Yu-ning Zhang(张宇宁),Yong-xue Zhang (张永学)
1. College of Mechanical and Transportation Engineering, China University of Petroleum-Beijing, Beijing 102249, China
2. Beijing Key Laboratory of Process Fluid Filtration and Separation, China University of Petroleum-Beijing,Beijing 102249, China
3. Key Laboratory of Condition Monitoring and Control for Power Plant Equipment (Ministry of Education),School of Energy, Power and Mechanical Engineering, North China Electric Power University, Beijing 102206, China
4. School of Nuclear Science and Engineering, North China Electric Power University, Beijing 102206, China
Abstract: The synergetic effects between cavitation bubbles and silt particles on the damages of materials are essential problems in fluid machineries. For studying the underlying microscopic mechanisms, in the present paper, the dynamic behaviors of a single cavitation bubble between a spherical particle and a rigid wall are experimentally investigated with a high-speed camera. The results indicate that the existence of the particle can affect the bubble shape during collapse and significantly accelerate the collapse velocity of the bubble. The influences of the particle size, the distance between the bubble and the particle and the distance between the bubble and the rigid wall on the phenomena are qualitatively and quantitatively analyzed. These parameters can prominently affect the collapse velocity of the bubble (especially its maximum value).
Key words: Cavitation, particle, bubble dynamics, bubble collapse
Introduction
Due to its significant mechanical effects, cavitation is one of the pivotal causes leading to material damage of flow passage components of various kinds of fluid machineries, for instance, pumps[1-3]and turbines[4-6]. When the fluid contains solid particles,the damage of materials will be promoted, owing to the synergetic effects between particle abrasion and cavitation erosion, which affects the efficiency and the safe operation of fluid machineries[7]. Therefore, this problem has been intensively investigated in recent years. Because the synergetic effects involve three phases (i.e. the cavitation bubbles, the solid particles and the fluid), the influencing factors are numerous,such as pressurization[8], type of particles[8], surface structures of particles[9], shape of particles[10], size of particles[11-12], surface of flow passage components[13],memory effects[8]and so on. Nevertheless, the simultaneous appearance of the cavitation and the particles sometimes weakens the damage of material instead of enhancement[14]. Hence, further researches on the underlying mechanisms, especially the microscopic mechanisms, of the synergetic effects between particles and cavitation are badly needed.
The interactions between cavitation bubbles and particles play essential roles in synergetic effects. The micro jets and shock waves emitted during the growth and the collapse of cavitation bubbles can affect the velocity and the direction of the moving particles[15-19].Poulain et al.[15]studied the dynamics of a spherical particle driven by a single bubble. When the bubble grows, the particle is pushed away, while it is attracted to the bubble when the bubble collapses. The velocity of the particle approaching to the bubble shows an inverse fourth-power-law relationship with the distance between the bubble and the particle. Ohl et al.[16]employed a similar experimental system and found that the direction and the velocity of the particle motion were affected by the distance between the bubble and the particle. Wu et al.[17]and Borkent et al.[8]both found that the bubble could accelerate the particle much smaller than the bubble to a very high speed during the bubble growth. On the other hand,the particle could also influence the dynamics of the bubble near it. In our previous work[20], the dynamics of a single bubble near a spherical particle has been investigated. There were three typical behaviors of the bubble which depend on both the distance between the bubble and the particle and the bubble size.Meanwhile, the cavitation jets were also impacted by the presence of the particle[20]. Li et al.[21]studied the interaction between a gas bubble and a suspended sphere numerically and revealed the physical mechanisms of the bubble behaviors.
In practice, the damages can only occurred when the cavitation and the particles are near the flow passage components. However, all the literatures discussed above did not consider the effects of the rigid boundary, which could affects nearby bubbles significantly[22]. Li et al.[23]numerically and experimentally studied the interactions between a cavitation bubble and a spherical particle near a rigid boundary,finding that the bubble behavior mainly depends on two non-dimensional parameters representing the bubble position. Xu et al.[24]investigated the dynamic behaviors of the cavitation bubbles between the spherical particle with different sizes and a rigid wall experimentally. In their research, the particle size and the non-dimensional distance are found having a significant impact on the bubble behavior.Unfortunately, the involved cavitation bubble scales in Xu et al.[24](e.g., with the order of centimeters) and the particle sizes in previous work were rather large.And owing to the limitations of the bubble generation method (electric discharge) and the operational speed of the camera, the detailed bubble behaviors (e.g. the motion of the bubble wall) have not been quantitatively analyzed in the previous work.
Therefore, in the present paper, an experimental system was designed to generate a single cavitation bubble by a focused laser between the particle and the rigid wall. And the bubble behaviors were recorded by a high-speed camera with the microscopic lens. With the aid of this experimental system, the characteristics of the bubble were investigated in detail.
1. Experimental setup
Figure 1 is the schematic diagram illustrating the experimental system for investigating the bubbleparticle-wall interactions. A pulsed laser beam was focused through the focusing lens to generate the single cavitation bubble in an acrylic water chamber,which was induced by a Q-switched Nd: YAG laser generator (pulse length 6 ns, maximum pulse energy 30 mJ). The size of the bubble could be adjusted by tuning the output pulse energy of the laser through a control panel. For the protection of the water chamber,the laser passed through a resistant glass embedded on the chamber wall. A solid boundary (represented as“wall” in Fig. 1) setting on the bottom of the chamber was placed below the bubble. The size of the wall is far larger than the cavitation bubbles. A spherical glass particle was set right above the bubble. The particle was glued on a thin needle fixed to a 3-D displacement platform. Therefore, the distance between the bubble and the boundary could be controlled by moving the chamber and the particle position could be adjusted by the displacement of platform. For the protection of the water chamber, a laser resistant glass was embedded on the laser route when it passing through the water chamber. The bubble behavior was recorded by a high-speed camera (Phantom V1212) with a framing rate of 240 000 frames/s. A flash light and a LED spotlight are both employed to provide proper lighting during the whole working period of the camera. A piece of frosted glass was mounted between the light and the bubble to make the uniform brightness of the photograph. The flash light,the high-speed camera and the laser generator are synchronized by a digital delay generator which was controlled by a computer.
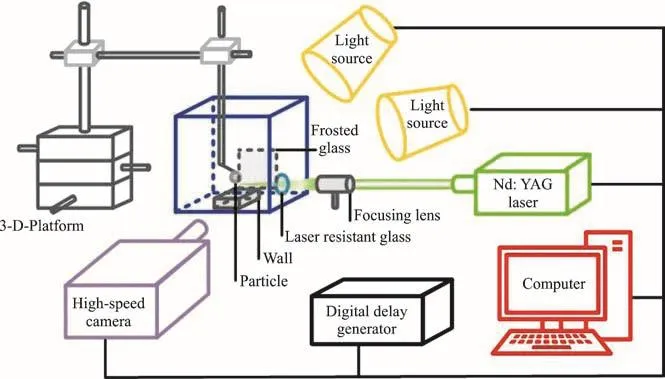
Fig. 1 (Color online) Schematic of the experimental system
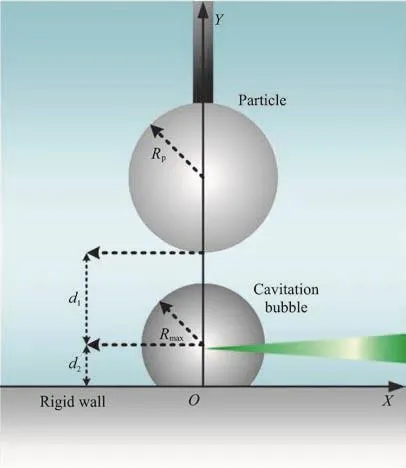
Fig. 2 (Color online) Schematic diagram of key parameters in the experiments
Figure 2 shows the detailed setups of the bubbleparticle-wall system in the present experiment. In this figure,maxR indicates the maximum radius of the bubble during its dynamic oscillations,pR indicates the radius of the particle,1d indicates the distance between the bubble center and the lower surface of the particle,2d indicates the distance between the bubble center and the rigid wall surface. The particle center and the bubble center were kept on the Y axis during experiments.
2. Typical characteristics of the dynamics of bubble collapse
In this section, the impacts of the particle on the dynamics of the bubble collapse near the rigid wall are investigated. The collapse of the bubble near the wall without the particle is shown in Fig. 3. Figures 4-6 show the bubble dynamics near the wall below the particle with radiusp( )R equaling to 1.0 mm, 1.5 mm and 2.0 mm, respectively. In this section, the cavitation bubbles shown in all the pictures are with a maximum bubble radius (maxR , estimated based on the maximum -X direction width of the bubble) of 1.1 mm. And the distances between the bubble center and the lower surface of the particle1( )d or the rigid wall2( )d are is 1.5 mm and 1.0 mm respectively.
Figure 3 shows typical behaviors of the bubble collapse near a rigid wall without particle. Firstly, at the stage of bubble growth, the shape of the upper part of the bubble is basically spherical, while the lower part is greatly affected by the rigid wall. After the radius of the bubble reaches its maximum (as shown in frame e), it begins to collapse. At the initial stage of the bubble collapse, the bubble shrinks slowly (as shown in frames f-j). Then the bubble interface shrinks faster in the Y direction than one in the X direction. During this stage, the bubble exhibits a strong anisotropy. The upper part of the bubble shows a distortion (as shown in frames k-n), which indicates that a micro-jet toward the wall may be generated.
In Fig. 4, a spherical particle with radius of 1.0 mm is placed right above the bubble. In this case, the dynamic behaviors of the cavitation bubble is similar with those shown in Fig. 3 without the particle.
In Fig. 5, a bigger particle (=1.5 mm)was employed. Compared with Fig. 3, the bubble is significantly affected by the particle at its initial stage of collapse, and the bubble is elongated (as shown in frames g-j). At this stage, the bubble wall gradually shrinks toward the bubble center, while the upper bubble wall moves much slower. At the next stage of the collapse, the velocity of the upper side of the cavitation bubble is accelerated (as shown in frames k-o). At the final stage, a distortion is also observed on the upper side of the bubble, indicating that a micro-jet is generated here.
Figure 6 shows the case withp=2.0 mm.Compared to Figs. 4, 5, at the initial stage of the collapse, the elongation of the bubble is more intense(as shown in frames g-j). At this stage, there is almost no movement of the upper interface of the bubble,while the bubble interface gradually shrinks toward the center in the other directions. At the end of the collapse, the velocity of upper side of the bubble is sharply increased (as shown in frames k-o). A distortion of the upper side of the bubble is observed again, generating a micro-jet directed to the wall.
For comparisons of the bubble interface motions in different cases, in each photo of the experimental data, the dashed part as shown in framee of Fig. 3(with actual sizeof2.50mm×0.05mm)was extracted from different cases. The extracted part of the image was also located at the symmetrical axis of the bubble.
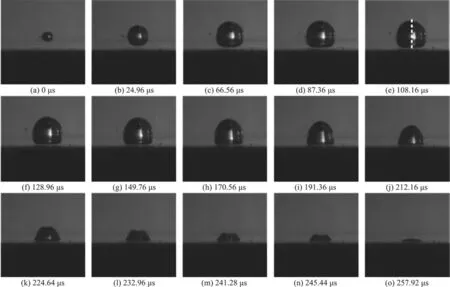
Fig. 3 High-speed photographs of the bubble dynamics near a rigid wall with no particle. The width of each frame is equivalent to the actual size of 6.3 mm (Rmax=1.1mm ,d2=1.0 mm)
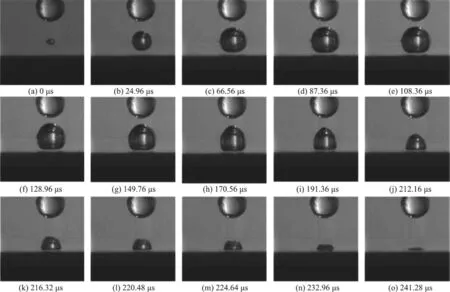
Fig. 4 High-speed photographs of the bubble dynamics between a rigid wall and a spherical particle with R p=1.0mm , Rmax=1.1mm, d1=1.5 mm, d2=1.0 mm
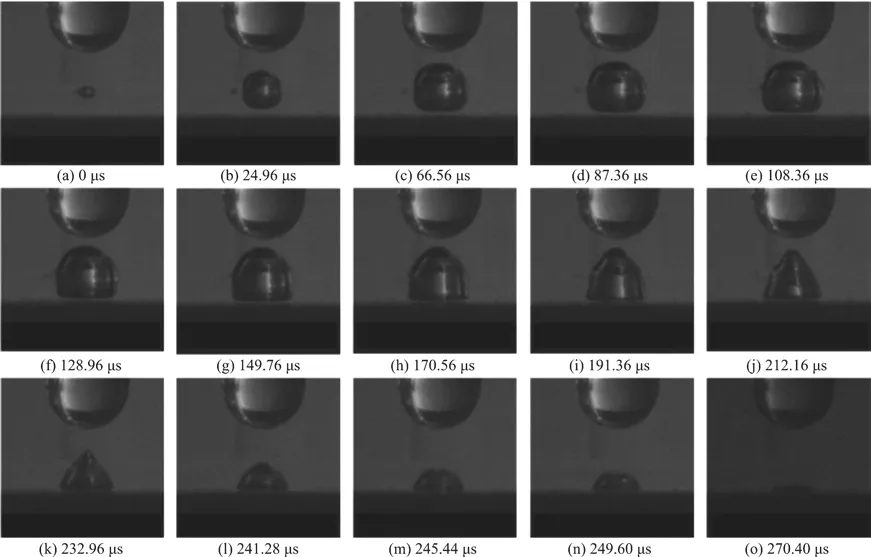
Fig. 5 High-speed photographs of the bubble dynamics between a rigid wall and a spherical particle with Rp=1.5mm , Rmax=1.1mm, d1=1.5 mm, d2=1.0 mm

Fig. 6 High-speed photographs of the bubble dynamics between a rigid wall and a spherical particle with R p=2.0mm , Rmax=1.1mm, d1=1.5 mm, d2=1.0 mm
Then all the extracted parts were arranged in the sequence of time in one picture. Therefore, in this picture, the movement of the upper wall of the bubble could be illustrated much more clearly. Furthermore,for comparison, the responding time of all these part was normalized by the time of the first period of bubble oscillation (represented as t*), i.e., the time period from the generation of the bubble to the time corresponding to its minimum volume.
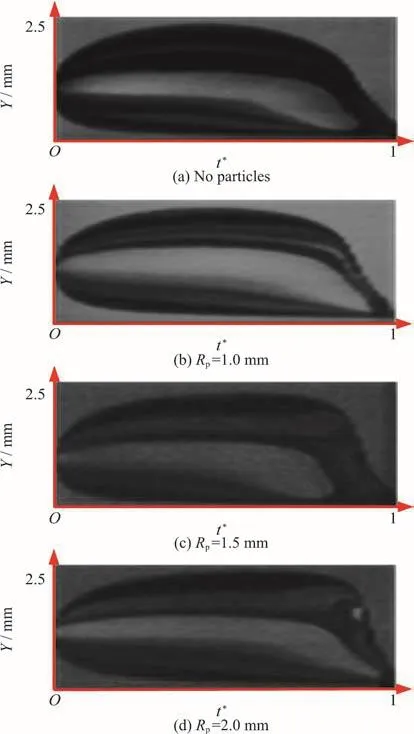
Fig. 7 (Color online) A synthesis of pictur es for illu stra ting the motions of the upper and thelowersidesofthebubble(Rmax=1.1mm , d1=1.5 mm , d2=1.0 mm )
According to the method mentioned above, the experimental data discussed in Figs. 3-6 were processed and shown in Fig. 7. In Fig. 7, the motions of the upper and the lower walls of the bubble collapsing without the particle (Fig. 7(a)) and the bubble collapsing near the particles with different sizes (Figs.7(b)-7(d)) are shown. During the growth stage, the motion of both the lower side and the upper side of the bubble is quite similar in all the four cases. During the stage of bubble collapse, compared with the phenomenon shown in Fig. 7(a), it is obviously that the presence of the particles could strongly affect the velocity of the upper side of the bubble especially at the late stage of collapse (as shown in Figs. 7(b)-7(d)).In addition, the cases with large particle could lead to a faster motion of the upper side of the bubble at the late stage of bubble collapse.
3. The influences of several parameters on bubble collapse
In this section, the influences of three parameters of the experimental system, i.e.,,and,are investigated. For convenience of discussion, the velocity of the movement of the upper wall of the bubble is represented as the “collapse velocity”. In the discussion of this section, the bubble collapse velocity at one moment is the averaged velocity of the upper wall of the bubble between two adjacent frames. The maximum bubble radiusmax( )R is 1.1 mm in all the cases discussed in this section.
3.1 The influences of the particle size
Figure 8 shows the variations of the collapse velocities with time during the stage of bubble collapse(the range of t*is from 0.5 to 1) for the four cases corresponding to Figs. 3-6. Whenthe collapse velocity is small and increases slowly. The collapse velocity roughly increases with the decrease of the size of the particle. Then, whenthe bubble collapse velocity increases much faster and reaches its maximum value approximately at0.95. At the late stage of bubble collapsecompared to the case with no particle, the existence of the particles lead to the maximum collapse velocity of the cavitation bubbles larger. Furthermore, the maximum collapse velocity of the cavitation bubble increases with the increase of the particle size.

Fig. 8 (Color online) The variations of the collapse velocities with time during the stage of bubble collapse (the range of being 0.5-1.0) for the four cases corresponding to Figs. 3-6, respectively (=1.1mm
3.2 The influence of the distance between the bubble and the rigid wall
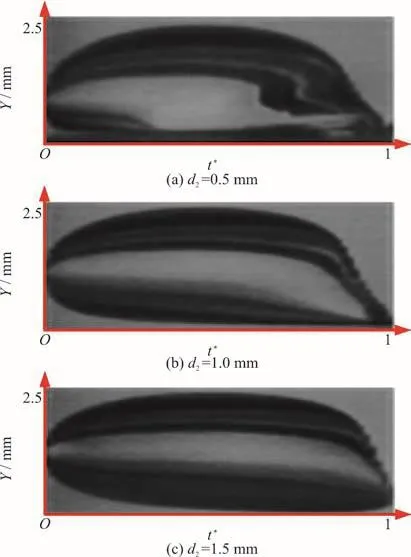
Fig. 9 (Color online) A synthesi s of picture s for illu strat ing the motions of the upper andthelowersidesofthebubble(Rmax=1.1mm , Rp=1.0mm , d1=1.5 mm)
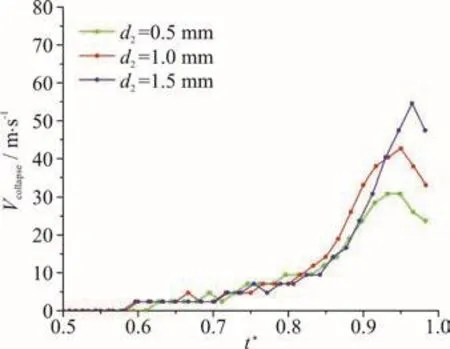
Fig. 10 (Color online) The variations of the collapse velocities with time during the st age of b ubble collaps e (the range of t* within 0.5-1.0)forthethreecasescorresponding to Fig. 9 (Rmax=1.1mm , Rp=1.0mm , d 1=1.5 mm)
In this section, six groups of data were selected to investigate the influence of the distance between the bubble and the rigid wall 2 (d ) on the collapse velocity of bubbles. Figure 9 shows the pictures synthesized from three cases with Rp=1.0 mm,d1=1.5 mm and d2=0.5 mm (Fig. 9(a)), 1.0 mm(Fig. 9(b)) and 1.5 mm (Fig. 9(c)) respectively. Figure 10 shows the variations of the collapse velocities with time during the stage of bubble collapse (the range of t*within 0.5-1.0) for the three cases corresponding to Fig. 9. It can be found that at the late stage of bubble collapse, the maximum value of the collapse velocity increases with the increase of d2. Figures 11,12 shows the comparisons of the collapse velocity of the three cases with Rp=2.0 mm, d1=1.5 mm,d2=0.5 mm, 1.0 mm and 1.5 mm. Similar conclusions can be drawn from these figures.
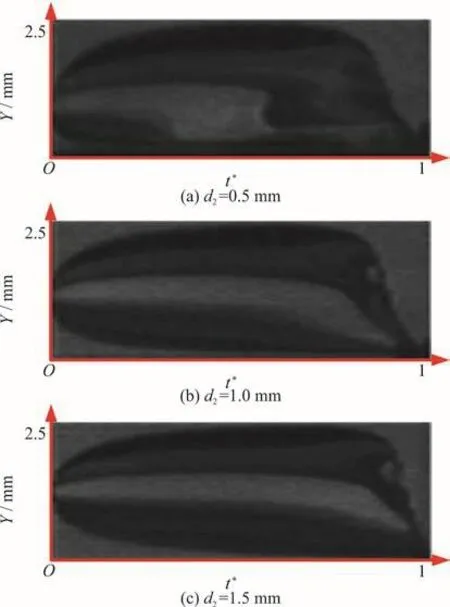
Fig. 11 (Color online) A synthesis of pictures for illu stra ting the motions of the upper and the lower sidesofthebubble(Rmax=1.1mm ,Rp=2.0mm , d1=1.5 mm)
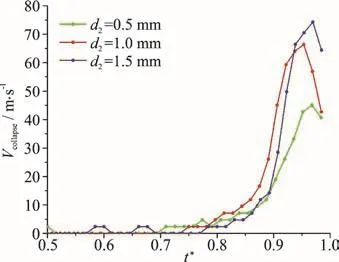
Fig. 12 (Color online) The variations of the collapse velocities with time during the stage of bubble collapse (the range of t* within 0.5-1.0) for the three cases corresponding to Fig. 11 (Rmax=1.1mm , Rp=2.0mm , d 1=1.5 mm)
3.3 The influence of the distance between the bubble and the particle
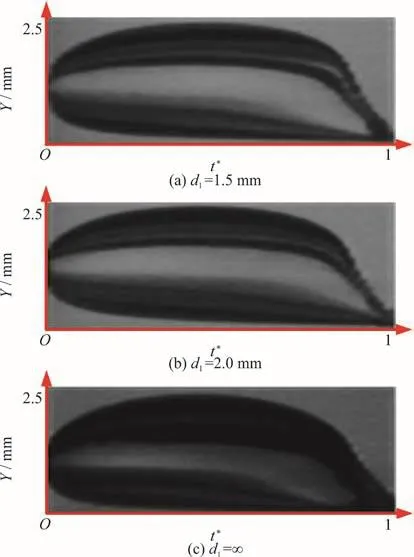
Fig. 13 (Color online) A synthesis of pictures for illustrating motions of the upper and the lower sides of the bubble
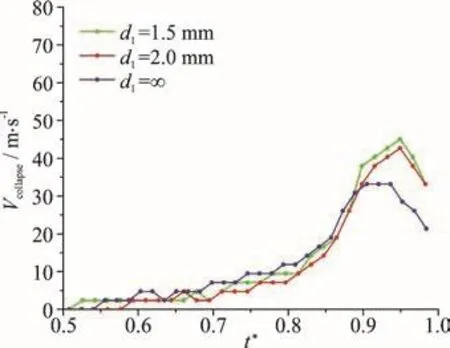
Fig. 14 (Color online) The variations of the collapse velocities with time during the stage of bubble collapse (the range of within 0.5-1.0) for the three cases corresponding to Fig. 13 (1.1mm , =1.0mm , =1.0 mm)
In this section, six groups of data were selected to study the influence of the distance between the bubble and the particle ( d1) on the bubble collapse velocity. Figure 13 shows the pictures synthesized from three cases with Rp=1.0 mm , d2=1.0 mm and d1=1.5 mm (Fig. 13(a)), 2.0 mm (Fig. 13(b))and ∞ (Fig. 13(c), no particle) respectively. Figure 14 shows the variations of the collapse velocities with time during the stage of bubble collapse (the range of t*within 0.5-1.0) for the three cases corresponding to Fig. 13. It can be found that at the late stage of bubble collapse, the maximum value of the collapse velocity increases with the decrease of d1. Figures 15,16 shows the comparisons of the collapse velocity of the three cases with a larger particle (Rp=2.0 mm)and d2=1.0 mm, d1=1.5 mm, 2.0 mm and ∞ (no particle). The trends of collapse velocity is quite similar with Figs. 13, 14.
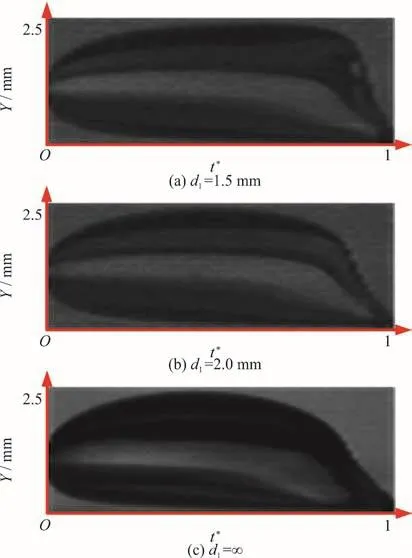
Fig. 15 (Color online) A synthesis of pictur es for illu stra ting the motions of the upper and thelowersidesofthebubble(Rmax=1.1mm ,Rp=2.0mm , d2=1.0 mm)
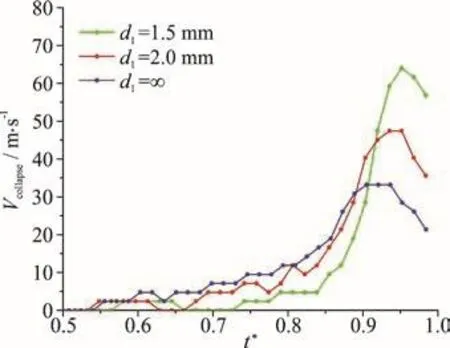
Fig. 16 (Color online) The variations of the collapse velocities with time during the stage of bubble collapse (the range of within 0.5-1.0) for the three cases corresponding to Fig. 15 (1.1mm ,=2.0mm , =1.0 mm)
4. Conclusions
In the present paper, the collapsing behaviors of a single cavitation bubble between a spherical particle and a rigid wall is investigated experimentally with high-speed camera. The cases without the presence of the particle are also illustrated for the purpose of comparisons. The influences of several parameters on the collapse of the bubble are discussed qualitatively and quantitatively. The primary findings of the present paper includes:
The particle could significantly affect the shape of the bubble during collapse, leading to the elongation of the bubble.
The collapse velocity of the bubble increases with time and reaches its maximum value at the late stage of the bubble collapse.
Three parameters (the size of the particle, the distance between the bubble and the rigid wall, and the distance between the bubble and the particle) are identified to have great influences on the collapsing behaviors of the bubble, especially in terms of the maximum value of bubble collapse velocity.
In the future, numerical simulations are needed for further revealing the variations of parameters of the flow field surrounding the bubble and the boundary together with the properties of the cavitation jets, to make the involved physical mechanism clearer(e.g., the effects of liquid compressibility[25], nanoscale bubbles[26], resonance effects[27], bubble-wave interactions[28]) with applications in various kinds of industrial flow (e.g., hydroturbines[29-31]). Furthermore,the cavitation induced vortex (or the turbulent flow[32])will be also investigated with the aid of some advanced vortex identification methods (e.g., a newly proposed Omega method[33-35]). For a detailed review of Omega method, readers are referred to a recent review by Zhang et al.[33].
Acknowledgment
This work was supported by the Science Foundation of China University of Petroleum-Beijing,(Grant No. 2462016YJRC003).

- 水动力学研究与进展 B辑的其它文章
- Call For Papers The 3rd International Symposium of Cavitation and Multiphase Flow
- Bubble dynamics and its applications *
- Experimental investigation of flow past a circular cylinder with hydrophobic coating *
- Transient peristaltic diffusion of nanofluids: A model of micropumps in medical engineering *
- Flow induced structural vibration and sound radiation of a hydrofoil with a cavity *
- Unsteady flow structures in centrifugal pump under two types of stall conditions *