
M id-infrared supercontinuum generation and itsapp lication on all-opticalquantization with different inputpulses*
2019-05-11 07:36YanLi李妍andXinzhuSang桑新柱
Chinese Physics B 2019年5期
关键词:李妍
Yan Li(李妍)and Xinzhu Sang(桑新柱)
State Key Laboratory of Information Photonicsand OpticalCommunications,Beijing University ofPostsand Telecommunications,Beijing 100876,China
(Received 5December2018;revisedmanuscript received 17 February 2019;published online22 April2019)
Keywords:m id-infrared,supercontinuum generation,all-opticalquantization
1.Introduction
Themid-infrared region is a very importantelectromagnetic radiation band containing two relatively transparentw indows in the atmosphere.It covers the characteristic spectral linesofmany importantmolecules.Therefore,a lightsource operating in this band is very suitable for long-distance transm ission in the atmosphere,as well as for gas sensing,free space communication,and high-precision medical and military applications.[1,2]Therefore,this region has attracted considerable interest from researchers.
Supercontinuum generation refers to the fact thatmany new frequenciesaregenerated in thespectrum of the transmitted pulse when a high-power ultrashort optical pulse passes through a nonlinear optical medium,such as a solid,liquid,gas,or sem iconductor,ow ing to various nonlinear effects in themedium.Consequently,the output pulse spectral w idth is considerably broader than the incident pulse w idth.SCG relies on the interplay of nonlinear effects,such as selfphasemodulation(SPM)and four-wavemixing(FWM),and most SCG studies realized with optical f ibers are diff icult to integrate.[3–7]Many smartSCG schemesbased on variousopticalwaveguides covering the visible and near-infrared wavelength regions were reported by many research groups over theyears.[8,9]In themid-infraredwavelength region,SCG has attracted increasing research interest.[5,10,11]
Comparedwith silicon-basedmaterialsand chalcogenide materials,in them id-infrared region,GaAswith a large nonlinear refractive index and aw ide transparency spectral range of 20μm has been w idely used as a substratematerial.[12,13]Therefore,it is very suitable for the generating the nonlinear effect in all-optical signal processing devices.AlGaAs is an alloy of GaAs and AlAs.When the A l content in A lGaAs changes,the refractive index of A lGaAs changes.[14–16]A fter yearsof development,the preparation technology of AlGaAs hasmatured,which results in easymass production and cost reduction.Thus far,theapplication of AlGaAswaveguides in nonlinearopticshasbeen extensively investigated.[14–16]
Many practical applications related to all-optical signal processing,ultra-high-speed optical systems,and nonlinear optics require a large variety of pulse waveforms other than Gaussian or secant pulse waveforms.The characteristics of input pulses,such as the pulse w idth,pulse energy,initial chirping,and initial pulse shape are very critical from the viewpoint of pulse evolution.In recent years,rectangular and parabolic pulseshaveattracted considerableattention owing to their favorable properties and features,such as resistance to opticalwave breaking,self-similarity in shape,and enhanced linearity in chirp.[17–19]Parabolic pulses propagate self-sim ilarly in a dispersive medium with normal dispersion and nonlinearity.Therefore,the amplitude and w idth scaling depends only on amplif ier parameters and the input pulse energy.[20]Ow ing to such features,parabolic pulses f ind a w ide range of applications,such as pulse compression and f lat spectral broadening.[21–23]Recently,many simple approaches to the generation of parabolic pulses have been demonstrated using super-structured f iber Bragg grating technology,[22,24]dispersion-decreasing f iberswithnormal group-velocity dispersion,[17,21,23,25]or AWG.[26]
The AOADC,which aims to overcome the drawbacks of electrical ADC,has attracted considerable attention.[27–31]As the key process of AOADC,many smart schemes of allopticalquantization techniquesdetermining thespeed and resolutionof conversionwereproposedwith nonlinearopticaleffects in optical f ibers,[28–36]while the vastmajority ofmature schemespertaining toopticalquantizationemploy solitonselffrequency shift(SSFS).[32–36]SCG in nonlinearmedia is an intensity-to-wavelength conversion of the input pulse,[37–40]and it is feasible for application in all-optical quantization.Several SCG-based quantization schemeswere demonstrated bymany research groups.[38–40]
Here,simulationsof SCG in them id-infrared region and its application on all-optical quantization are studied for the f irst time based on an AlGaAs horizontal strip waveguide with different types of input pulses,such as parabolic pulse,hyperbolic-secantpulse and theGaussian pulse.Ow ing to the largenonlinear refractive index of A lGaAs,a strong nonlinear interaction is realized,and the required power consumption of the quantization scheme is reduced eff iciently.Compared with the hyperbolic-secant pulse and the Gaussian pulse,the parabolic pulseoffersadvantagesin termsofbroadening,SCG coherence,and ADC performance.Asa result,four-bitquantization resolution alongwith ENOB of3.99 bitand a signal-tonoise ratio(SNR)of24.02 dB areachieved with the parabolic pulse,3.97 bitand 23.45 dB with the hyperbolic-secantpulse,3.973 bitand 23.92 dBwith theGaussian pulse.
2.Theoreticalmodeland waveguide design
2.1.Theoreticalmodel
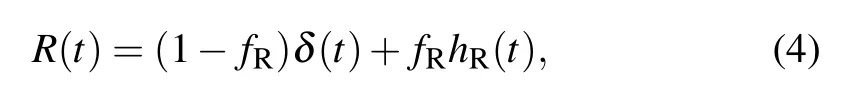
At room temperature,the Sellmeier equations of A lxGa1-xAs can be approximated as follows:[3,15]
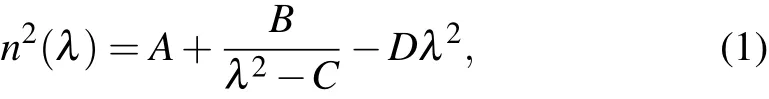
whereλis thewavelength inmicrometers,and thecoeff icients A,B,C,D are def ined as follows:
where,x represents themolarcontentofalum inum in A lGaAs.

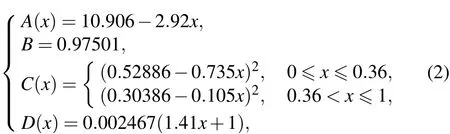
The dynam ic processof pulsepropagation in the AlGaAs waveguide can be modeled with the generalized nonlinear Schr¨odinger equation(GNLSE)[41](Eq.(3))and solved with the fourth-orderRunge–Kutta formula where A(z,t)is the slow ly varying envelope of the electric f ield,αis linear lossof thewaveguide,andβn(ω)is the n-th order dispersion parameter coeff icientat the center frequency ω0.The last item on the right side of equation(3)represents third-ordernonlineareffects,including self-phasemodulation(SPM)and delayed Raman response.[42]
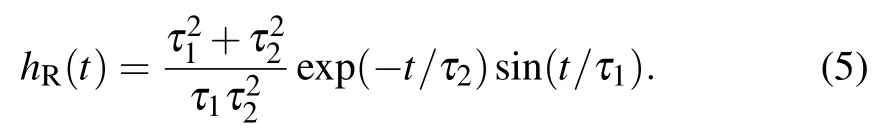
hR(t)as theRaman response function of thewaveguide isgiven as follows:[42]Here,τ1andτ2are two adjustable parameters.In the normal dispersion regime,R(t)is negligible ow ing to the small contribution of the Raman effect to SC generation.In the normal dispersion region,themain causeof SCG is SPM.
The hyperbolic-secant pulse occurs naturally in the contextof optical solitons and pulses em itted from a few modelocked lasers.[43]The temporalenvelopeexpressionassociated with such pulse isoften described with the follow ing form:and the temporal envelope of the Gaussian pulse can be described as

Compared to the other pulse shapes,the parabolic pulse is maintained as the pulse undergoes exponential temporal and spectralbroadening aswellas an increase in amplitude.Furthermore,the parabolic pulse can resist the deleteriouseffects of wave breaking,which severely degrades the evolution of pulsesevolving in anonlinear dispersivemedium.Theanalyticalexpression foraparabolic pulseofenergy isas follows:

In the above formulas,PPis the peak power of the pulse,TPis the temporal full-w idth athalf-maximum,and CPis the linear chirp coeff icient.Atmid-infrared,the parabolic pulse can begenerated in a tapered chalcogenidem icrostructured optical f iber,[44]or tapered silicon photonicw ires.[45]
2.2.Waveguide design
Asshown in Fig.1(a),thewaveguide isusedwith a strip structure.The core domain consists of Al0.18Ga0.82As,substratedomain ismadeof Al0.8Ga0.2As,and theupper cladding region isair.Specif ically,the dispersive value of the TEmode is smaller than that of the TM mode.Hence,the quasi-TE mode is selected as the propagation mode for this waveguide.The full-vector f inite elementmethod was used to analyze themode f ield distribution.The w idth w=6μm and height h=2.5μm of thewaveguideareoptim ized by analyzing the effectof thewaveguide geometricalparameterson the dispersion and effectivemode area formaximalnonlinear interaction.Mostof theguided-modeenergy is conf ined tightly within the core.
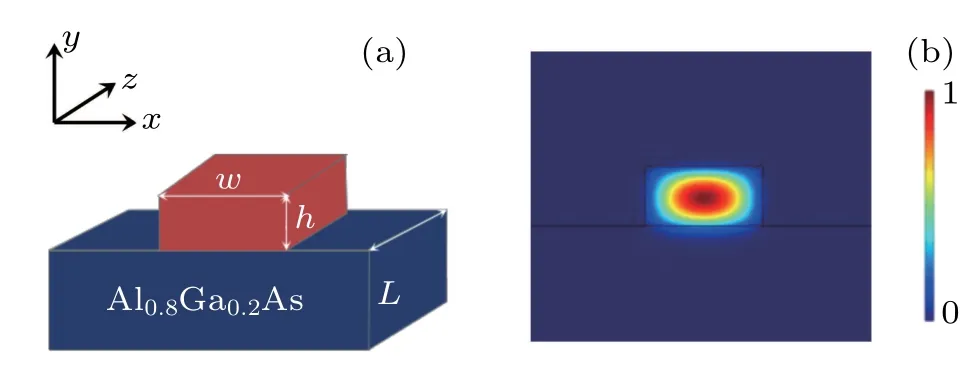
Fig.1.(a)Designed waveguide and(b)transverse prof ile of electric f ield forquasi-TE polarization.
The nonlinear coeff icient,γ0=2πn2/λ0Aeff,is determined by two factors,namely,nonlinear refractive index n2and effectivemode area Aeff(Eq.(9)).
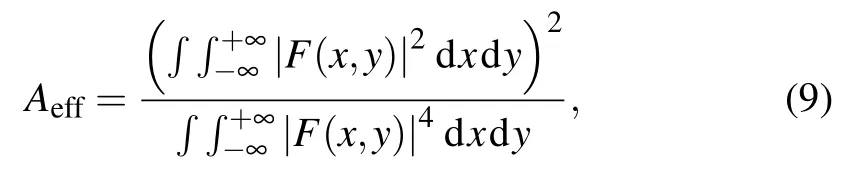
where F(x,y)is the modal distribution of the fundamental waveguidemode.
TheGVD iscalculated as D=-(λ/c)d2neff/dλ2,where neffis the effective refractive index of the waveguide.Figure 2 shows the GVD parameter andβ2as a function of the wavelength.Bothβ2and D vanish at the zero-dispersion wavelength near 3.6μm.Aeffof the designed waveguide at 3μm is 0.058μm2,and the nonlinear coeff icient isγ=180.55W-1/m.The software COMSOL is used to calculate the effective index that yields the propagation constantβ.If thenumberofdispersion termsisinsuff icientduring SCG simulations,it is possible to result in inaccurate or deceptive results.Equation(3)issolved up to the11th orderof dispersion and the dispersion data are f itted with Taylor seriesexpansion up to the 11th order of dispersion.The high-order dispersion coeff icients at3μm are calculated,and they are listed in Table 1.
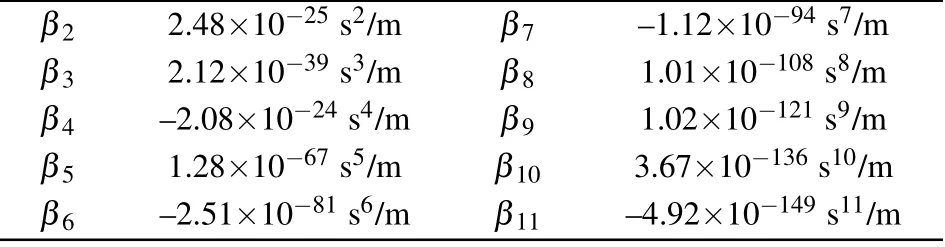
Table1.The dispersion coeff icients.
AlGaAs isaw idely used semiconductormaterial,and its production process is rathermature.AlGaAs grow th can be achieved by using molecular beam epitaxy ormetal organic chem icalvapor depositionwith GaAs crystalas the substrate.By using dry etching or wet etching,the desired waveguide shape can be obtained and subsequently packaged.
3.Simulation and discussion
The designed III–V waveguide described above is used to generate supercontinuum in them id-infrared region.The GNLSE given by Eq.(3)is numerically solved for SCG.The length of the waveguide L=1 cm.Figure 3 shows SCG with different input powers(P0)for the input pulse w idth T0=100 fs at-20 dB level and peak power of the input pulses set to 100mW,1W,10W,and 100W.SCG with different input pulse w idths(T0)is shown for the input power P0=10W at-20 dB and pulsew idth set to 100 fs,300 fs,500 fs,and 1 ps,respectively.When the initialw idth of the incidentpulseand the peak powerarenot the same,theeffect of dispersion and nonlineareffectson pulseevolution arealso different.The narrower the initial pulsew idth is,the stronger the dispersion effect is.The higher the peak powerof the initial pulse,the stronger the nonlinear effect is.Whether the input pulse is hyperbolic-secant(Figs.3(b),3(e),3(h),3(k);Figs.4(b),4(e),4(h),4(k)),Gaussian(Figs.3(c),3(f),3(i),3(l);Figs.4(c),4(f),4(i),4(l)),or parabolic(Figs.3(a),3(d),3(g),3(j);Figs.4(a),4(d),4(g),4(j)),the spectralw idth of SCG increasesas the inputpower increaseswith the same input pulse w idth.The input pulse w idth is narrower,and the spectrum of the supercontinuum is broader for the same input power.Compared with the hyperbolic-secant pulse and the Gaussian pulse,the parabolic pulse can generate a w ider spectrum for the same inputpulse power or pulsew idth.The inf luence of input power on the parabolic pulse ismore obvious than thaton the hyperbolic-secantpulse and the Gaussian pulse.
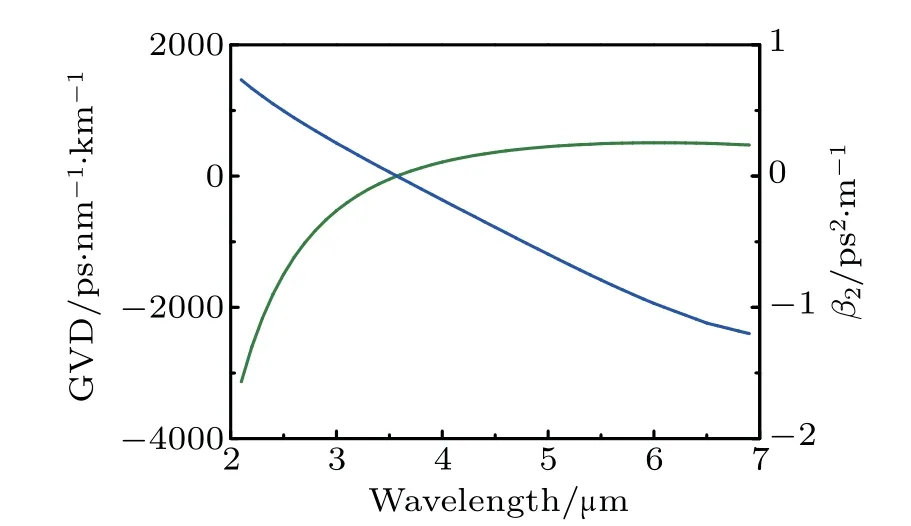
Fig.2.Variation ofβ2 and D withwavelength.Bothβ2 and D vanish at the zero-dispersionwavelength near 3.6μm.
Coherence describes the spectral randomness of SC under the inf luence of random amplitude and phase noise.If coherence is poor,the spectrum generated with different inputpulsesinto thewaveguideshows large random f luctuations ow ing to random power noise and phase noise,whichmeans the system is sensitive to the random noise in the incom ing signalwhen the coherence of SCG is low,and excessive randomnessof the spectrum leads to inconsistency in theamount of spectral spread determined at the same power,resulting in erroneous coding.A suitablemeasure of coherence for SCG is the degree of coherence associated with each spectral component.First-order coherence is def ined as follows:[42,43]where˜A(λ)is the amplitude of the SC generated in the frequency domain.To obtain more accurate results,100 pairs with independent random power noise and phase noise are used in the simulation.
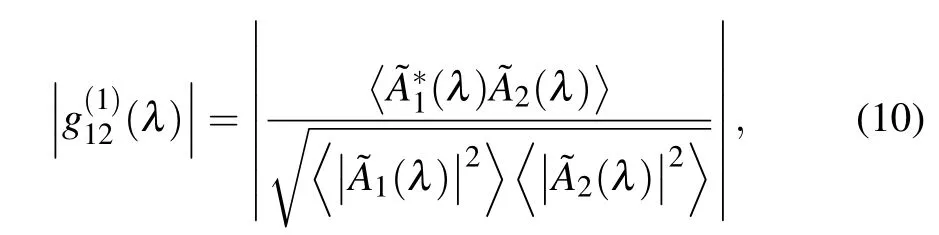

Fig.3.Spectra obtained with different pumping powers(T0=100 fs).The input pulses of panels(a),(d),(g),and(j)are parabolic pulses.The inputpulsesofpanels(b),(e),(h),and(k)arehyperbolic-secantpulses.The inputpulsesof panels(c),(f),(i),and(l)areGaussian pulses.L=1.5 cm.
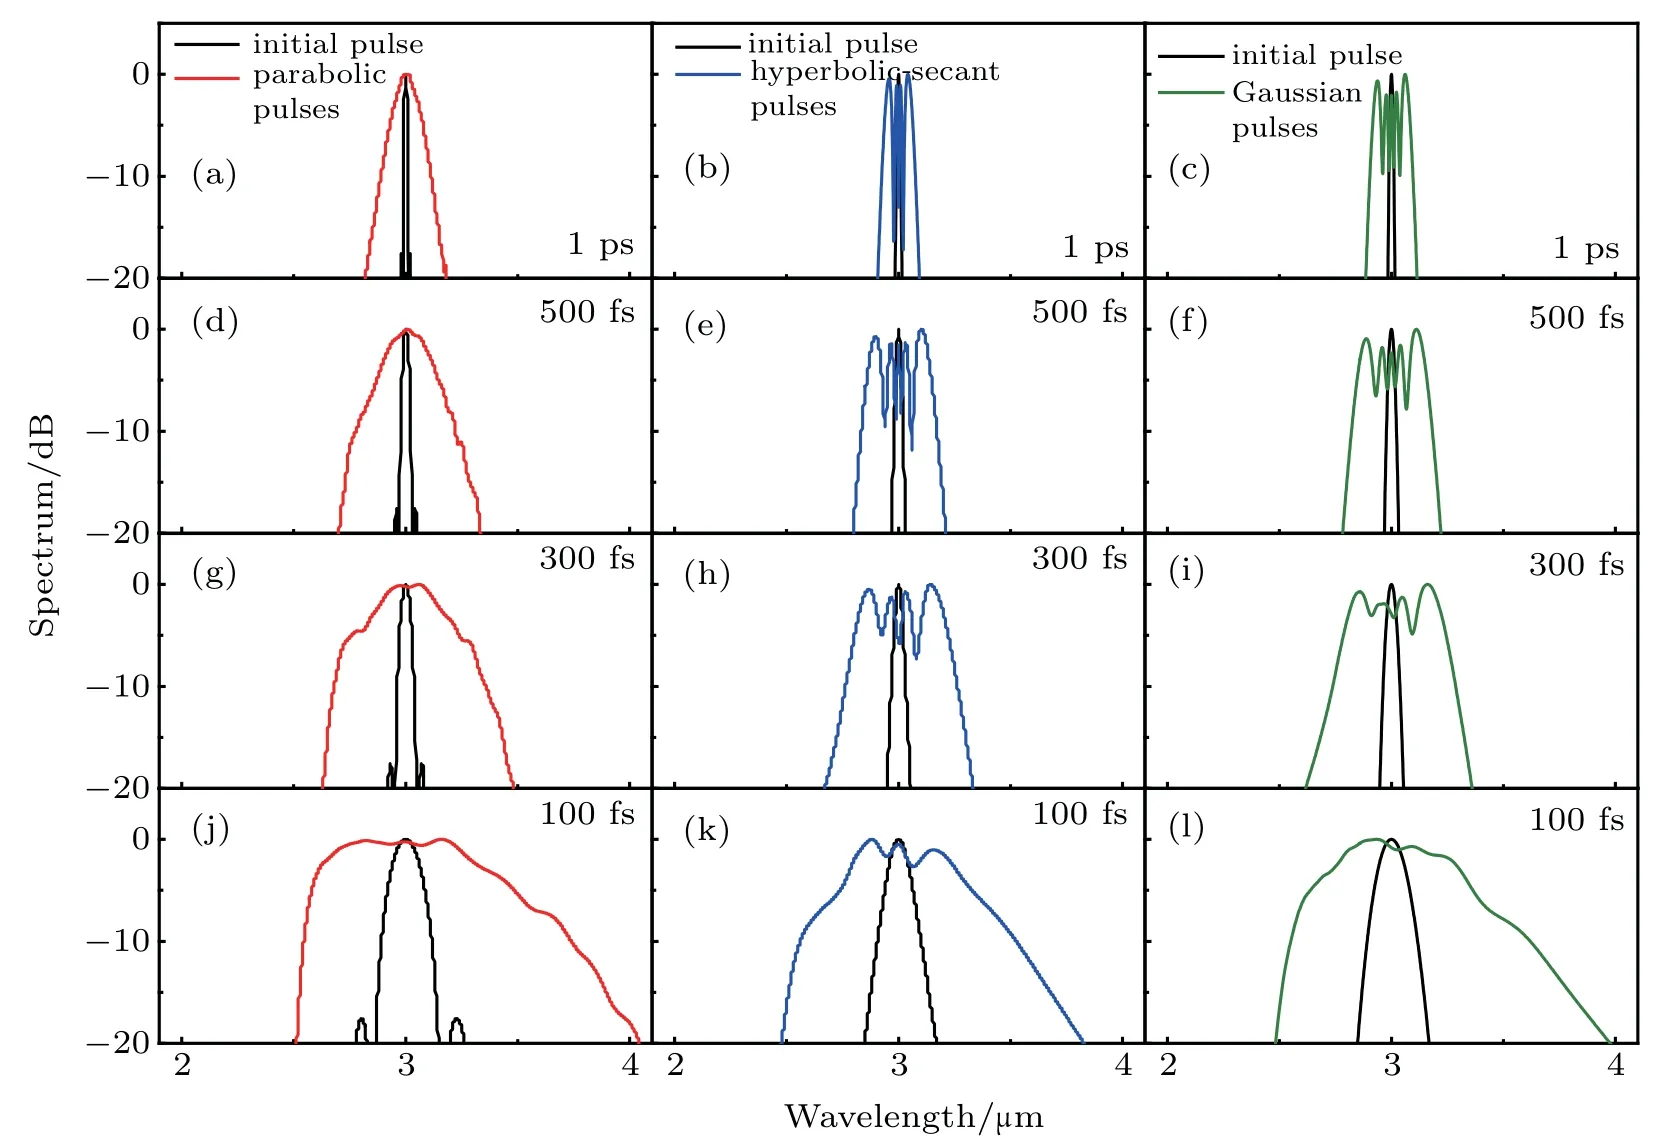
Fig.4.Spectraobtainedwith differentpumpingw idths(P0=10W).The inputpulsesofpanels(a),(d),(g),and(h)are parabolic pulses.The inputpulses of panels(b),(e),(h),and(k)are hyperbolic-secant pulses.The input pulses of panels(c),(f),(i),and(l)are Gaussian pulses.L=1.5 cm.
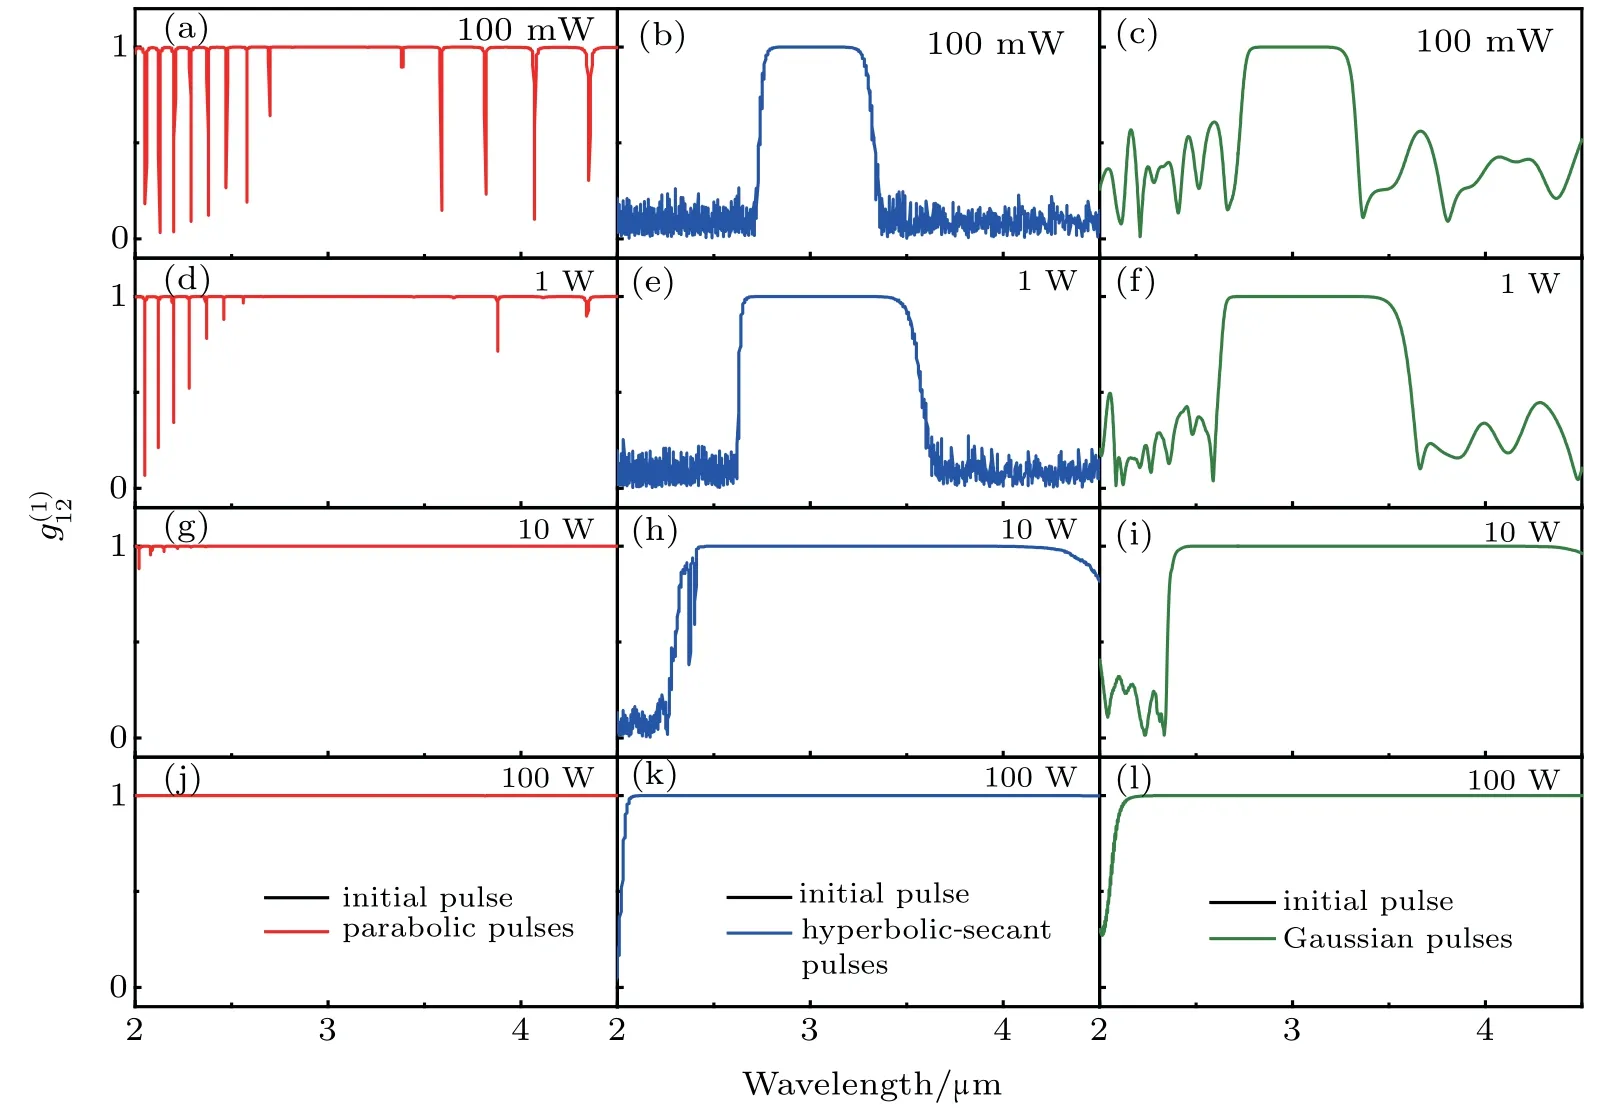
Fig.5.Degreesof coherence.The inputpulsesof panels(a),(d),(g),and(j)are parabolic pulses.The inputpulsesof panels(b),(e),(h),and(k)arehyperbolic-secantpulses.The inputpulsesof panels(c),(f),(i),and(l)areGaussian pulses,when T0=100 fs.
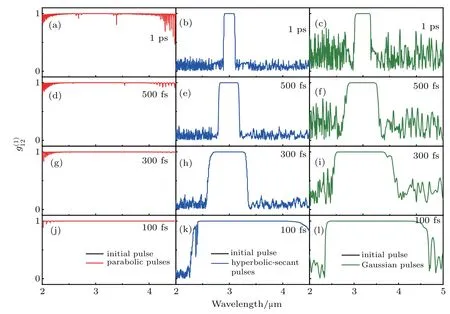
Fig.6.Degreesof coherence.The inputpulsesof panels(a),(d),(g),and(j)are parabolic pulses.The inputpulsesof panels(b),(e),(h),and(k)arehyperbolic-secantpulses.The inputpulsesof panels(c),(f),(i),and(l)areGaussian pulses,when P0=10W.
The degrees of coherence corresponding to Figs.3 and 4 are shown in Figs.5 and 6,respectively.Both degrees of coherence around 3μm are almost 1. The coherence of the parabolic pulse is better than that of the hyperbolicsecant pulse and the Gaussian pulse under the same conditions.Excellent coherence can ensure stability of the quantization scheme.On the contrary,a coding error can occurwhen the degree of coherence is not1.Thus,it is essential that the degreeof coherencebe close to 1 in quantization schemes that employ slicing SC.
The schematic diagram of the proposed quantization scheme by slicing SC isshown in Fig.7.The sampled pulses with different peak powers are incident on the designed III–V waveguide.To indicate variations of the different pulses,two pulseswith different peak powers and the same central wavelengthλ0are plotted.Spectrum broadening of theoptical pulses occurs due to the interaction between waveguide dispersion and nonlinearity.Therefore,the intensity of the sampled pulse can be converted into the SC w idth of the optical parameters.Bymeasuring thew idth of the SC,the inputsampled pulse can be quantized.To determine the w idth of the generated SC,a set of f ilters can be placed in the long-wave direction at the inputpulse centerwavelength.At the output end ofeach f ilter,theopticalsignalsare converted into electrical signals by photodetectors,and these electrical signals are judged using comparators.[46,47]A decision threshold isset.If the detectoroutputexceeds the f ixed threshold,the stateof the port is“ON”,and themarked code is“1”.Otherw ise,the state of port is“OFF”,and the code is“0”.

Fig.7.Schematic diagram of proposed spectralquantization(PD:photoelectric detector).
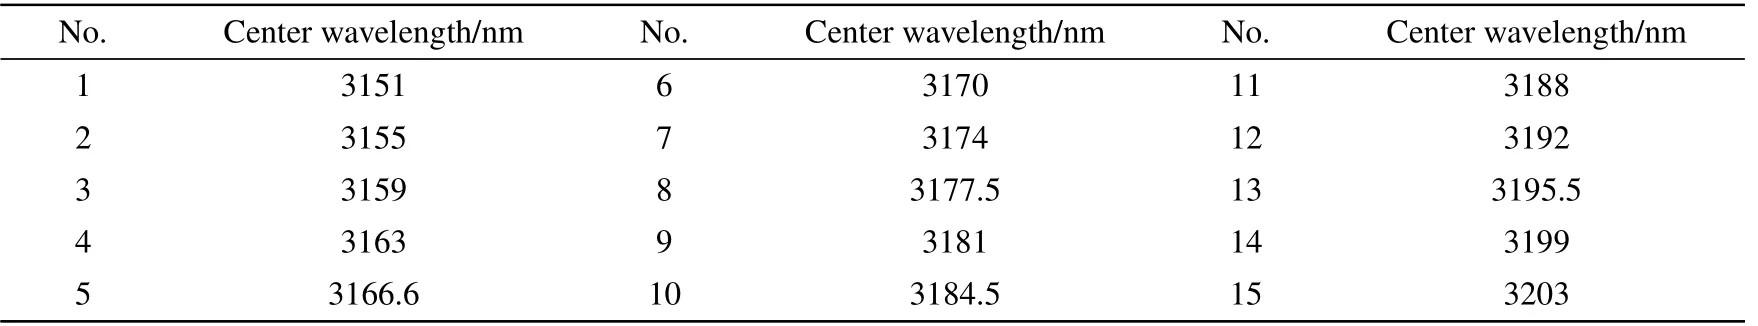
For thisscheme,thew idth of the inputpulsewith a center wavelength of 3μm is set to 100 fs.The inputpulse power is increased from 200mW to 760mW.The-15 dB band-w idth of SCG ismeasured,as shown in Fig.8.Fifteen f ilters are used to slice thegenerated SC to achieve four-bitquantization resolution.A nonlinear relationship exists between the peak power of the inputpulse and thew idth of the SC,and special design of the non-uniform f ilters can improve the system resolution.Tables 1,2,and 3 list the centerwavelengths of the f ilters.The research onmid-infrared tunable f ilters isbecoming increasinglymature,[48–51]and tunable f ilterswith AlGaAs waveguideswasstudied,which can beused for integration.[49]
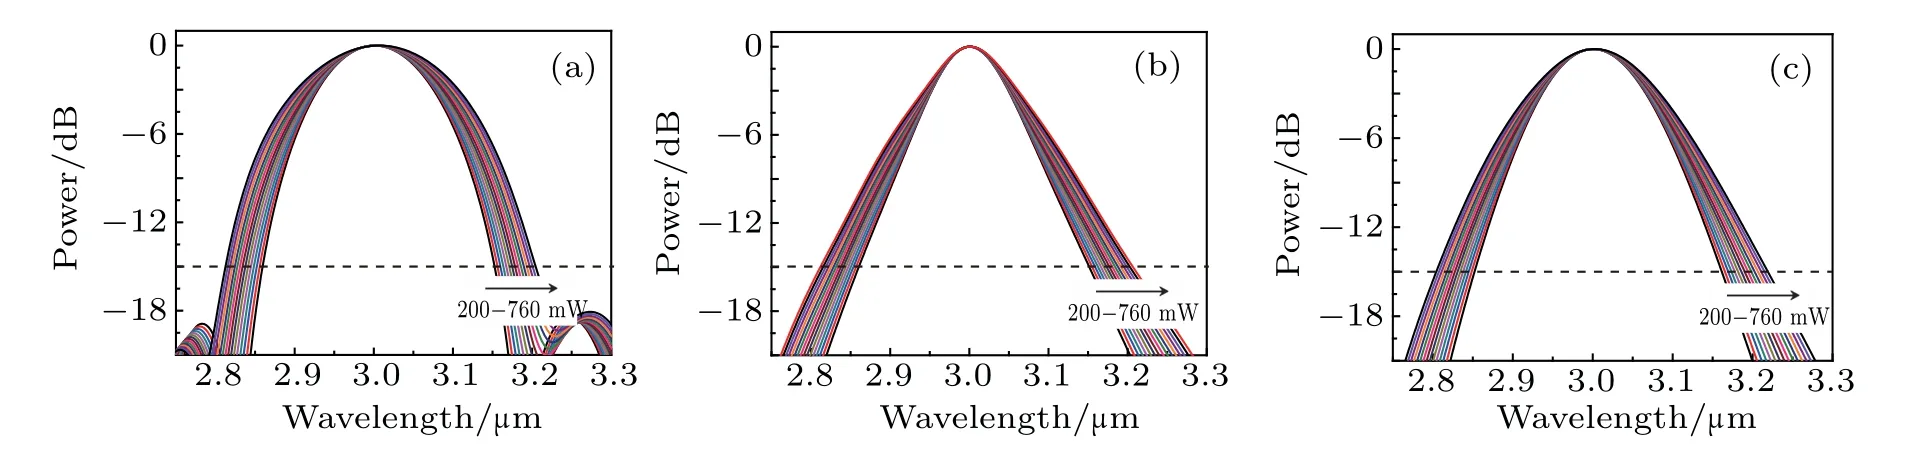
Fig.8.Spectrum w idth for different inputpeak powers:(a)parabolic pulse,(b)hyperbolic-secantpulse,and(c)Gaussian pulse.
Tab le2.The centerwavelength of the15 f ilters for the hyperbolic-secantpulse.
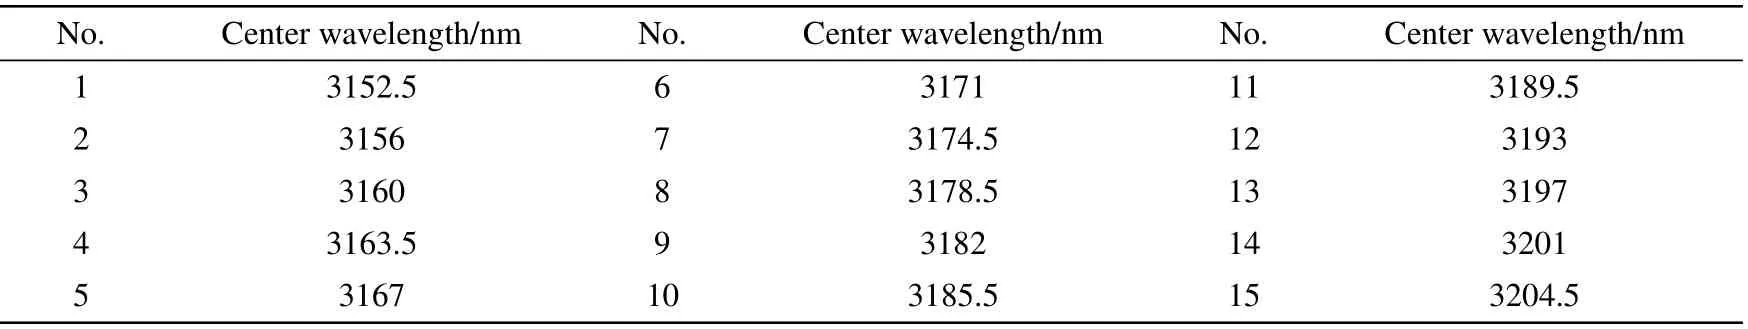
Table3.The centerwavelength of the15 f ilters for the parabolic pulse.

Tab le4.The centerwavelength of the15 f ilters for theGaussian pulse.

Fig.9.Outputpeak powersof 15 f iltering portsspaced evenly asa function of inputpeak powers((a),(b),(c)).The corresponding quantization transfer functionof the four-bitquantization scheme((d),(e),(f)).Differentialnonlinearerrorand integralnonlinearerrorwith the f iltering ports((g),(h),(i)).The inputpulsesof panels(a),(d),and(h)are parabolic pulses.The inputpulsesof panels(b),(e),and(h)arehyperbolic-secant pulses.The inputpulsesof panels(c),(f),and(i)are Gaussian pulses.
On the Stokes side of the pump wavelength,the change in f ilter power from mark“0”to“1”to the next f ilter from“0”to“1”corresponds to the leastsignif icantbit(LSB)of the designed f ilter.Nos.1 to 15 in Fig.9(a),9(b),and 9(c)represent the f irst to the f ifteenth f ilters.When the inputpulse is hyperbolic-secant,3151 nm–3203 nm range is selected as the f iltering area,and 5.9μW isused as thepower threshold.From Fig.9(b),it can be seen that the powerused forquantif ication is460mW–760mW,and the LSB is20mW.The corresponding transfer function isshown in Fig.9(e),where the solid line(blue)represents the ideal transfer function,and the dashed line(red)represents thesimulated transfer function.When the input pulse is Gaussian,we set 3151 nm–3203 nm as the f iltering rangeand 3μW as thepower threshold.From Fig.9(b),the power used for quantif ication is 410 mW–760 mW,and the LSB is 23.3mW.The corresponding transfer function is shown in Fig.9(e).When the input pulse is parabolic,we set3314 nm–3374 nm as the f iltering area and 1.9μW as the power threshold.From Fig.9(a),the power used for quantif ication is 360 mW–760 mW,and the LSB is 26.7 mW.The larger LSB is benef icial for improving ENOB.The corresponding transfer function is shown in Fig.9(d).It can be seen from Figs.9(d)),9(e),and 9(f)thatdifference exists between the simulated and the ideal values.The calculated differential nonlinear error(DNL)and the integral nonlinear error(INL)errors[50]are shown in Figs.9(g),9(h),and 9(i).Themaximum value of DNL is 0.18 LSB and that of INL is 0.17 LSB when the input pulse is hyperbolic-secant.The maximum value of DNL is0.17 LSB and thatof INL is0.15 LSB when the input pulse is Gaussian.Themaximum value of DNL is 0.09 LSB and that of INL is 0.11 LSB when the inputpulse isparabolic.The effectivenumberof bits(ENOB)and the signal-to-noise ratio(SNR)were found to be 3.97 bit and 23.54 dB for the hyperbolic-secant pulse,3.973 bit and 23.92 dB for theGaussian pulse,and 3.99 bitand 24.02 dB for the parabolic pulse.
With increased spectral bandw idth,this scheme can be used to achievehigh speed andmulti-bitquantization.Asseen from Fig.10,when NOB=2,3,4,the corresponding ENOB of parabolic pulse ishigher than thatof gaussian pulseand hyperbolic secant pulse,but the difference is not large.When NOB=5,6,the difference between the ENOB corresponding to theparabolic pulseand theENOB of theGaussian pulseand the hyperbolic secantpulse is high up to 0.5 bit.Therefore,it can be seen from the Fig.10,compared with gaussian pulse and hyperbolic secantpulse,theparabolic pulse showsnoticeable improvementof ENOB.The advantagesof the parabolic pulsearemoreobviousathigher resolutions.
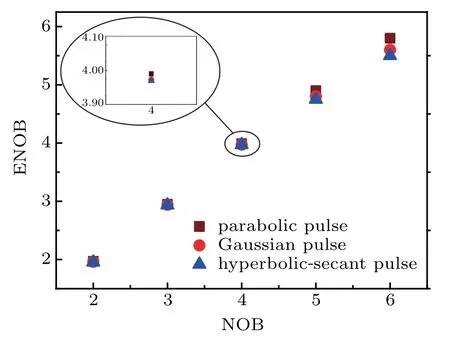
Fig.10.Relationship between NOB and ENOB for differentpulses.
4.Conclusion
In summary,the inf luences of pulse w idth,peak power,and pulse type on SCG with an AlGaAs horizontal strip waveguide is investigated in themid-infrared region,theireffects on all-optical quantization of AOADC are also dicussed with differentinputpulses.Resultsshow thatwhen the typeof inputpulse isparabolic,the SCG isbroaderand hashigher coherence.Ow ing to the high nonlinear coeff icientof the III–V waveguide in them id-infrared region in thisscheme,the input pulse peak power required to reach theappropriate SCG is reduced,resulting in low power consumption and an integrated quantization scheme.The generated high-coherence SC can be used for AOADC applications to reduce coding error and enhance ENOB.The SNR and ENOB are 23.54 dB and 3.97-bit for thehyperbolic-secantpulse,23.92 dB and 3.973-bit for theGaussian pulse,and 24.02 dB and 3.99-bit for theparabolic pulse.In an M-bit(M>4)quantization scheme,the advantagesof theparabolic pulsew illbemoreobvious.
猜你喜欢
莫愁·智慧女性(2022年1期)2022-02-08
大众健康(2019年9期)2019-10-11
科学与财富(2019年11期)2019-08-06
小说月刊(2017年7期)2017-07-10
快乐作文·低年级(2017年5期)2017-06-01
校园英语·上旬(2016年5期)2016-05-14
校园英语·下旬(2016年1期)2016-02-25
- Chinese Physics B的其它文章
- Photoinduced phase transitions in two-dimensional charge-density-wave1T-TaS2*
- Low-tem perature grow th of large-scale,single-crystallinegrapheneon Ir(111)*
- Epitaxial fabrication of two-dimensional TiTe2 monolayer on Au(111)substratew ith Teasbuffer layer*
- Isotopeeffectand Coriolis coup ling effect for the Li+H(D)Cl→LiCl+H(D)reaction*
- V ariationaland diffusion M onte Carlo simulationsof a hydrogen molecular ion in a sphericalbox*
- General way to def ine tunneling time*