
Density functional theoretical calculations and analysis on terahertz vibrational spectra of papaverine hydrochloride
2019-12-06 09:31LUMeiHongLEIHaiYingHUANGZhenFenZHANGZhuLiHAOYangWUYanBo
原子与分子物理学报 2019年6期
LU Mei-Hong , LEI Hai-Ying , HUANG Zhen-Fen , ZHANG Zhu-Li , HAO Yang , WU Yan-Bo
(1. Department of Electronic Information and Physics, Changzhi University, Changzhi 046011, China;2. Department of Biological Sciences and Technology, Changzhi University, Changzhi 046011, China; 3. Institute of Molecular Science,the Key Laboratory of Chemical Biology and Molecular Engineering of Education Ministry, Shanxi University, Taiyuan 030006, China)
Abstract: In order to further provide basis for the improvement of the computational mechanism and drug terahertz database, taking the papaverine hydrochloride as a detailed example, a scientific and general approach in the theoretical chemistry communities was used to calculate the terahertz vibrational frequencies. Harmonic vibrational frequencies were analyzed using BLYP, LC-BLYP, B97-XD, B3LYP, and CAM-B3LYP functionals, combining with the triple-zeta basis set 6-311++G (d,p). The calculational results suggested that papaverine hydrochloride exists as the protonated (on the isoquinoline N atom) cation and two lowest protonated conformers contribute to the spectrum. Three of four fingerprint peaks were resulted from the vibrations of the lowest energy conformer and the other one from the second lowest conformer. As for the method, the LC-BLYP functional is turned out to be the most appropriate one in five functionals examined. The spectral absorption features and vibrational modes of papaverine hydrochloride were also assigned. The results showed significant agreement with experimental results found in the literatures, and indicated that terahertz time-domain spectroscopy (THz-TDS) technique can be an effective way to inspect for illicit drugs. Moreover, the general approach of DFT method above-mentioned should be used to rationally calculate the vibration frequencies, which may be helpful for the inspection of illicit drugs and various derivatives in future.
Key words: Papaverine hydrochloride; Terahertz vibrational spectra; Density functional theory
1 Introduction
Due to the low excitation energy and its ability to ‘see’ through most packaging,THz time-domain spectroscopy (THz-TDS) reveals significant advantages in the field of inspection and detection of security. In principle, the collective rotational and vibrational transitions of most molecules distribute in the far-infrared (FIR) or THz region (1011~1012Hz)[1, 2]. Therefore, THz-TDS can provide much molecular information, such as the absorption coefficient, the refractive index and the vibrational modes of a sample. It had been proven to be a powerful technology in physics and chemistry for discussing molecular dynamics of materials involving illicit drugs[3-11]. In order to further confirm the accuracy of experimental results, theoretical calculations are necessary. However, the characteristic peaks of terahertz spectrum of experimental results and theoretical calculations are always different detected by different research groups. Therefore, it is essential to propose a more comprehensive and rigorous calculation method for the assignment of the characteristic peak vibrational modes and the prediction of the terahertz spectrum of materials[10-15]. Papaverine hydrochloride is primary constituents of some typical illicit drugs abused in the world. The characteristic fingerprints has been reported in the literature[10-13]. However, little in-depth and comprehensive study on the mechanism of THz spectra generated has been carried out theoretically, although the study is necessary and convenient for predicting the spectrum properties of drugs and their various derivatives.
In this work, a four-step computational pattern of density functional theory (DFT) for the low-frequency vibrational modes was presented. The connection between the low-frequency vibrational modes and molecular conformation was investigated and the computational results are compared with some experimental data found in the literature[10-13]. And the vibrational frequencies were assigned firstly. The computational simulation study would be useful for predicting the THz spectrum information of illicit drugs.
2 Computational details
In order to predict the molecular structures and understand the observed THz absorption features, a scientific and general approach in the theoretical chemistry communities was used to calculate the vibrational frequencies of THz spectra. Taking the papaverine hydrochloride as a detailed example, two possible components (protonated and unprotonated) of papaverine were considered and eight possible conformers for each of component were proposed in this work. All conformers were optimized, and harmonic vibrational frequencies were analyzed using five selected density functionals, namely BLYP, LC-BLYP[15,16], B97-XD[17], B3LYP[18,19], and CAM-B3LYP[20], combining with the triple-zeta basis set 6-311++G(d,p). BLYP and B3LYP are the most-used pure and hybrid functionals, respectively. By using such two funtionals, we can compare the accuracy of pure functional with hybrid functional. The LC-BLYP and CAM-B3LYP functionals are the improved versions (including the long-range corrections) of BLYP and B3LYP, respectively. In addition, the B97-XD is the improved version (in empirical dispersion) of the famous B97 functional, which is good at describing the weak interactions. For pure functionals BLYP and LC-BLYP, the density fitting technique on the basis sets was used to accelerate the computations. The THz spectra were obtained by cutting out the left-most section of calculated vibrational spectroscopy. All calculations were carried out by using Gaussian 09 Package[21, 22].
3 Results and discussion
3.1 The experimental results
Papaverine hydrochloride is pharmacologically an alkaloid as a muscle relaxant and vasodilatort extracted from opium. The papaverine hydrochloride has a high absorbance reported by Shen et al.[10-12]and Liu et al.[13]. In order to compare the calculated results of papaverine hydrochloride with the observed results reported in Ref.[11, 12], we have treated the experimental values and illustrated them in Table1 and Fig.1. The representative range (0.8-2.0 THz) was selected for discussion because the reported THz spectra have different frequency ranges in Fig.1. In both
Fig. 1A and
Fig. 1C, five differentiable peaks can be observed. The absorption peaks in Fig.1A were not marked in Ref.[10]; we estimate that absorption peaks located at about 1.08, 1.46, 1.63, 1.81, and 1.87 THz, respectively. In Fig.1C, the absorption peaks occur at 1.06, 1.42, 1.62, 1.75, and 1.89 THz, respectively. Moreover, considering the shoulder peak at 1.81 THz marked in
Fig. 1A was smoothened into the peak at 1.87 THz, four peaks (1.06, 1.44, 1.66, and 1.90 THz) are observed in
Fig. 1B. The above results revealed that the same characteristics of papaverine hydrochloride observed in 0.8-2.0 THz. But the peak positions are slightly different. It is necessary to assign the vibrational frequencies of fingerprint spectra and extract pictures of the molecular interior vibralional modes.

Fig. 1 Treated experimental value of absorption band for Papaverine hydrochloride. A and B were recorded by Shen group [10, 11] and C was recorded by Wang group [13]. The red lines in A are the predicted peaks based on the most stable conformer (PI1), and the blue line is complemented by that based on the second lowest conformer (PI2).
Table 1 Measured line-center frequencies for Papaverine hydrochloride in Refs

Ref[10]/THzRef[11]/THzRef[12]/THzRef[13]/THz1.081.061.091.061.461.441.451.421.631.661.641.621.751.811.821.871.871.891.902.40
3.2 The pattern for the prediction of THz spectrum
Torealize the accurate prediction of THz spectra, a general investigative pattern was proposed in this work. THz spectra can be easily simulated by using most favorable conformer(s) under the correct stoichiometry and the thermodynamics. The rational theoretical analysis of prediction for THz spectra should be finished in four steps. First, it is necessary to verify the correct component (most prevailing form); Second, all possible isomers or conformers should be considered using several selected density functionals and compatible basis set; Third, the vibrational frequencies of THz spectra should be simulated on the basis of favorable isomers or conformers; Fourth, origination of each fingerprint peak in the THz spectrum can be assigned based on the vibrational modes. The reason we recall such a general computational pattern is to obtain a credible prediction of THz spectra for illicit drugs detection and provide a help for drug smuggling work. In the following part, the general approach used to reproduce the experimental THz spectrum of papaverine hydrochloride will be elaborated.
3.3 The case of papaverine hydrochloride
It is well-known that hydrochloric acid is a strong acid and generally servers as the protondonor. Simultaneously, the N atom on isoquinoline of papaverine is a strong proton acceptor; therefore, the most possible existing form of papaverine in the hydrochloride should be the protonated papaverine cations. In this work, both protonated (P) and unprotonated (U) forms of papaverine were considered. In additional to the difference between P and U, the major conformational variable in papaverine should be the positioning of isoquinoline group and benzene group. The two groups are linked by a methylene, which may result in two possible conformations, i.e. the one with benzene group standing on isoquinoline group (B) and the other with isoquinoline group standing on benzene group (I). Furthermore, due to the rotational flexibility of methoxy groups around C-O single bonds, there are four possible existing forms (we number them as 1, 2, 3, and 4). On the basis of above analysis, the conformer of papaverine studied in this work can be named as “CMn” (for example PB1), where “C” donates the property of components (P in PB1), “M” donates the major conformational variable (B in PB1), and “n” donates the numbering of conformers that are differentiated by the positioning of methoxy groups (1 in PB1). The LC-BLYP/6-311++G(d,p) optimized structures for 16 possible conformers of papaverine are shown in Fig.2 and the predicted peaks within 0.8-2.0 THz for each conformer at five different DFT levels are tabulated in Table 2. We also prepared the movies for the vibrational modes of all the predicted peaks (see Supporting Information).
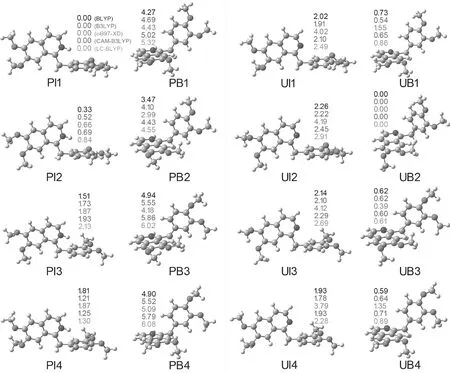
Fig.2 The optimized structures for 16 possible conformers of papaverine at LC-BLYP/6-311++G (d,p) level. The values on each conformer are the relative energies (the colors of the values are explained in the parenthesis on (PI1)). The energies of the lowest-lying conformers of protonated (PI1) and unprotonated (UB2) papaverine are taken as the reference points.
Table 2 The predicted peaks of papaverine for its possible conformers using five different DFT methods. The italic values are unexpected peaks that do not exist in the experimental spectroscopy

MethodsPeaksMethodsPeaksPI1BLYP0.981.081.411.90B3LYP1.031.341.531.87w-B97XD1.031.521.601.73CAM-B3LYP1.051.131.611.73LC-BLYP1.091.621.741.78UI1BLYP0.951.52B3LYP0.981.60w-B97XD0.991.63CAM-B3LYP1.001.65LC-BLYP1.031.65PI2BLYP0.971.091.141.89B3LYP1.041.251.381.98w-B97XD1.021.451.59CAM-B3LYP1.061.381.52LC-BLYP1.081.471.57UI2BLYP0.951.51B3LYP0.991.59w-B97XD1.021.63CAM-B3LYP1.001.64LC-BLYP1.031.69PI3BLYP1.011.291.87B3LYP1.071.191.541.96w-B97XD1.091.38CAM-B3LYP1.101.341.81LC-BLYP1.121.431.97UI3BLYP1.011.51B3LYP1.051.59w-B97XD1.071.651.791.89CAM-B3LYP1.071.641.81LC-BLYP1.121.71PI4BLYP0.941.151.391.91B3LYP1.071.471.541.90w-B97XD1.071.311.641.92CAM-B3LYP1.101.561.81.84LC-BLYP1.121.691.712.00UI4BLYP0.861.87B3LYP0.911.97w-B97XD0.971.89CAM-B3LYP0.94LC-BLYP0.98PB1BLYP0.811.051.541.89B3LYP0.851.471.641.87w-B97XD0.871.661.771.84CAM-B3LYP0.871.471.571.84LC-BLYP0.911.561.89UB1BLYP0.841.66B3LYP0.871.76w-B97XD0.841.791.89CAM-B3LYP0.901.81LC-BLYP0.941.88PB2BLYP0.761.151.301.541.96B3LYP0.861.301.63w-B97XD0.891.431.771.97CAM-B3LYP0.871.411.86LC-BLYP0.891.461.91UB2BLYP0.821.69B3LYP0.871.78w-B97XD0.921.82CAM-B3LYP0.911.83LC-BLYP0.951.88PB3BLYP0.740.951.23B3LYP0.831.381.79w-B97XD0.911.531.97CAM-B3LYP0.891.51.95LC-BLYP0.931.572.08UB3BLYP0.861.87B3LYP0.911.97w-B97XD0.971.89CAM-B3LYP0.94LC-BLYP0.98PB4BLYP0.941.751.97B3LYP0.871.621.712.00w-B97XD0.871.351.681.91CAM-B3LYP0.911.841.96LC-BLYP0.941.751.97UB4BLYP0.861.79B3LYP0.891.88w-B97XD0.971.88CAM-B3LYP0.921.93LC-BLYP0.961.99
As shown in Fig.2, the conformersPI1 and UB2 are, thermodynamically, the most stable conformer for protonated and unprotonated papaverine, respectively. According to Boltzmann distribution law, they play the most important role in generating the THz spectroscopy for protonated and unprotonated papaverine, respectively. Then the reasonability of protonation can be proved by comparing the predicted peaks with those recorded in the experiments. Since three experimental viable spectra were very similar, here we employ the results from Liang group (fingerprint characteristics of 1.08, 1.45, 1.64, 1.80, and 1.88 THz, respectively, see Fig.1A for comparison[11]. According to Table 1, depending on the DFT methods employed, three or four of the five experimentally recorded fingerprint peaks can be found in the predicted results of PI1, which shows that the experimental results are in good agreement with the theory, and suggests that PI1, the most stable protonated conformer, may be the most prevailing form of papaverine chloride. In contrast, there are only two peaks in the predicted spectroscopy of UB2. Depending on the functionals used, a peak around 1.80 THz can correspond to the fingerprint peak of 1.80 (or 1.88) but the other four peaks cannot be reproduced. Moreover, despite of functionals employed, there always has an unexpected peak (located at 0.90-1.00 THz) which cannot be observed the experimental spectrum. According the principle that the structure determines the properties and spectroscopic characters, we draw the conclusion that UB2, the most stable unprotonated conformer, is not a prevailing form of papaverine chloride. These results are consistent with our deduction that the most prevailing form of papaverine chloride should be the protonated. It is worth noting here that the simulation of Shenetal.[11]considered only one of eight possible structures of the unprotonated papaverine, thus they surely could not predict the correct spectrum.
Then, we tried to reproduce the experimental fingerprint peaks on the basis ofPI1. In five functional employed, we noted that BLYP and CAM-B3LYP both predicted the unexpected peaks (0.98 THz for BLYP and 1.13 THz for CAM-B3LYP), from which they can be thought as the improper functionals for predicting the THz spectroscopy of papaverine. For the remained three functionals, four experimentally recorded peaks can be found in the predicted spectroscopy without unrecorded peaks. Nevertheless, there is still a missing peak (the peak 1.81 THz for B3LYP, 1.87 THz for wB97-XD, and 1.46 THz for LC-BLYP). Actually, it is not surprise because there is a protonated conformer (PI2) that locates less than 1 kcal/mol higher in energy than PI1. According to Boltzmann distribution law, the contribution of PI2 to the spectroscopy can not be ignored and thus PI2 should be taken into account for the reproduction of experimental spectrum of papaverine chloride. In the predicted spectrum of PI2, the results from B3LYP and wB97-XD functionals do not complement the absent peak in the prediction of PI1 (being 1.81 and 1.87 THz, respectively). As a comparison, in three LC-BLYP predicted peaks for PI2, a peak with fingerprint character of 1.47 THz can be found, which complements the absent peak (1.46 THz) in LC-BLYP predicted results for PI1. Moreover, the other two predicted peaks, 1.08 and 1.57 THz, based on PI2 are very close to the predicted peaks of 1.09 and 1.63 THz, respectively, based on PI1, so they will not generate the unexpected peaks in integrated spectrum.
In addition, depending on the theoretical level employed, the conformerPI4 locates 1.3-1.8 kcal/mol above PI1, though its contribution cannot be completely ignored, such energy differences suggest a very small Boltzmann coefficient (less than 10%) and the contribution of PI4 to the spectroscopy can only modify the shape of the peaks generated by other conformers rather than complement the absent peaks. Nevertheless, we also examined the peaks generated by PI4. As tabulated in Table 1, for the results of B3LYP functional, the absent peak of 1.81 THz still can not be complemented, while for B97-XD functional, the absent peak of 1.88 THz can be complemented by the predicted peak of 1.92 THz based on PI4. However, due to the very small quantity of this conformer, the peak should be relatively mild, which is not consistent with the recorded very intense peak. As a comparison, for LC-BLYP functional, the predicted peaks of 1.12, 1.69, and 1.71 THz based on PI4 are closed to those of 1.09, 1.62, and 1.74 THz based on PI1, which will not generate the unrecorded peaks in the 0.8-2.0 THz. It should be mentioned that LC-BLYP predicted a peak just located at 2.00 THz for PI4 and we think such a peak corresponds the unsharp peak located at about 1.96 THz (see
Fig. 1A).
The above analysis suggests that papaverine exists as the protonated form and two or three lowest-lying conformers contribute simultaneously to the experimental spectrum. The LC-BLYP functional is the most proper one in five employed functionals selected for the prediction of THz spectrum of papaverine chloride. We mark the LC-BLYP/6-311++G (d,p) predicted peaks (lines) on the basis of PI1 and PI2 in the Fig.1A. Except for the last two lines at 1.74 and 1.78 THz, which is slightly blue-shift in comparison with the experimental values of 1.81 and 1.87 THz, the other lines correspond almost perfectly to the experimentally recorded peaks. Our results suggest that if the generally used computational pattern is employed to simulate the THz spectrum, it is possible to accurately reproduce the concerned fingerprint peaks recorded in the experimental spectrum.
3.4 The origination of fingerprint peaks
In this part, we focus on the vibrational modes of fingerprint peaks. For LC-BLYP/6-311++G (d,p) calculated conformer PI1, the predicted peak of 1.09 THz duplicates the experimental fingerprint peak of 1.08 THz. As shown in Fig.3-I, it corresponds to the out-of-plane bent of the benzene group. The peak can also be found in the conformer with the similar positioning of isoquinoline and benzene groups (including PI1-PI4 and UI1-UI4), but it is shifted to about 0.90 THz for other conformers (including PB1-PB4 and UB1-UB4). So the conformation with isoquinoline group standing on benzene group is correct. The predicted peaks 1.62, 1.74, and 1.78 THz are comparable to the experimental fingerprint peaks of 1.63, 1.81, and 1.87 THz, respectively. As shown in Fig.3-II, 3-III, and 3-IV, they correspond to the various combinations of rotation of methoxy groups around the single bonds between aromatic rings and O atoms of methoxy groups. The absent fingerprint peak of 1.46 THz can be complemented in the calculated peaks for conformer PI2 and as shown in Fig.3-V, it also corresponds to the rotation of methoxy groups around the C-O single bonds. It should be noted that, for unprotonated conformers of papaverine, generally, there is only one peak with such vibrational modes that locates at 1.00 to 2.00 THz domain, while other peaks were red-shifted to more than 2.00 THz in the predicted spectroscopy, which once again proves that the protonation on isoquinoline N atom really occurs in papaverine chloride.
Based on the vibrational analysis, a conclusion can be reached that the fingerprint peaks recorded experimentally were composed of two parts. The first part corresponds the peak at 1.08 THz, which originated from the interactions between the benzene group and isoquinoline group around the methylene bridge; the other four peaks originated from the rotational freedom of methoxy group around the C-O single bonds. As long as the methylene bridged arrangement and the four methoxy groups exist and do not be disturbed, the derivatives of papaverine will show the similar fingerprint characters, we think this can help the non-destructive inspection of papaverine and its various derivatives using THz spectroscopy in the future.

Fig.3 The vibrational modes for the origination of fingerprint peaks of THz spectrum of papaverine chloride. The videos of the vibrations were given in the Supporting Information.
4 Conclusions
The general approach in the computational chemistry was used to simulate the THz spectroscopy of papaverine hydrochloride, which can reasonably reproduce the experimentally recorded spectrum. In the calculation, the possible components (chemical formula) were considered in detail and all possible conformers of each component employing several elaborately selected density functional methods, and used a relatively complete basis set. The results demonstrated mechanism for the generation of fingerprint peaks in the THz spectrum of papaverine hydrochloride, which can help the detection of papaverine hydrochloride and its various derivatives. Moreover, the results suggested that the simulation of THz spectrum should adopt the proper computational approach rather than run several very simple optimizations and followed frequencies calculations. The most important part of such approach is to find the thermodynamically most favorable isomer(s)/conformer(s) under correct component(s), which is especially important for the species with multiple possibilities of co-existing isomer(s)/conformer(s). We think the simulation of any other spectrum of any species should also follow this approach. We hope our results and our emphasis on the proper computational approach can help our experimental colleagues to rationally predict the THz spectra.
