
Study on influencing factors of ion current density measurement in corona discharge of HVDC transmission lines
2020-05-06 05:58ShiqiangLIU刘士强ShouzhengLI李守正YuzeJIANG姜雨泽NanJIANG姜楠JieLI李杰andYanWU吴彦
Plasma Science and Technology 2020年4期
关键词:李杰
Shiqiang LIU (刘士强),Shouzheng LI (李守正),Yuze JIANG (姜雨泽),Nan JIANG (姜楠),Jie LI (李杰) and Yan WU (吴彦)
1 School of Electrical Engineering,Dalian University of Technology,Dalian 116024,People’s Republic of China
2 State Grid Shandong Electric Power Research Institute,Jinan 250003,People’s Republic of China
Abstract
Keywords: HVDC,corona discharge,reduced scale device,Wilson plate,ion current density
1.Introduction
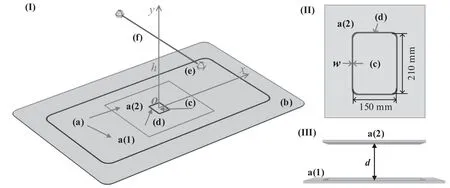
Figure 1.1-(I) Schematic diagram of reduced scale line-plate experimental device,1-(II) schematic diagram of Wilson plate placement position,1-(III)schematic diagram of the height of the Wilson plate from the grounding plate.(a)Internal testing plate,(b)external shielding plate,(c) Wilson plate,(d) protective annulus,(e) shield ball,(f) HV conductor.
The advantages of high voltage direct current(HVDC)in long distance and large capacity transmission have resulted in it being widely used throughout the world in recent years.However,since HVDC transmission lines are generally allowed to operate with a slight corona discharge above the onset voltage,considerable positive and negative ions are generated around the lines[1,2].Discharge phenomenon has been widely used in sterilization,pollutant degradation,and medical treatment[3–8],but it needs to be avoided in the field of HVDC as much as possible.The directional movement of positive and negative ions under the action of a space electric field will form the unique ion flow field of HVDC[9,10].The ground level ion current density is a significant parameter for HVDC design and operation.To estimate the ground level ion current density,a collecting plate usually called the Wilson plate,is used to intercept the ions which migrate from the transmission lines to the ground level [11].The Wilson plate is usually located flush with the grounding plate or on the grounding plate.In reality,the ion current density beneath HVDC transmission lines is generally measured and evaluated by using a 1 × 1 m2Wilson plate.In order to study the ground level ion flow field of HVDC transmission lines conveniently,a reduced scale line-plate device has been widely used in the laboratory[12].Scholars have done a lot of theoretical and experimental research on the ion flow field of HVDC transmission lines and have reached many meaningful conclusions [13–16].Fang et al analyzed the edge effect of the Wilson plate in the reduced scale model by combining experimental with numerical simulation [17].The results show that when the ratio of the width of the protective band to the height of the Wilson plate was greater than 5,the measured ion current density was accurate.Bian et al studied the influence of fine particulate matter on the variation of surface morphologies of conductors subjected to positive DC voltages.It was found that the interactions between particles played a critical role in the formation of agglomerations and parallel chains [18].Maruvada compared the results of the ground level ion current density of HVDC transmission lines between calculations and measurements [19],and he found that the most important factor influencing the electric field and ion current distributions is the corona onset gradient of the conductors.Zou et al used an aspirator-type charge meter to study the measurement method of charge densities at ground level under HVDC conductors [20].Wang et al studied the measurement of surface charges on the dielectric film under the HVDC corona wire [21].At present,scholars mainly study the ion flow field of HVDC transmission lines with the Wilson plate directly placed on the grounding plate.However,the study of a Wilson plate which is flush with the grounding plate is seldom published.Therefore,in order to obtain more accurate ground level ion current density directly,it is necessary to study the influence of external factors on the measurement of ion current density when the Wilson plate is flush with the grounding plate.
In section 2,a new reduced scale wire-plate experimental device in which the Wilson plate is flush with the grounding plate is designed.The influence of the protective annulus width on the ion current density is studied in section 3.1,and reasonable protective annulus parameters are proposed.Furthermore,the height of the Wilson plate from the grounding plate on the ion current density is studied in section 3.2.In addition,the differences between the micro-current galvanometer method and the sampling resistance method used to measure ion current density are compared in section 3.3.Finally,the ground level ion current density distributions of unipolar and bipolar HVDC transmission lines are measured in section 3.4,respectively.The conclusions of this paper given in section 4 can provide a reference for future research.
2.Experimental setup
Figure 1(I) shows a schematic diagram of a reduced scale line-plate experimental device for corona discharge in HVDC transmission lines.The grounding plate is mainly composed of two parts.The inner area(a)is a 2480 × 1300 mm2testing plate and the outer area (b) is a 300 mm wide shielding plate in order to eliminate the influence of the edge effect of the testing plate on the measurement results.The distance between the inner plate and outer plate is 2 mm.A smooth aluminum conductor with a diameter of 3 mm and a length of 1600 mm is placed directly above the center of the grounding plate.To eliminate the tip discharge on both sides of the conductor,stainless steel shielding balls with a diameter of 100 mm are installed at the end of the conductor.h represents the height of aluminum conductor from the grounding plate.An aluminum conductor fastened by a nylon rod is connected with a direct DC power supply through the high voltage power supply wire.The Wilson plate is located directly below the conductor.In order to conveniently study the influence of protective annulus width on the ground level ion current density,a 1000 × 1000 mm2removable grounding plate a(2)is placed on the center of the testing plate.The output voltage of the power supply can be adjusted between 0 and 100 kV.Based on the LabVIEW platform,the programmable function of the power supply is used to control the voltage to rise at a rate of 10 kV min-1.
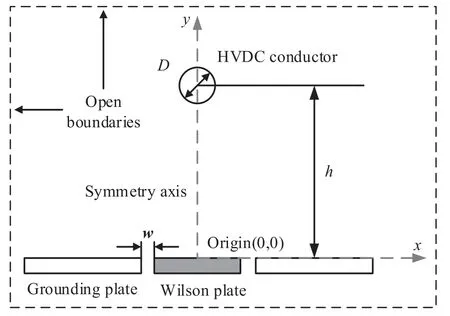
Figure 2.Schematic diagram of the line-plate HVDC corona discharge.
The ground level ion current density is measured by using a Wilson plate,which is flush with the grounding plate a(2),as shown in figure 1-(II).In order to measure the ion current density,the Wilson plate and grounding plate are separated by an air protective annulus.w denotes the width of the protective annulus.The size of the Wilson plate is 150 × 200 mm2and it has four chamfers with a radius of 10 mm.Figure 1-(III) shows a schematic diagram of the height of the Wilson plate from the grounding plate.a(1)and a(2) represent the internal grounding plate and the Wilson plate,respectively.d denotes the height of the Wilson plate from the grounding plate.
The experiments are carried out in an environment with the temperature varying from 18.5°C–21.6°C,the relative humidity varying from 31%–42%,and the atmospheric pressure varying from 1002–1006 hPa.Besides,in order to eliminate the influence of pollutants on the surface of the conductors,absolute ethanol is used to clean the conductors before the experiments.
3.Results and discussion
3.1.Influence of the protective annulus width
The existence of an air protective annulus will distort the electric field around the Wilson plate.The simulation of a two-dimensional electrostatic field of the reduced scale lineplate experimental device is carried out by using COMSOL Multiphysics software.Figure 2 shows a description of the schematic diagram of line-plate HVDC corona discharge in air at the atmospheric environment.Within the numerical model,a positive potential is applied to the HVDC conductor,the grounding plate and the Wilson plate are grounded as zero potential,and a zero charge boundary condition is used at the open boundaries.In the process of simulation,the height of the aluminum conductor h is 500 mm and the diameter of the conductor D is 3 mm.
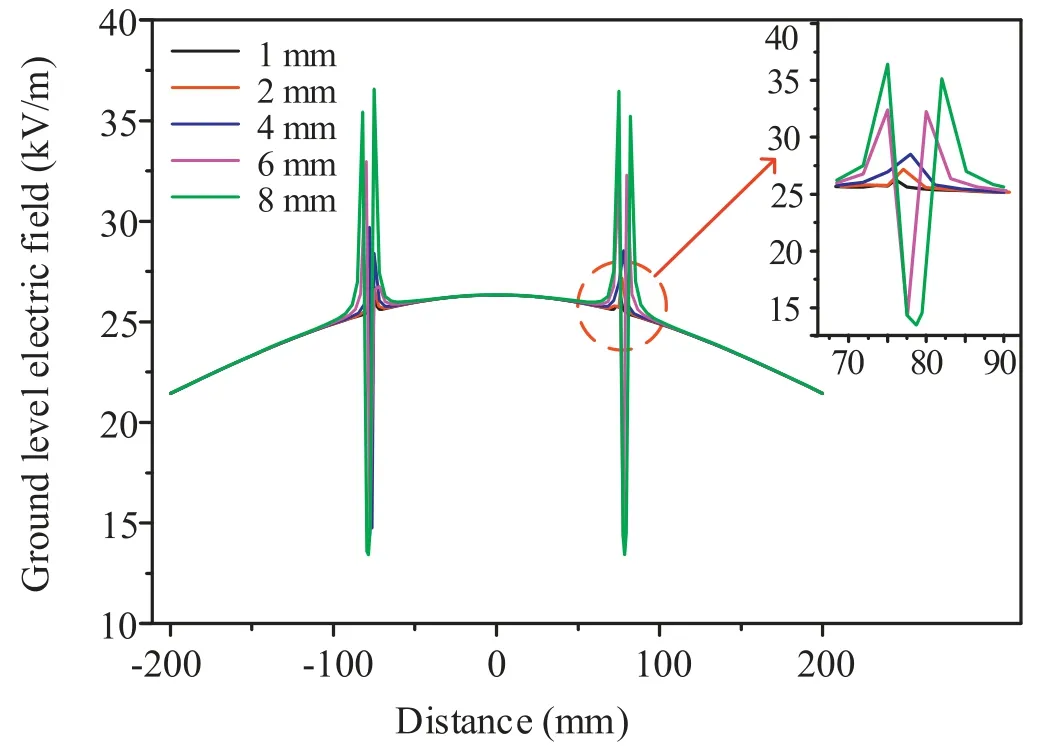
Figure 3.Distribution of the ground level electric field under different protective annulus widths.
Figure 3 shows the distribution of a ground level electrostatic field at 30 kV with different w.The origin of coordinate axes is in the center of the Wilson plate.The numerical value of the lateral axis represents the distance from the origin.It can be seen that the increase of w will lead to serious distortion of the electric field at the edge of the Wilson plate.The upper right corner of figure 3 shows an enlarged view of the electric field in the right protective annulus region.It can be found that when the w is less than 2 mm,the electric field at the edge of the Wilson plate hardly distorts.When the width of the protective annulus is 1 mm,the edge electric field of the Wilson plate is basically maintained at about 25 kV m-1.However,when the width of the protective annulus increases to 8 mm,the edge electric field of the Wilson plate is seriously distorted,and the electric field varies from 13.4–36.5 kV m-1.The intense distortion of the edge electric field of the Wilson plate will seriously affect the measurement of the ion current density on the ground level.Therefore,it is important to study the effect of w on the ground level ion current density.
In the experiment,the micro-Wilson plates with 1,2,4,6,and 8 mm protective annulus widths are selected to study the effect of w on the ground level ion current density.Figure 4 shows the variation of the ground level ion current density with w under different positive and negative voltages.It can be found that,with the increase of applied voltage,the influence of w on the measurement results is more and more obvious.With the increase of w,the ground level ion current density increases gradually,and the change of ion current density under positive voltage is more stable than that under negative voltage.However,when w is less than 2 mm,the ground level current density basically does not change with w,which indicates that the edge effect of the Wilson plate has little effect on the measurement results.This is consistent with simulation results of the electric field.
3.2.Influence of the height of the Wilson plate from grounding plate
In order to verify the influence of the height of the Wilson plate from the grounding plate,d is adjusted from 0–5 cm.Figure 5 shows the influence of d on ion current density under different positive and negative voltages.
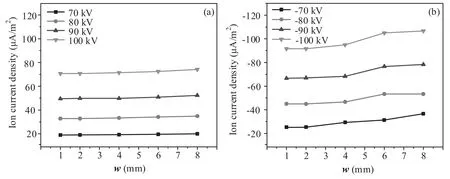
Figure 4.Influence of the protective annulus width on the ground level ion current density under different voltages.
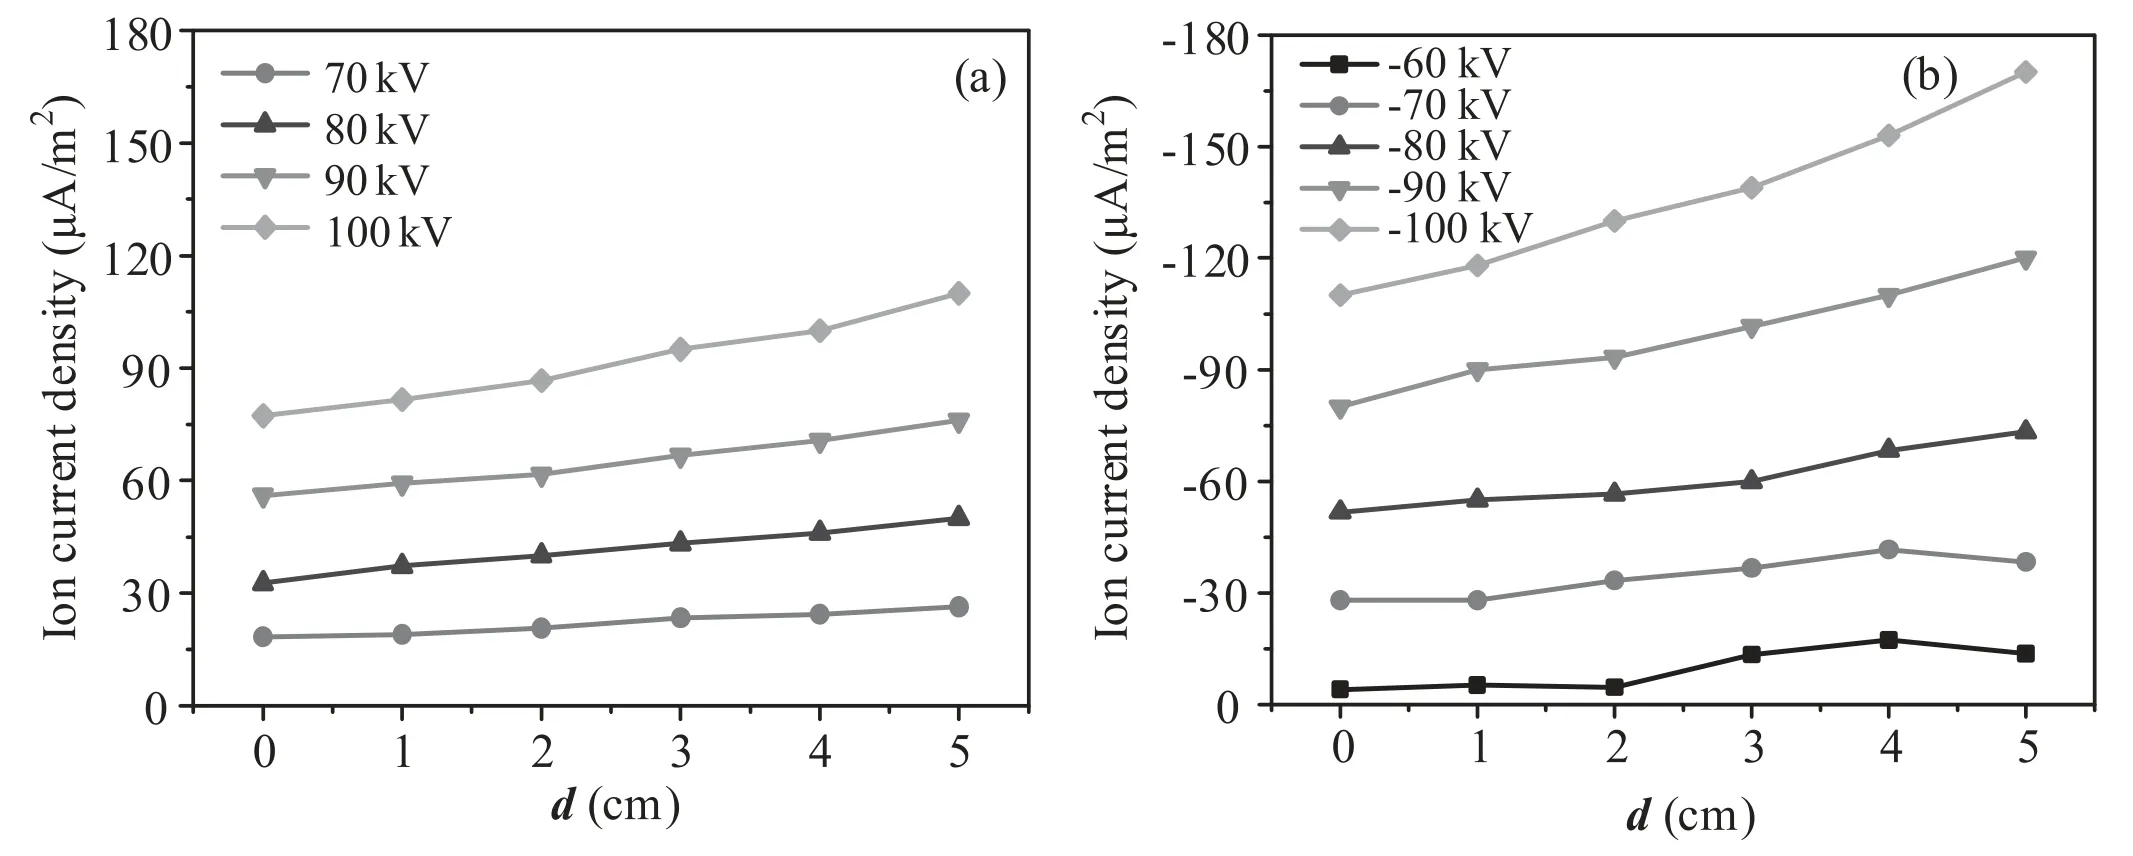
Figure 5.Influence of the height of the Wilson plate on the ground level ion current density under different voltages.
It can be seen that the ground level ion current density increases approximately linearly with the increase of d under positive voltage.However,under negative voltage,when the applied voltage is low,there is no obvious linear relationship between the ground level ion current density and d,which may be due to the instability of weak corona discharge under negative voltage.Since HVDC transmission lines generally operate with a slight corona discharge.Therefore,in order to obtain more accurate measurement results,the ground level ion current density should be measured directly by the way that the Wilson plate is flush with the grounding plate as much as possible.
3.3.Influence of the measurement methods
The ion current density on the Wilson plate is measured by a micro-current galvanometer (direct method) and sampling resistance method (indirect method),respectively.The direct method uses the FMAC15/1 micro-current galvanometer to measure the ion current,directly.The indirect method uses the Tektrotix DMM4020 high sensitivity digital voltmeter to measure the voltage of the sampling resistance firstly,and then converts it into ion current.The sampling resistors are high accuracy inductance-free resistors with a 0.1%error.The values of the sampling resistors are 0.1,1,2,and 5 M,respectively.Figure 6 shows the variation of ground level ion current density under different positive and negative voltages.
It can be seen that when the sampling resistance is 0.1 M,the results measured by two methods are basically identical under positive voltage,but there are some deviations under negative voltage,which may be due to the instability of negative corona discharge.However,with the increase of the value of sampling resistance,the ground level ion current density measured by the sampling resistance method decreases gradually,due to the influence of internal resistance of digital voltmeter.
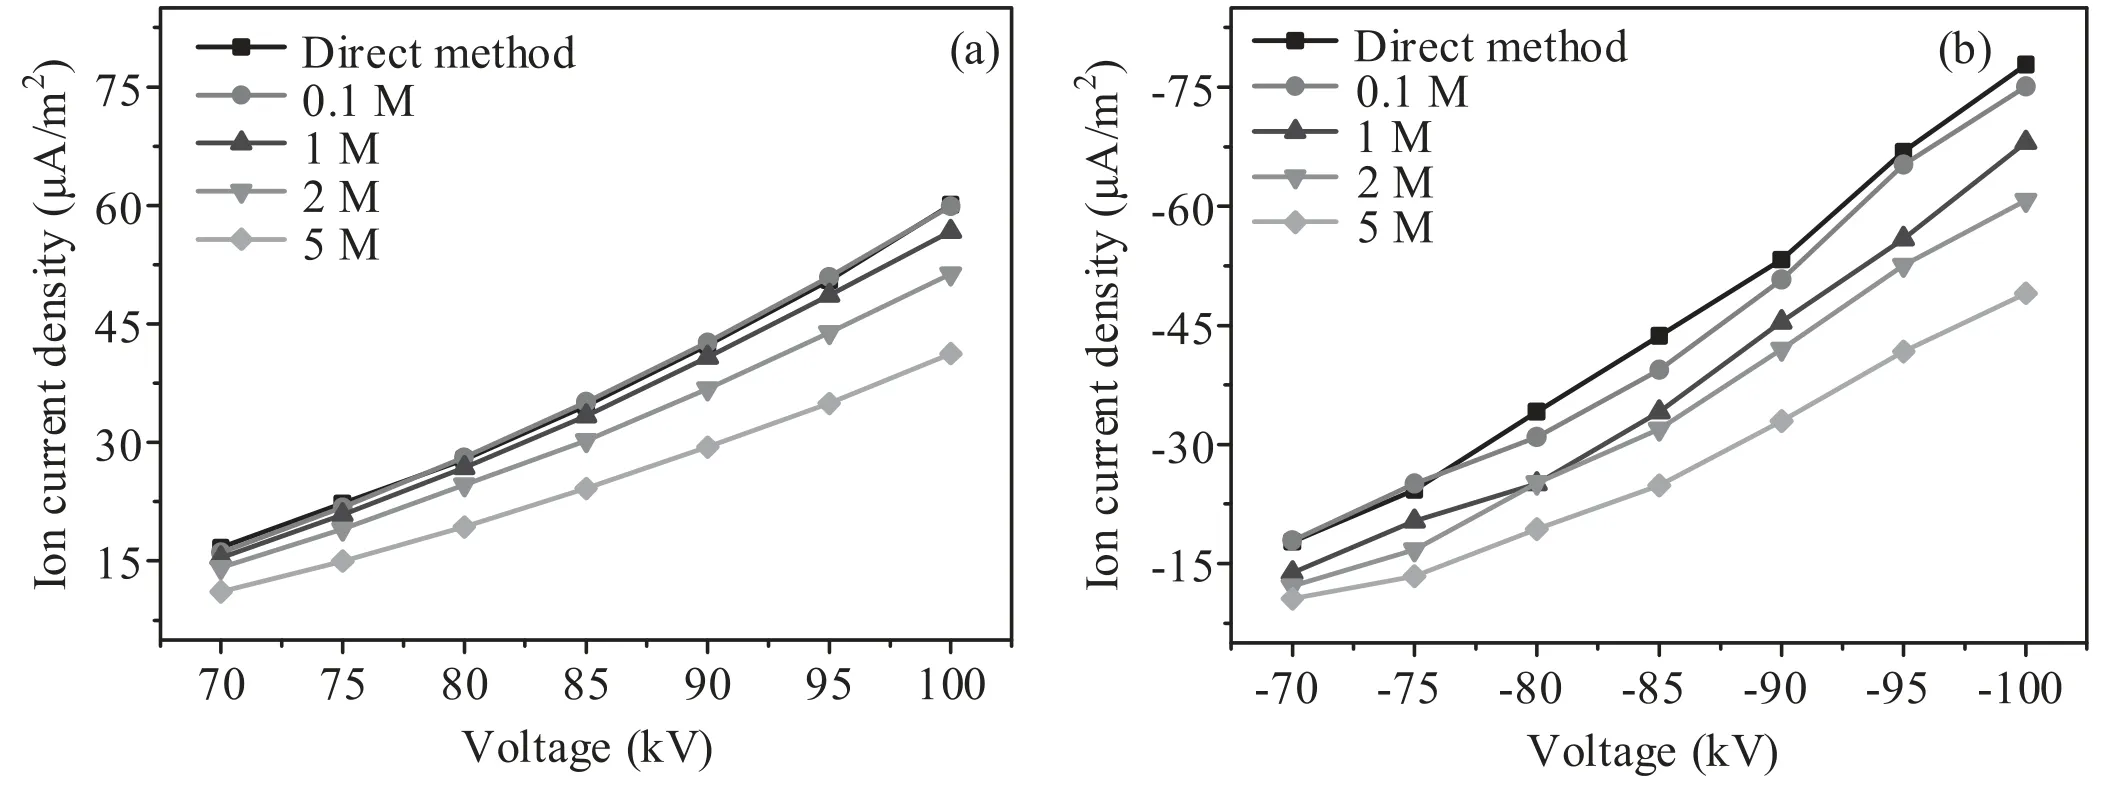
Figure 6.Comparison of the ion current density of different measurement methods under different voltages.
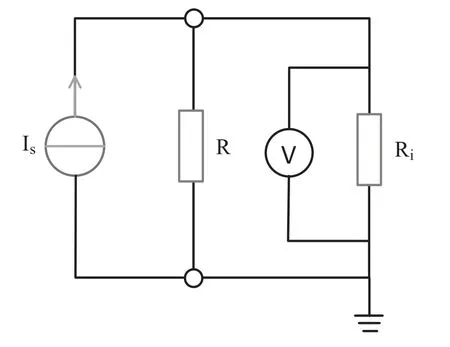
Figure 7.Working principle of the digital voltmeter.
In the measurement process of ion current density,the working principle of a digital voltmeter is shown in figure 7.The ion current produced by corona discharge is equivalent to a direct current source Is.R and Rirepresent the sampling resistance and internal resistance of the instrument,respectively.
It can be found that the R and Ribelong to the parallel relationship,so the voltage measured by a digital voltmeter is the value of parallel to the resistances.Because the internal resistance of the digital voltmeter is 10 M,which is the same order of magnitude as the sampling resistances,the measurement results need to be corrected.The corrected results of ground level ion current density under different positive and negative voltages are shown in figure 8.
It can be seen that the ion current density corrected by the sampling resistance method under positive voltage is basically the same as that measured by the micro-current galvanometer method.However,the results obtained by the two methods are slightly different under negative voltage,which may be due to the instability of negative corona discharge and the inconsistency of conductor surface conditions.
3.4.Applications
Based on the above research results,the distributions of ground level ion current density under unipolar and bipolar HVDC transmission lines are measured.Figure 9 shows the reduced scale line-plate experimental device for measuring 7 points of ion current density.The size of the Wilson plate is 168 × 218 mm2and it has four chamfers with a radius of 19 mm.The width of the protective annulus is 1 mm.The Wilson plates are 175 mm apart from each other.In the experiment,the Wilson plate is flush with the grounding plate and the ground level ion current density is measured directly by the micro-current galvanometer method.
3.4.1.Distribution of the ground level ion current density under unipolarity.Figure 10 shows the ground level ion current density distribution of unipolar high voltage conductor under different positive and negative voltages.The conductor is placed at 500 mm above the grounding plate,of which the diameter is 3 mm and the length is 1600 mm.It can be found that the distribution of ground level ion current density of positive polarity is basically symmetrical,while that of negative polarity is not symmetrical with the increase of voltage,which may be due to the uneven distribution of burrs on the conductor surface.With the increase of applied voltage,the ground level ion current density increases rapidly,and the change of the ion current density is the most obvious in the region directly below the conductor (position 4).The ion current mainly concentrates in the region between position 2 and position 6 where the ion current decreases rapidly with the increase of distance from position 4.At the same applied voltage,the ground level ion current density of negative polarity is greater than that of positive polarity,which is due to the following two reasons: (1) the corona onset voltage of negative polarity (–60 kV)is lower than that of positive polarity(70 kV),which makes the negative corona discharge more intense; (2) the rate of the movement of electrons is much faster than that of positive ions,which results in the current of electrons reaching the ground level being larger than that of positive ions.
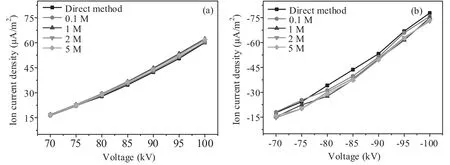
Figure 8.Comparison of ion current density after the correction of different measurement methods under different voltages.
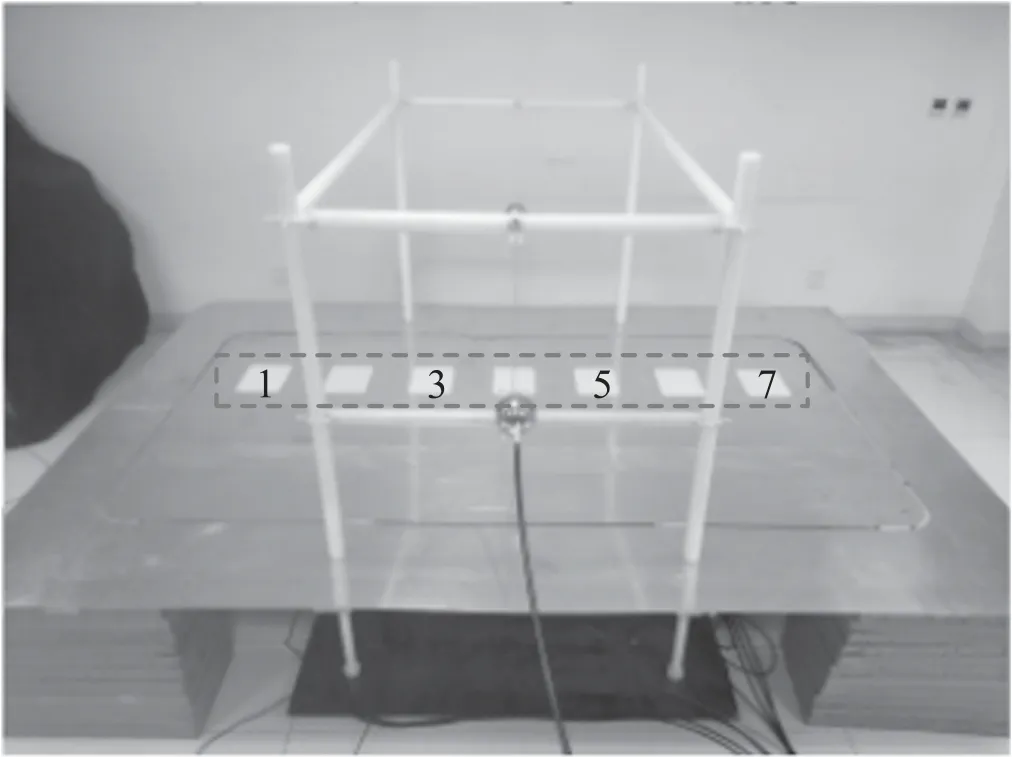
Figure 9.Experimental device for measuring multi-points of the ion current density.
3.4.2.Distribution of the ground level ion current density under bipolarity.Figure 11 shows the ground level ion current density distribution of bipolar high voltage conductors under different voltages.The conductors are placed 500 mm above the grounding plate,of which the diameter is 3 mm and the length is 1600 mm.The distance between the two conductors is 510 mm.It can be seen that,with the increase of voltage,the ion current density at position 4 fluctuates near zero,and there is a process from positive to negative.The reasons are as follows: the corona discharge is weak at 50 kV.Because of the instability of negative corona discharge,position 4 exhibits a very small positive ion current.However,because the threshold voltage of negative corona discharge is lower than that of positive corona discharge,the ion current density at position 4 shows an obvious negative value when the voltage is higher.Besides,it can be found that,with the increase of voltage,the zero value of the ion current density in the central region of the grounding plate appears between position 4 and position 5.
In addition,the ground level ion current density in the negative conductor region is significantly higher than that in the positive conductor region.This is the same as unipolar corona discharge.Furthermore,at the same applied voltage,the ground level ion current density in the positive and negative regions of the bipolar conductors is lower than that in the positive and negative unipolar conductors,which is due to the neutralization of positive and negative charged ions produced by the corona discharge of bipolar conductors in the space region.
4.Conclusions
In this paper,based on the reduced scale line-plate experimental device in which the Wilson plate is flush with the grounding plate,the influencing factors of the ground level ion current density measurement system are analyzed.The conclusions reached are as follows.
When the width of the protective annulus is less than 2 mm,the influence of the edge effect on the measurement results of the ground level ion current density can be neglected.The internal resistance of a digital voltmeter seriously affects the measurement results.In order to obtain more accurate values,the measurement results need to be corrected.The ground level ion current density should be measured directly by the way that the Wilson plate is flush with the grounding plate as much as possible.
Under unipolar conductor,the surface morphology of a conductor has a great influence on the symmetrical distribution of ion current density.Under bipolar conductors,the ion current density in the central region of the grounding plate undergoes a process from positive to negative.At the same applied voltage,the ground level ion current density of positive corona discharge is lower than that of negative corona discharge.
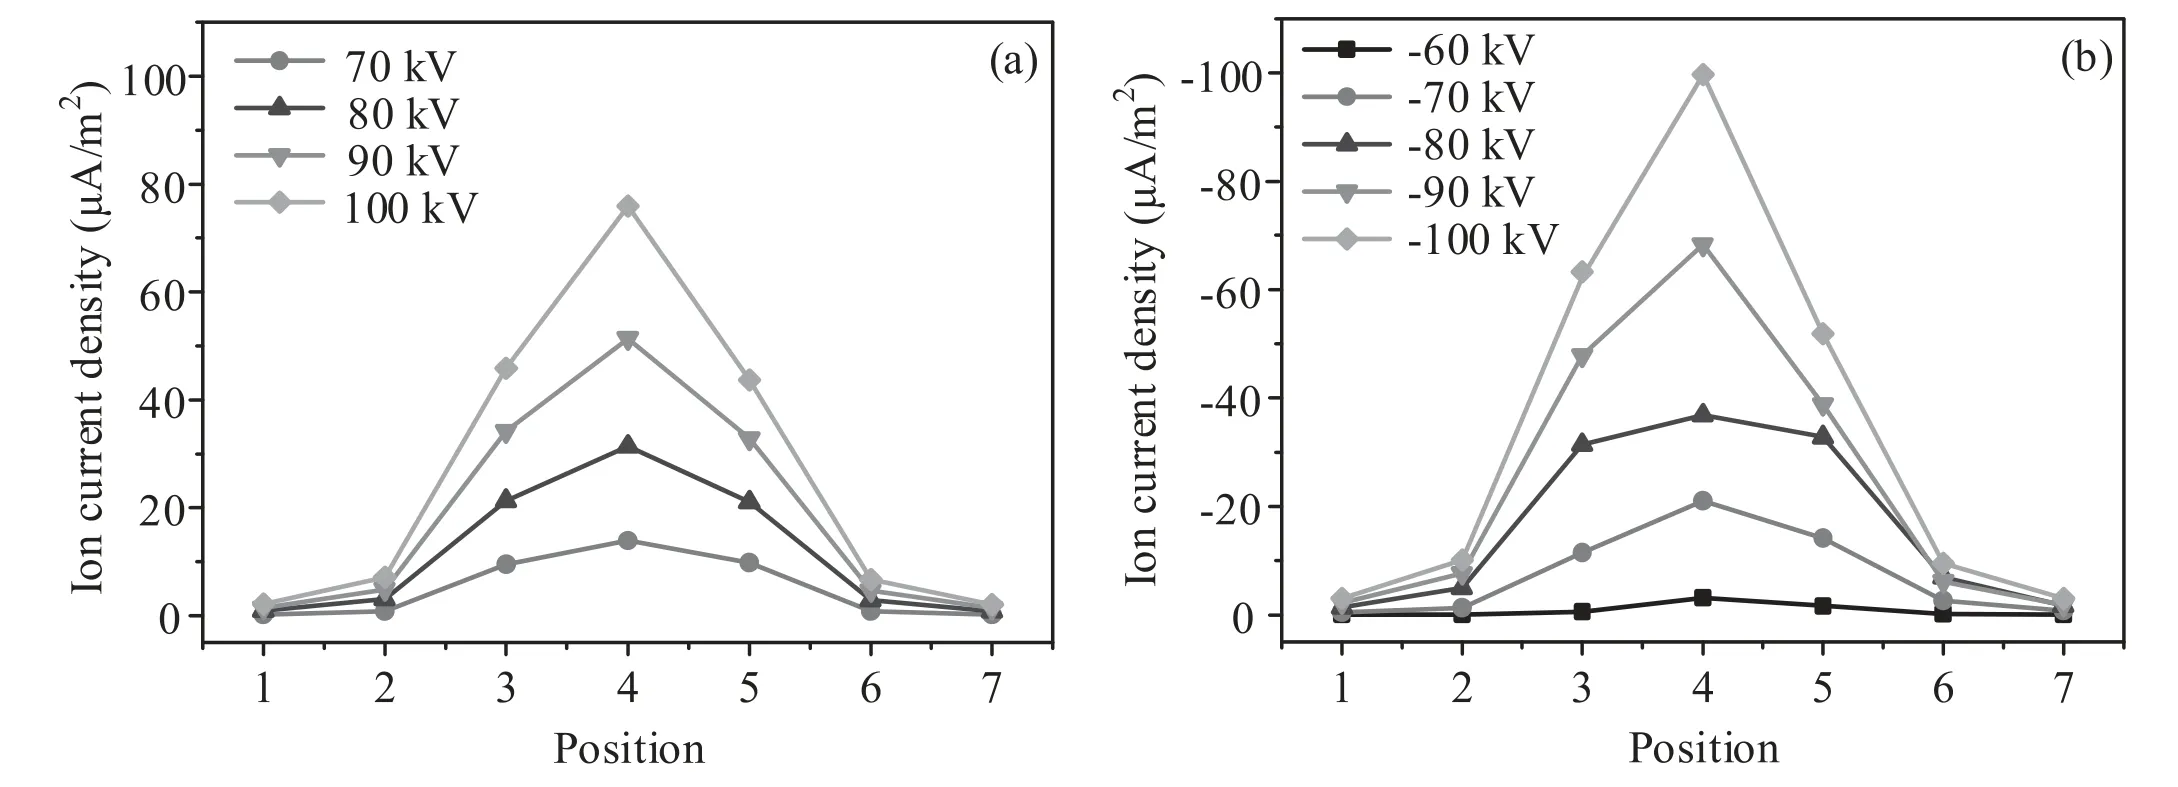
Figure 10.Distribution of the ground level ion current density under unipolarity.
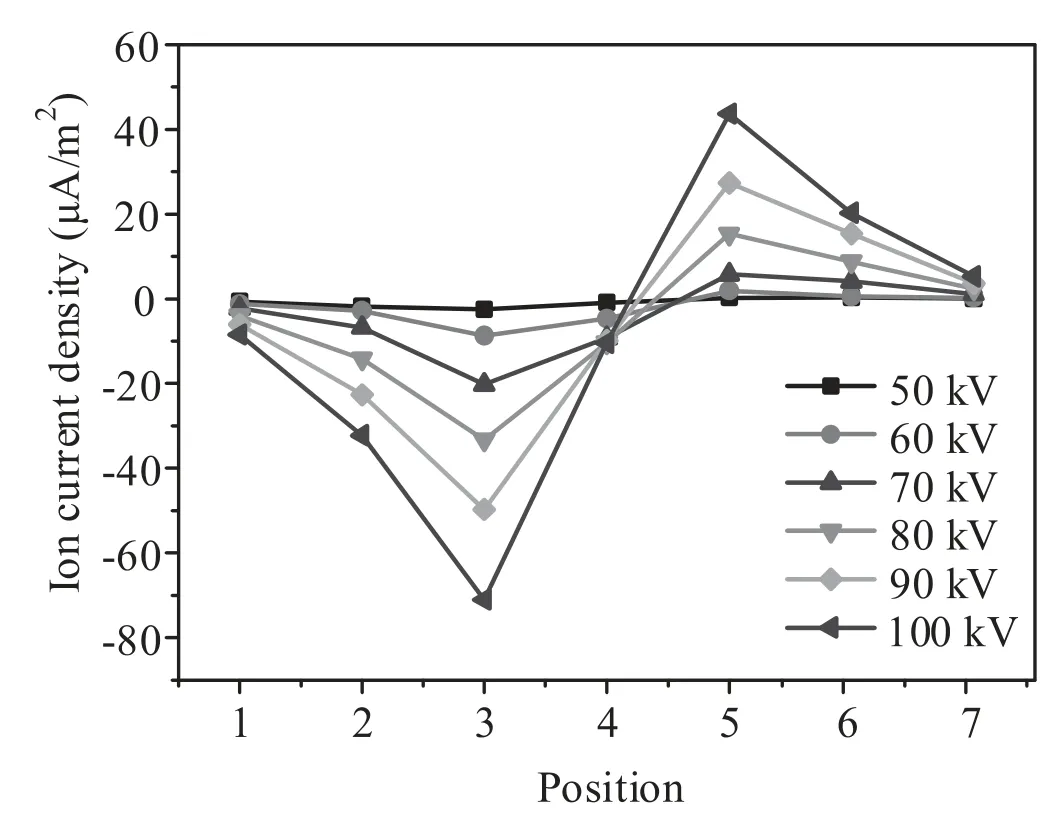
Figure 11.Distribution of the ground level ion current density under bipolarity.
Acknowledgments
This work are supported by National Natural Science Foundation of China (Nos.51877027,51877028) and State Key Laboratory of Electrical Insulation and Power Equipment(EIPE18206).
猜你喜欢
Plasma Science and Technology(2022年10期)2022-09-06
客联(2022年3期)2022-05-31
Plasma Science and Technology(2022年4期)2022-05-05
中国典型病例大全(2022年9期)2022-04-19
健康体检与管理(2022年2期)2022-04-15
美与时代·城市版(2021年6期)2021-09-12
源流(2021年11期)2021-03-25
小天使·一年级语数英综合(2020年3期)2020-12-16
小天使·一年级语数英综合(2020年2期)2020-02-04
喜剧世界(2017年12期)2017-12-06
 Plasma Science and Technology2020年4期
- Plasma Science and Technology的其它文章
- Trap distribution of polymeric materials and its effect on surface flashover in vacuum
- Improvement of the electrical resistivity of epoxy resin at elevated temperature by adding a positive temperature coefficient BaTiO3-based compound
- Controlling fine particles in flue gas from lead-zinc smelting by plasma technology
- Kinetic simulation of an electronegative plasma with a cut-off distribution and modified Bohm criterion
- Suppression of a spontaneous dust density wave by modulation of ion streaming
- An investigation of the L-shell x-ray conversion efficiency for laser-irradiated tin foils