硝酸辅助合成水溶性绿光碳点及其在pH测量与Fe3+检测中的应用
2020-09-10 07:36康亚超黄园媛孙化振郑万里马献力蒋东丽
无机化学学报 2020年9期
康亚超 黄园媛 孙化振 郑万里 马献力 蒋东丽*,
(1桂林医学院药学院,桂林 541100)
(2桂林理工大学材料科学与工程学院,桂林 541004)
In the past decade,the fluorescent carbon dots(CDs),as a kind of new fluorescent material,has demonstrated its bright application prospects in cell imaging[1],photocatalysis[2],photoelectric devices[3],biosen-sors[4]and other fields due to its unique luminescence characteristics,stable optical properties[5]and other advantages.Compared with traditional semiconductor quantum dots,fluorescent carbon dots exhibit better biocompatibility since they are free of toxic heavy metals.However,most of the reported fluorescent carbon dots emit blue light,which are similar to the blue fluorescence emitting from the fluorescent substances in the organism after excitation,resulting in a relatively low signal-to-noise of the living body fluorescence imaging[6].Meanwhile,the short-wavelength excitation light will be harmful to living cells and biological systems[7].Obviously,these shortcomings seriously hinder their further application in the biological field.Therefore,synthesizing long-wave emission fluorescent carbon dots has gradually become a new research hotspot.Recently,some red or green fluorescent carbon dots have been reported with the efforts of the researchers.Gao et al.[8]synthesized carbon dots that emitted red fluorescence in DMSO.Ding et al.[9]obtained different long-wave emission fluorescent carbon dots by separating via silica column chromatography.Lu et al.[10]acquired an orange-red fluorescent polymer carbon dots in alcohol with a quantum yield(QY)of 30.64%,in which dopamine ando-phenylendiamine were used as the carbon source.Xu et al.[11]reported a green fluorescent CDs(QY=2.46%)prepared by hydrothermal method using aniline and urea as raw materials.Miao et al.[12]synthesized fluorescence carbon dots from citric acid and urea,which could emit green fluorescence in ethanol.However,the reported long-wave emission CDs usually suffer from several drawbacks such as poor water-solubility,low quantum yield,expensive raw materials,complex synthesis processes and single function.Consequently,it is still a challenge to develop cheaper and simpler processes to synthesize longwave emission fluorescent carbon dots that can serve multiple purposes with good water-solubility and high quantum yield.
Iron ion(Fe3+)is one of the essential trace elements in the human body.It is an essential component of heme groups and iron-sulfur protein.It plays a crucial role in many physiological activities,including enzyme catalysis,oxygen transportation,oxygen metabolism,transcriptional regulation and other processes[13].Studies have demonstrated that the deficiency or excess of iron ions in the human body can lead to various physical problems such as anemia,heart failure and tissue damage[14].Therefore,it is very important to detect Fe3+selectively and accuratelyin the environments and organisms.So far,the methods for detecting Fe3+mainly include spectrophotometry[15],inductively coupled plasma-mass spectrometry[16],atomic absorption spectrometry[17]and electrochemistry[18].These detection methods show high precision and accuracy.However,they usually require complicated operation process,cumbersome sample processing and expensive equipment,which make them difficult to suit for rapid detection.Fluorescence spectrometry can be designed to detect metal ions due to their high sensitivity,convenience and fast response.Nevertheless,the reported fluorescent probes,such as the organic chromophore,the fluorescent conjugated polymer and the traditional semiconductor quantum dots,are generally toxic,water insoluble and poor biocompatibility,which may limit their applications in biological detection.Accordingly,it is very important and necessary to develop a lowcost,biocompatible,low-toxic,water-soluble fluorescent probe for Fe3+detection.
In this work,a good water-solubility green fluorescence-emitting carbon dots was synthesized using cheap citric acid,formamide and concentrated nitric acid as raw materials.The fluorescence performance of as-prepared CDs was examined,and its possible applications in anti-counterfeiting technique,the pH probe and Fe3+detection were investigated.
1 Experimental
1.1 Experimental materials
Citric acid,HCONH2,CH3COCH3,HNO3,KBr,Fe(NO3)3,NiCl2and Cu(NO3)2were purchased from Xilong chemical industry Co.,Ltd.;SnCl2,NaOH,MgCl2,AgNO3,CrCl3,HgCl2,Pb(NO3)2,Cd(NO3)2and BaCl2were obtained from Sinopharm Chemical Reagent Co.,Ltd.The reagents used were all AR grade.The ultrapure water used in the experiment was from HHitech Medium-S800UVF with a resistivity of 18.2 MΩ·cm.
1.2 Synthesis of CDs
The preparation of the CDs precursor was similar to the related literature[8].Firstly,1.53 g of citric acid was dissolved in 25 mL formamide thoroughly to form a clear solution.Afterward,the as-prepared solution was transferred to 50 mL Teflon-lined stainless-steel autoclave and heated at 160℃for 6 h in an oven.After cooling down to room temperature,the as-prepared solution was centrifuged at the speed of 16 000 r·min-1for 5 min.The precipitate was washed with acetone until the supernatant being colorless and dried in an oven at 60℃for 12 h to obtain the CDs precursor.
Then,0.04 g of CDs precursor reacted with 0.5 mL of concentrated nitric acid for 1 min at room temperature.After that,ultrapure water was added into the mixture to prepare 50 mL solution.Subsequently,the mixed solution was centrifuged at the speed of 16 000 r·min-1for 5 min.The supernatant(the green fluorescent CDs solution)was retained and stored at 4℃for further research.
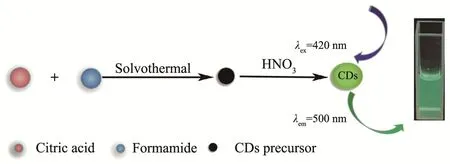
Fig.1 Schematic diagram of synthesis of green fluorescent CDs
1.3 Characterization of CDs
After lyophilizing the CDs with BIOCOOL Pilot 2-4LD vacuum freeze dryer,its phase composition was characterized by the Bruker D8 Advance X-ray diffractometer operated at 40 kV and 40 mA with a graphite monochromatized CuKα1radiation(λ=0.154 06 nm).The sample was tested at a scan rate of 6(°)·min-1with the scanning 2θangles from 10°to 70°.The morphology,size and dispersibility of the sample were observed by FEITecnaiF20 field emission high resolutiontransmission electron microscope(HRTEM)at an accelerating voltage of 200 kV.The functional groups of the samples were measured by Fourier transform infrared spectroscopy(FT-IR,IRPrestige-21)using the KBr pellet technique with a scan range of 4 000~400 cm-1.
The fluorescence spectra of the samples were tested with Shimadzu RF-5301 fluorescence spectrometer.The fluorescence lifetime of the sample was measured using a FLS-980 fluorescence spectrophotometer with 359 nm as the excitation wavelength.The QY of CDs was measured according to the method described in the literature[19].The rhodamine 6G was chosen as the standard substance.The UV absorption values of CDs solution and rhodamine 6G(dissolved in absolute ethanol)were measured by UV-1600PC ultraviolet spectrophotometer(the UV absorption value was ensured to be below 0.1[20]).The UV absorption values and the fluorescence emission curve of the CDs solution and the rhodamine 6G solution were measured with excitation at 420 nm.The calculated peak area and the measured UV absorption value were substituted into the following formula:

WhereΦis the QY(Φs=95%),Ais the ultraviolet absorption value,Fis the integral area of the fluorescence emission curve,ηis the refractive index of the solvent,s is the standard substance,and x is the sample to be tested.
1.4 Effect of pH values on the fluorescence of the CDs
To investigate the effect of pH value of the solution on the fluorescence intensity of the green fluorescent CDs,experiments were carried out in PBS with diluted HCl or NaOH to adjust the pH values from 1 to 10.The solutions for testing were prepared by mixing the CDs original solution and the above PBS solution with a designated pH value by a volume ratio of 1∶49,and then trace amounts of 1 mol·L-1HCl or 1 mol·L-1NaOH was used to fine-tune the pH value of the asprepared mixture.The changes in fluorescence intensity of CDs were measured using 420 nm as the excitation wavelength.
1.5 CDs for Fe3+detection
To investigate whether the green fluorescence of the as-prepared CDs can be quenched by Fe3+ions,the CDs original solution was diluted by ultrapure water with a volume ratio of 1∶49 and then 1 mol·L-1Fe3+was dropped into the diluted CDs solution to form a solution with a Fe3+concentration of 20 mmol·L-1.The fluorescence intensities of diluted CDs solution before and after adding Fe3+were first estimated by visual inspection and precisely tested with Shimadzu RF-5301 fluorescence spectrometer.
And then,the selectivity and specificity of the asprepared CDs in Fe3+ions detection was evaluated as follows:1 mol·L-1of Mn+solution(Mn+=Fe3+,Ba2+,Ag+,Cd2+,Cr3+,Hg2+,Mg2+,Ni2+,Pb2+,Sn2+,Zn2+)was added into the diluted CDs solution(1∶50 dilution of CDs original solution by ultrapure water)to form a solution with a Mn+concentration of 20 mmol·L-1.The fluorescence intensities of the above solutions were measured under the same test conditions.
To examine the sensitivity of the as-prepared CDs in Fe3+ions detection,100 μL of different concentrations of Fe3+solutions was added into 4.9 mL of CDs diluted solution(dilution ratio being 1∶50)to prepare solutions with Fe3+concentration of 0~20 mmol·L-1,their emission fluorescence spectra were measured under the same test parameter.
2 Results and discussion
2.1 Analysis of phase,morphology and functional groups of CDs
Fig.2a is the X-ray diffraction(XRD)pattern of the as-prepared CDs.The broad diffraction peak centered at 2θ=26°can be attributed to amorphous carbon.And thedvalue(0.34 nm)is similar to the graphite lattice space,indicating a graphite structure being in the CDs[21-23].
It can be observed from the TEM and HRTEM images of the CDs sample(Fig.2b and c)that the CDs particles were well dispersed quasi-spherical nanoparticles.The particle diameter was 1.64~5.91 nm,and the average particle diameter was(3.40±1.03)nm.The measured lattice spacing was about 0.24 nm,which was close to the lattice spacing of graphene(1120)[24].In addition,as shown in Fig.2c,most particles were amorphous particles without any obvious lattice fringes,which is consistent with the XRD pattern results.
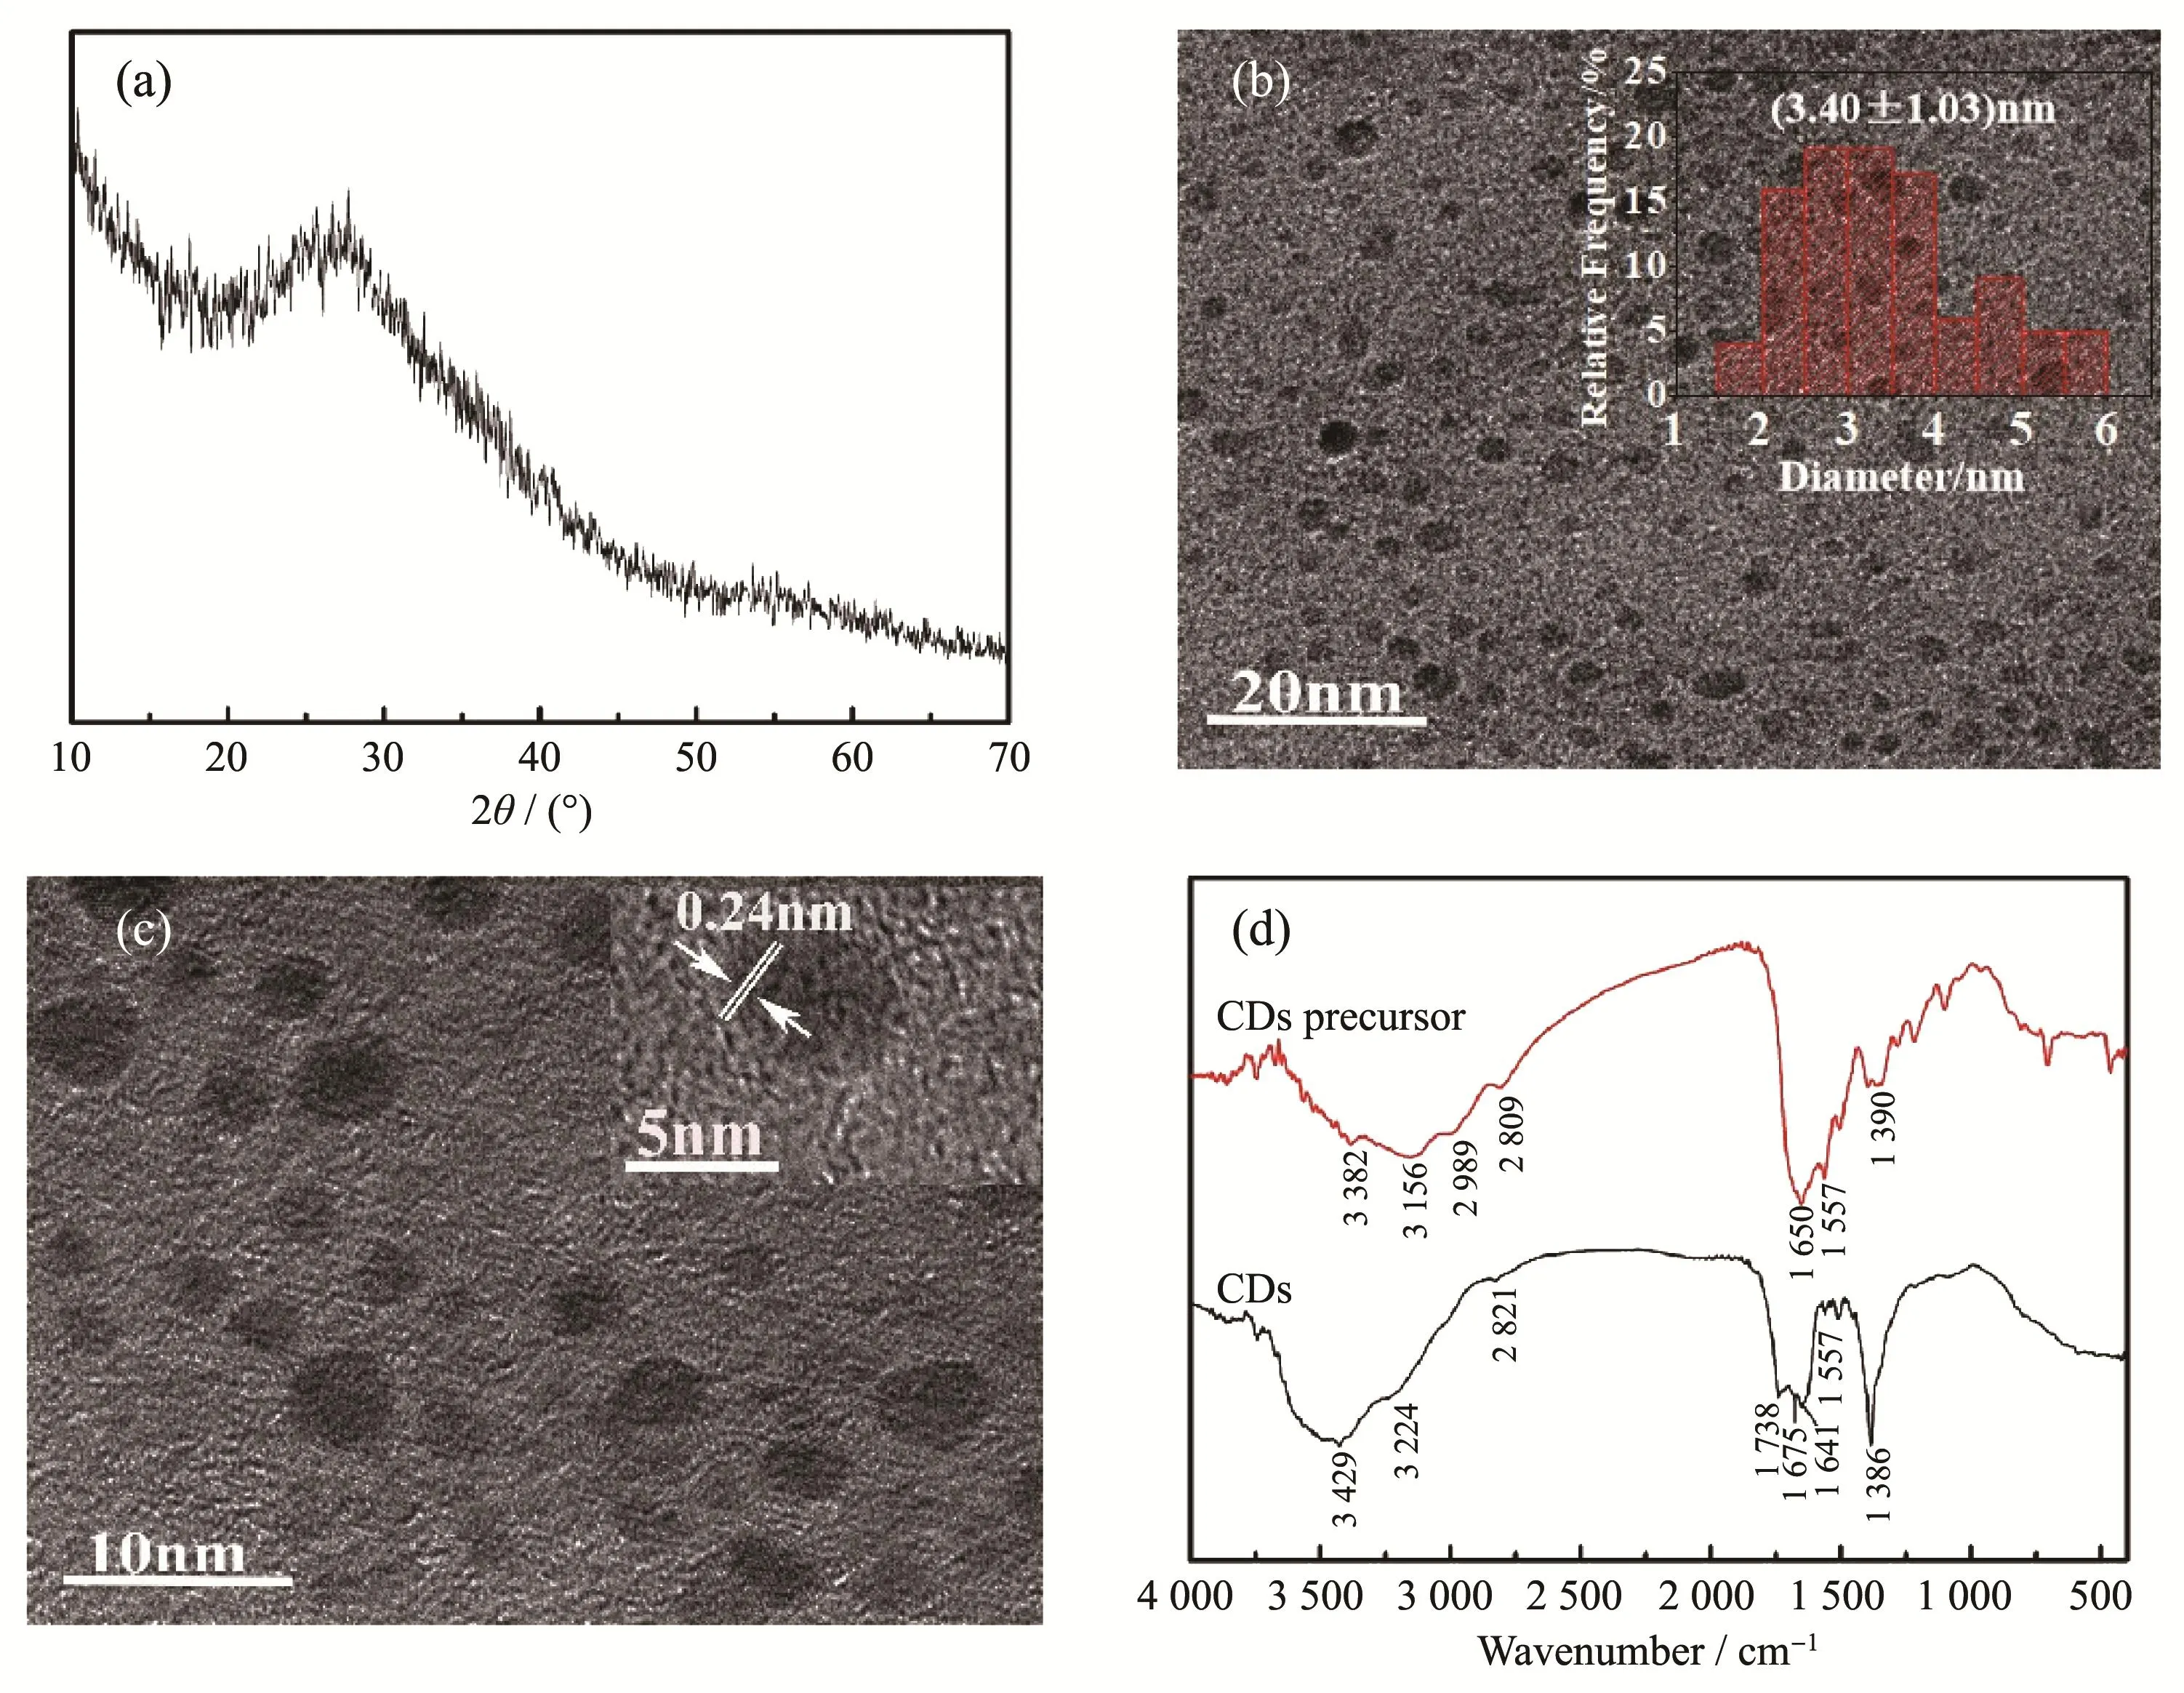
Fig.2 (a)XRD pattern of CDs;(b)TEM image of CDs(Inset:diameter distribution of CDs);(c)HRTEM images of CDs;(d)FT-IR spectra of CDs precursor and CDs
Fig.2d is the comparison of infrared spectra of CDs precursors and CDs samples.There were broad absorption peaks at 3 000~3 500 cm-1and weak absorption peaks at 2 809,2 989 and 2 820 cm-1in both spectra of CDs and CDs precursors which can be assigned to O-H[25]and N-H[26]stretching vibration peaks and the stretching vibration of C-H[27],respectively.And the peaks at 1 650 and 1 675 cm-1can be attributed to the stretching vibration of C=O[28],the absorption peak at1 557 cm-1corresponds to the deformation vibration of N-H[29],which demonstrate that the amide bonds exist in both CDs and CDs precursors.However,unlike the IR spectra of CDs precursors,there was a strong absorption peak at 1 389 cm-1,suggesting the-NO2groups on the CDs surface.Another strong absorption peak of CDs at 1 738 cm-1indicates the carbonyl of the carboxyl groups[30]existing in the CDs,and the carboxyl groups may be the product of partial hydrolysis of the amide bonds by treating the CDs precursor with concentrated nitric acid.Obviously,there are rich hydrophilic groups such as carboxyl groups,hydroxyl groups and nitro groups on the CDs surface,leading to a good water-solubility of CDs.
2.2 Analysis of fluorescence performance of CDs
The green fluorescent CDs is essentially colorless under natural light and can emit bright green fluorescence under UV light(Fig.3a inset).From its fluorescence spectra(Fig.3a),it is obvious that as the excitation wavelength ranged from 360 to 460 nm,the CDs kept emitting green fluorescence with maximum peak around 500 nm,revealing an excitation-independent PL behavior.When the excitation wavelength was 420 nm,the fluorescence intensity reached the maximum.By choosing rhodamine 6G as the reference substance,its relative QY was measured as high as 44.2% in water.
Fig.3b is the fluorescence lifetime decay profile of the as-prepared CDs.Apparently,the fluorescence lifetime of the as-prepared CDs was single exponential decay with only one fluorescence lifetime of 9.69 ns.The result indicates that the green CDs is relatively uniform in structure[11],which might be the reason for it sexcitation-independent PL behavior mentioned above.
Fig.3 (a)Fluorescence spectra of CDs;(b)Fluorescence lifetime decay profile of CDs
2.3 Valuation of applications of as-prepared CDs
2.3.1 CDs for fluorescent ink in anti-counterfeiting
The above results confirm excellent fluorescence characteristics of the as-prepared CDs.When it was used as ink to write words on a piece of paper,the written words emerged clearly with green fluorescence under 365 nm UV light and were invisible in natural light(Fig.4a).This property highlights its promising application in fluorescent ink and anti-counterfeiting.
2.3.2 CDs for pH measurement
Unlike most of reported carbon dots,the fluorescence intensity of as-prepared CDs varied with the pH values of the CDs solution.As shown in Fig.4b and 4c,the fluorescence intensity of CDs got stronger as the pH value varied from 1 to 4,and it reached the maximum when the pH value was 4.The fluorescence intensity of CDs solution decreased rapidly as the pH value continued increasing;particularly,the normalized fluorescence intensity decreased linearly asthe pH increased from 4.5 to 8.5(Fig.4d),and the corresponding equation wasy=1.486 6-0.163 4pH with the linear correlation coefficientR2=0.972 3.In extreme alkaline environment,the fluorescence of CDs almost became hard to be detected.The possible reasons are as fol-lows:with the change of pH value of solution,the protonation and deprotonation[31]of carboxyl functional groups on the surface of CDs may change the Fermi[32]level of CDs,resulting in the pH dependence of CDs.The above results show that the as-prepared CDs may have potential application as fluorescent sensors for pH measurement,especially in the physiological pH range.

Fig.4 (a)Photos of text written with CDs solution under natural light(left)and UV light(right);(b)Emission spectra of as-prepared CDs solutions at different pH values;(c)Normalized fluorescence intensity of as-prepared CDs solutions at different pH values;(d)Linear relationship between normalized fluorescence intensity of as-prepared CDs solutions and pH value in a range of 4.5~8.5
2.3.3 CDs for Fe3+ions detection
As shown in Fig.5a,a concentration of 20 mmol·L-1Fe3+ions might significantly quench the bright green fluorescence of CDs,indicating the as-prepared CDs may be applied in Fe3+ions detection.Some common metal ions(Mn+=Fe3+,Ba2+,Ag+,Cd2+,Cr3+,Hg2+,Mg2+,Ni2+,Pb2+,Sn2+and Zn2+)were chosen as research subjects to investigate the selectivity and specificity of CDs in Fe3+ions detection.The corresponding results are shown in Fig.5b.Clearly,when the concentrations of the selected metal ions were 20 mmol·L-1,three kinds of ions(Fe3+,Cr3+and Sn2+)had a considerable effect on the fluorescence of CDs.The fluorescence quenching efficiency of Fe3+,Cr3+and Sn2+to CDs was calculated to be 98%,62% and 70%,respectively.In comparison,the fluorescence of CDs can be almost completely quenched by Fe3+,indicating good selectivity and specificity of CDs in Fe3+ions detection,especially in an environment without Cr3+and Sn2+.
In view of this,the sensitivity of CDs in Fe3+ions detection was further explored.The results are shown in Fig.5c and d.Obviously,the fluorescence intensity of CDs decreased rapidly when the concentration of Fe3+increased from 0 to 1 mmol·L-1,and a slowly fluorescence decrease behavior appeared as the concentration of Fe3+continued to rise from 1 to 20 mmol·L-1.When the concentration of Fe3+ions reached 8 mmol·L-1,the fluorescence intensity of CDs was substantially quenched.Further investigation reveals that there is a good linear relationship between the quenching efficiency of green fluorescence CDs(I0/I)and the concentration of Fe3+within a range of 0~1 000 μmol·L-1(Fig.5e),which is consistent with the Stern-Volmer[13]equation.whereI0is the fluorescence intensity of CDs without Fe3+;Iis the fluorescence intensity of CDs after adding Fe3+;KSVis the Stern-Volmer quenching constant;cQis the concentration of Fe3+(μmol·L-1).Taking the Fe3+concentration as the abscissa andI0/Ias the ordinate,the equation of Stern-Volmer was obtained as follows:y=0.962 4+0.001 02x,and the linear correlation coefficientR2was 0.985 6.The detection limit was 9.8 μmol·L-1based on 3σ/k(σis the standard deviation of the blank measurements of the CDs andkis the slope of the fitting line).The above results indicate potential application of the CDs in low concentration Fe3+detection.


Fig.5 (a)Emission spectra of CDs solution before and after adding Fe3+(20 mmol·L-1);(b)Fluorescence responses of CDs in the presence of different metal ions(I and I0correspond to the fluorescence intensity with and without metal ions,respectively;the metal ion concentration is 20 mmol·L-1);(c)Emission spectra of CDs in the presence of Fe3+with different concentrations;(d)Plot of fluorescence intensity ratio(I/I0)of CDs versus concentration of Fe3+;(e)Stern-Volmer plot of CDs in the presence of Fe3+with different concentrations(0~1 000 μmol·L-1);(f)Lineweaver-Burk double-reciprocal plot of CDs in the presence of Fe3+with different concentrations(800 μmol·L-1~8 mmol·L-1)
From the above results,it can be found that the CDs applied for ion detection is based on the fluorescence quenching of CDs by Fe3+.Generally,fluorescence quenching can be divided into dynamic quenching and static quenching[33].The Stern-Volmer equation(2)and the Lineweaver-Burk equation(3)[34]are usually employed to describe the dynamic and static quenching behavior,respectively.

whereKLBis the binding constant of Fe3+and CDs during static fluorescence quenching.As mentioned above,the fluorescence quenching efficiency of CDs by the Fe3+at a concentration range of 0~1 000 μmol·L-1is consistent with the Stern-Volmer equation,indicating a dynamic quenching behavior involved.Yet,when the concentrations of Fe3+increased from 800 μmol·L-1to 8 mmol·L-1,the plot ofI0/Iversus Fe3+ion concentration can be fitted with a conventional linear Lineweaver-Burk equation(Fig.5f),suggesting a static quenching processes occurred.Hence,the fluorescence quenching effect of Fe3+to CDs involves both dynamic and static quenching in the entire test concentration range.
The possible fluorescence quenching mechanism by Fe3+is analyzed.The IR spectra of CDs reveal that there are a large number of hydroxyl,carboxyl groups and nitro groups on the CDs surface.The Fe3+ions may be quickly absorbed on the surface of CDs and coordinate with carboxyl groups and hydroxyl groups due to their stronger binding force and faster chelation kinetics with carboxyl and hydroxyl groups than other metal ions[35].These behaviors result in the severe aggregation of CDs with each other[35].Meanwhile,the Fe3+ions possess half-filled 3dorbits(3d5)and they are very strong electron acceptors.The electrons in the excited state of CDs may transfer to the unfilled orbital of Fe3+because of the above coordination interaction and result in non-radiative electron/hole recombination[27],which causing significant fluorescence quenching of CDs.Additionally,by analyzing the solubility product constant(Ksp)data of M(OH)n,we find that there is a certain correlation between the quenching efficiency and the value ofKsp.Compared with other metal ions,three kinds of ions(Cr3+,Sn2+,and Fe3+)with greater fluorescence quenching effect on CDs are all possessing smallerKsp(Ksp,Cr(OH)3=6×10-31,Ksp,Sn(OH)2=1.4×10⁻²⁸,Ksp,Fe(OH)3=4×10-38).It seems the higher the quenching efficiency is,the smaller theKspis.Yet,it is not an absolute positive correlation.In a word,the fluorescence quenching of CDs by Fe3+is a complicated process and may cause by cumulative impact of the above mentioned factors,which needs to be further improved.
3 Conclusions
In summary,we successfully synthesized a watersoluble green fluorescence CDs with good fluorescence properties by using citric acid,formamide and concentrated nitric acid as raw materials.The as-synthesized CDs shows an excitation-independent PL behavior and a high quantum yield(44.2%),which can be applied in anti-counterfeiting technique.The fluorescence intensity of CDs is pH sensitive,making it a potential candidate for pH measurement,especially in the physiological pH range.In addition,the green fluorescent CDs exhibits excellent selective response and a relative low detection limit(9.8 μmol·L-1)as well as a good linear relationship with Fe3+in a concentration range of 0~1 000 μmol·L-1,which endows its potential applications in Fe3+detection.
猜你喜欢
厦门大学学报(自然科学版)(2022年3期)2022-05-20
广西医科大学学报(2021年12期)2022-01-24
纺织科学研究(2021年4期)2021-12-06
植物研究(2020年6期)2020-03-05
表面技术(2019年2期)2019-02-26
纺织机械(2016年2期)2016-12-16
意林·少年版(2016年11期)2016-09-10
祝你幸福·知心(2016年3期)2016-03-29
药学实践杂志(2011年6期)2011-11-22
青少年科技博览(中学版)(2009年10期)2009-12-07