卢氏近30年来降水变化特征分析
2020-12-29 12:08贾斯
河南科技 2020年32期
关键词:卢氏
贾斯
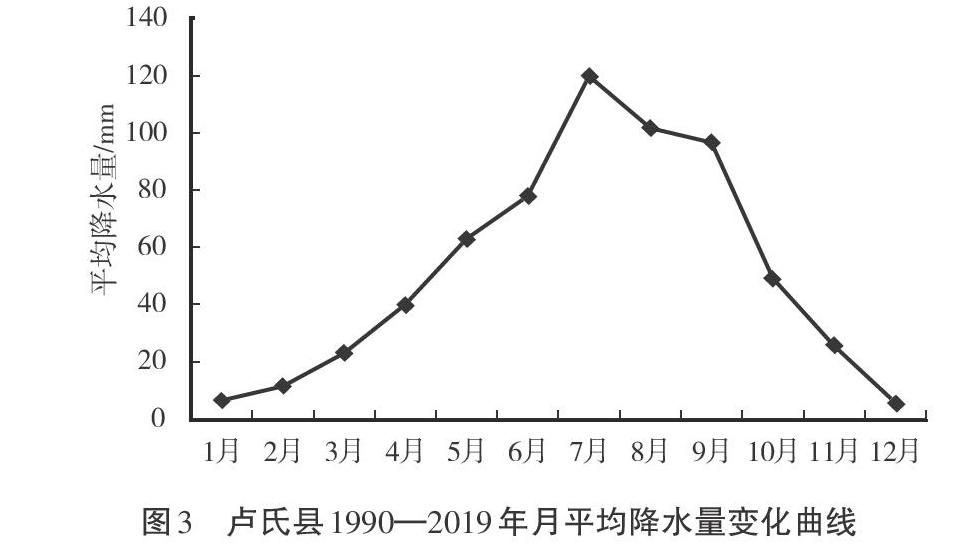
摘 要:本文以卢氏县气象局1990—2019年地面气象降水量观测资料为基础数据,得到卢氏逐年(月)的降水资料,利用5年滑动平均处理、线性趋势分析法寻找降水的季节变化趋势和周期变化规律。结果表明,近30年来,卢氏县年均降水量为619.4 mm,降水量没有明显的变化趋势,近10年内距平值为4.4 mm,与前10年相比呈缓慢下降趋势;卢氏一年四季降水变化明显,夏季降水对全年贡献最大,秋季、春季次之,冬季降水为全年最少;卢氏月降水量基本呈正态分布,每年的7月为全年降水量最多的月份,7—9月降水量相对集中,随后逐渐减少。
关键词:卢氏;近30年;降水变化特征
中圖分类号:P468.024文献标识码:A文章编号:1003-5168(2020)32-0143-04
Abstract: In this paper,based on the surface meteorological precipitation observation data of Lushi County Meteorological Bureau from 1990 to 2019, the annual (monthly) precipitation data of Lushi County were obtained, and the seasonal and periodic variation rules of precipitation were found by using 5-year moving average processing and linear trend analysis. The results show that in recent 30 years, the average annual precipitation of Lushi County is 619.4 mm, the precipitation has no obvious change trend, the anomaly value in recent ten years is 4.4 mm, which shows a slow downward trend compared with the previous ten years; the annual precipitation of Lushi County changes obviously in four seasons, the contribution of summer precipitation to the whole year is the largest, followed by autumn and spring, and winter precipitation is the least; the monthly precipitation of Lushi is basically normal distribution, July of each year is the month with the highest precipitation in the whole year, the precipitation of July to September is relatively concentrated, and then decreases gradually.
Keywords: Lushi;recent 30 years;precipitation change characteristics
卢氏县地处黄河、长江分水岭南北两麓,地势西南高,东北低,主要由中山、低山、丘陵、河谷盆地组成[1]。其在地质构造上位于华北地台和秦岭地槽衔接地带,区域性深大断裂从卢氏县腹地穿过,该地属地质灾害多发区。洪涝、干旱、暴雨、连阴雨等灾害天气均与降水量的多少有关,所以,气象预报中的降水预报需要特别注意研究[2-3]。本文对卢氏县近30年的降水数据进行统计分析,寻找降水变化的规律,为应对降水变化可能造成的影响提供一定的保障。
1 资料来源和方法
本研究以卢氏县气象局1990—2019年地面气象降水量观测资料为基础数据,得到卢氏逐年(月)的降水资料,利用5年滑动平均处理、线性趋势分析法寻找降水的季节变化趋势、周期变化规律。
本文分析的时间尺度包括:年(1—12月)、春季(3—5月)、夏季(6—8月)、秋季(9—11月)、冬季(12月至次年2月)。
2 分析过程
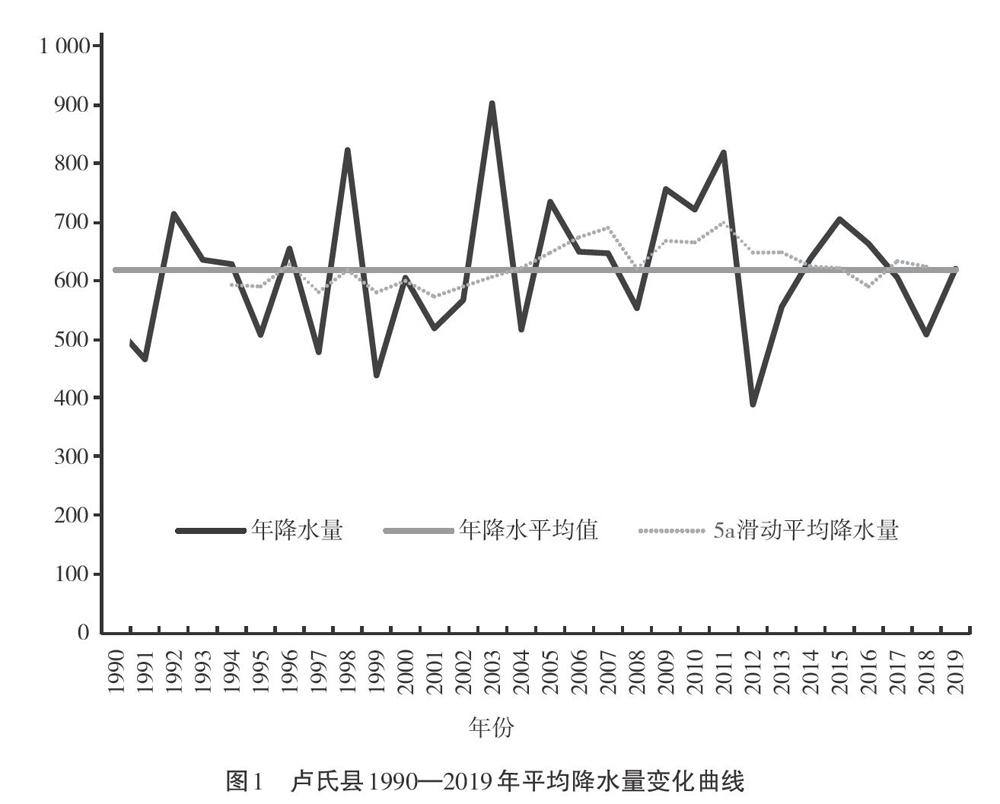
近30年来,卢氏年均降水量为619.4 mm,2003年的降水(903.8 mm)为最大降水量。2012年的降水(390.3 mm)为最少降水量,两者差值达513.5 mm。对30年的年降水数据进行5年滑动平均处理,从图1中可以看到,30年中共有16年的年降水量值大于30年的年平均降水量值。其中,1990—1999年有5年,2000—2009年有5年,2010—2019年有6年。
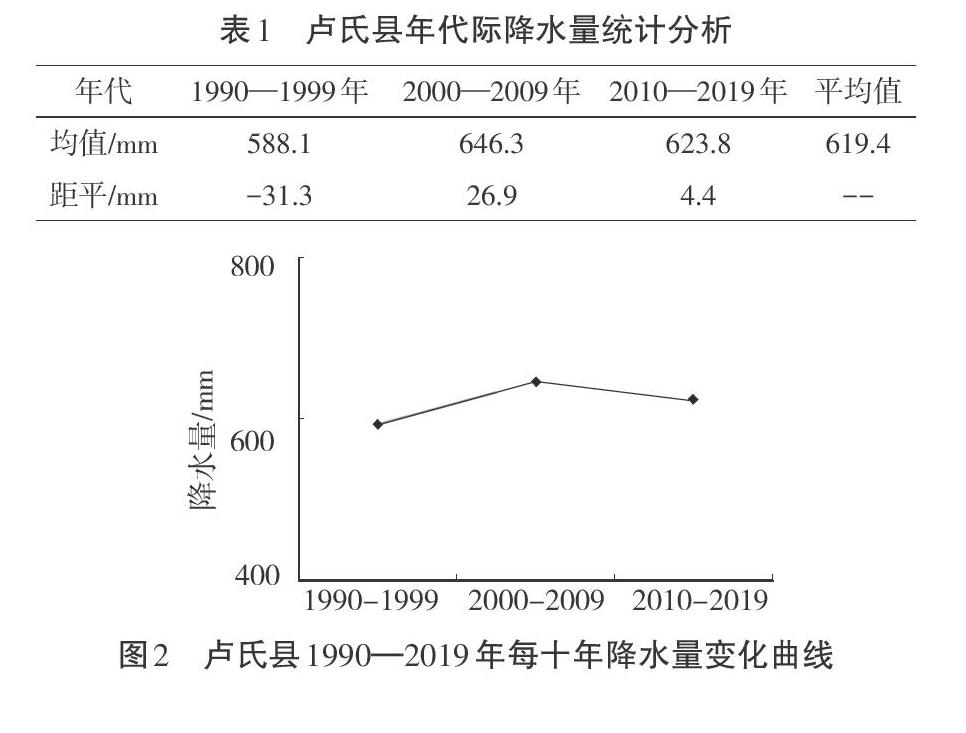
整体来看,30年降水量与时间变化曲线不明显,但以10年为一个周期(见表1、图2),1990—1999年降水量距平值为-31.3 mm,呈减少趋势,2000—2009年降水增多,距平值为26.9 mm,2010-2019年距平值为4.4 mm,与上个十年相比,呈减少趋势。
3 四季变化趋势
卢氏县1990—2019年四季平均降水量变化曲线如图4所示。其中,实线为平均降水量变化曲线,虚线为其一元线性回归方程的变化曲线。
3.1 春季
春季降水量表现出微弱的下降趋势(见图4(a))且阶段性波动较大,平均值为125.7 mm。分析其波动曲线可知,1990—1993年出现较明显的上升趋势,4年升幅达到62.4 mm;1994—1996年表现为下降趋势,均低于平均值;1997-1998年表现为上升趋势,1998年出现30年来最大值(248.7 mm);1999—2000年表现为下降趋势,且2000年出现30年来最小值(56.9 mm);2001—2002年为表现为上升趋势;2003—2008年表现为下降趋势;2009—2018年,除了2010年、2011、2012年和2013年以外,其他年份的春季降水量均高于平均值。
猜你喜欢
寻根(2021年4期)2021-08-27
农家科技(2020年3期)2020-05-11
名作欣赏·学术版(2020年2期)2020-02-28
参花·青春文学(2019年10期)2019-09-10
人民周刊(2018年21期)2018-12-24
魅力中国(2018年2期)2018-07-24
杂文选刊(2018年2期)2018-02-08
领导文萃(2018年1期)2018-01-27
传奇故事(上旬)(2017年7期)2017-07-20
东方女性(2017年6期)2017-06-16