
Network analysis and spatial agglomeration of China’s high-speed rail: A dual network approach*
2021-01-21 02:09WeiWang王微WenBoDu杜文博WeiHanLi李威翰LuCarolTong佟路andJiaoWang王姣娥
Chinese Physics B 2021年1期
关键词:王微
Wei Wang(王微), Wen-Bo Du(杜文博), Wei-Han Li(李威翰),Lu(Carol)Tong(佟路), and Jiao-E Wang(王姣娥)
1School of Electronic and Information Engineering,Beihang University,Beijing 100191,China
2National Engineering Laboratory for Big Data Application Technologies for Comprehensive Traffic,Beijing 100191,China
3School of Cyber Science and Technology,Beihang University,Beijing 100191,China
4Research Institute of Frontier Science,Beihang University,Beijing 100191,China
5Institute of Geographic Sciences and Natural Resources Research,Chinese Academy of Sciences,Beijing 100101,China
6College of Resources and Environment,University of Chinese Academy of Sciences,Beijing 100049,China
Keywords: China’s high-speed rail,dual network,network analysis,urban agglomeration
1. Introduction
High-speed railways(HSR)were first introduced in Japan in 1964 and have brought about a dramatic shrinkage of time and space in intercity travel. They have also become an important means for accelerating the pace of urbanization.[1,2]The HSR have been constructed and rapidly expanded in many other nations due to their high speed,punctuality,and low carbon emissions. Some examples include TGV in France, ICE in Germany,and AVE in Spain.[3]China first introduced HSR trains into operation between Shenyang and Qinhuangdao in 2003 due to an increased demand for transportation and rapid technological development. China’s high-speed rail (CHSR)has developed at an unprecedented speed despite entering late into the transportation market. This development has been accelerated since 2008 when a newly built HSR line (Beijing–Tianjin)came into operation.[4]The total length of CHSR had reached 2.5×10⁴kilometers by the end of 2017, accounting for 66% of the world’s HSR, or twice the total of all other countries.[5]Since 2012, the CHSR has had the capacity to cover the spatial equivalent of 74%of China’s population and 82%of its GDP within 2.0 hours.[6]Therefore,the CHSR has shown strong growth in terms of construction scale and economic effects,and plays an important role in transferring people and goods. In the future,the CHSR will be more likely to bring greater effects not only in the transportation market but also in the reconstruction of regional economic landscapes.The CHSR will have been expanded to 3.0×10⁴kilometers by 2020 according to the“Medium-and Long-Term Railway Plan”(MLTRP)approved by the Chinese State Council.It will reach all provincial capitals and 80% of large and mediumsized cities[7]covering more than 90%of China’s population.Moreover, the planned “eight vertical and eight horizontal”corridors along with their branches will broaden and connect regional intercity networks.
Network science emerged following the work of Watts and Strogatz (WS)[8]as well as Barab´asi and Albert (BA).[9]The science has gradually become advantageous in the analysis of many real-world complex systems,[10–13]especially transportation systems.[14–20]The HSR is an important component of national transportation infrastructure and has been widely investigated by using complex network theory over the past few decades. Many researchers have constructed a variety of single-layer network models (e.g., space L,[21]space P,[22]space G[23])to study the characteristics of HSR,such as its structural evolution,[24]spatial accessibility,[25]structural vulnerability,[26]regional specialization,[27]and competition with air transport networks.[28]Indeed,different network models respond to different properties, and an ideal model must be chosen to achieve research goals. Previous research can provide a valuable insight into HSR.However,different HSR network layers are studied separately,which makes it difficult to understand the system as a whole. Moreover, few studies to date have made a comparison of topology and dynamics among these different network models in the same HSR system and have indicated the underlying mechanism of similarity and uniqueness among them. These network models can be classified as two types:the physical network(PN)and logical network(LN).[29]The PN represents the physical network of basic infrastructure in the high-speed railway system (i.e.,the geographical layout of rail tracks across a territory).[30–32]The LN denotes a virtual network of space flows,[33–35]representing the interactive relationships among different nodes such as vehicle movement, passenger travel, and delivery of goods. These two networks perform different functions, yet they are closely linked with each other. The physical network is the backbone for supporting the normal operation of the logical network. Moreover, the configuration of spatial flows in the logical network affects the function of facilities in the physical network. Thus, it is important to study layered networks to provide a comprehensive view of CHSR and support for decision-making concerning optimization of the layout of facilities and adjustment of train operations. Moreover,it is necessary to combine the development of HSR with regional integration,which has been one of China’s major policy objectives. The HSR network acts as a catalyst for restructuring the regional economy.[36]Furthermore,spatial development strategies are known to affect the development of HSR networks.[37]The Chinese government continues to rapidly expand HSR networks[7]and has emphasized spatial development strategies centered around urban agglomerations.[38]This leaves us with several questions.(i)Will the investment in this extremely powerful means of transportation exert greater influence on regions? (ii)Will the planned urban agglomerations affect the spatial distribution of traffic flows in the HSR network? These questions have rarely been addressed. In this paper, we first evaluate the properties of CHSR’s structure through comparative analysis of a dual network (i.e., a physical network and a logical network). Next,we assess the relationship between the CHSR development and the strategic plan of urban agglomerations. Additionally,some specific nodes and connections are examined which play an important role in maintaining the high-efficiency operation of CHSR and in promoting spatial development.
The rest of the article is divided into the following sections. In Section 2,we introduce the data source and network construction. In Section 3,we presents a comparative analysis of the dual network in CHSR.In Section 4,we explore the spatial interaction pattern and catchment areas of regions through these two networks. In the final section, we draw some conclusions from the present study and provide an insight into the direction of future research.
2. Data source and network construction
In this study, the HSR is defined as newly built railway lines with a design speed of over 250 kph,and upgraded railway lines with a design speed of over 160 kph. The HSR lines include the railway lines with G,C,and D prefix trains.[1]The data source for this study is the Chinese Railway passenger train schedules on May 17-th, 2017 provided by the China Railway Corporation. There are approximately 773 HSR stations in total and 4145 trains in daily operation. The basic characteristics for each type of train is shown in Table 1.

Table 1. Basic characteristics and classification of trains.
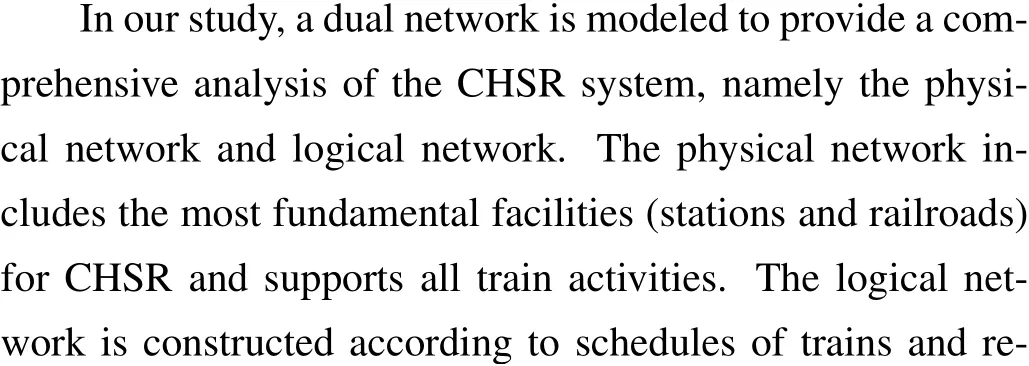

Fig. 1. (a) Dual network in China’s high-speed railway, with upper layer being logical network (LN), and lower layer being physical network (PN),different colors representing different trains in LN and their actual operation routes in PN,respectively. (b)Example of“G1”from Beijing to Shanghai further illustrating relationship between these two networks.
3. Comparative analysis between logical network(LN)and physical network(PN)
In this section, complex network theory is used to comparatively analyze the topological structure and traffic dynamics of logical and physical networks.The degree,degree correlation,clustering coefficient,path length,edge weight,and nodal strength are chosen to reveal CHSR characteristics,which represent the parameters commonly used in transportation networks.[14,39]The definitions of these parameters are displayed in Table 2.
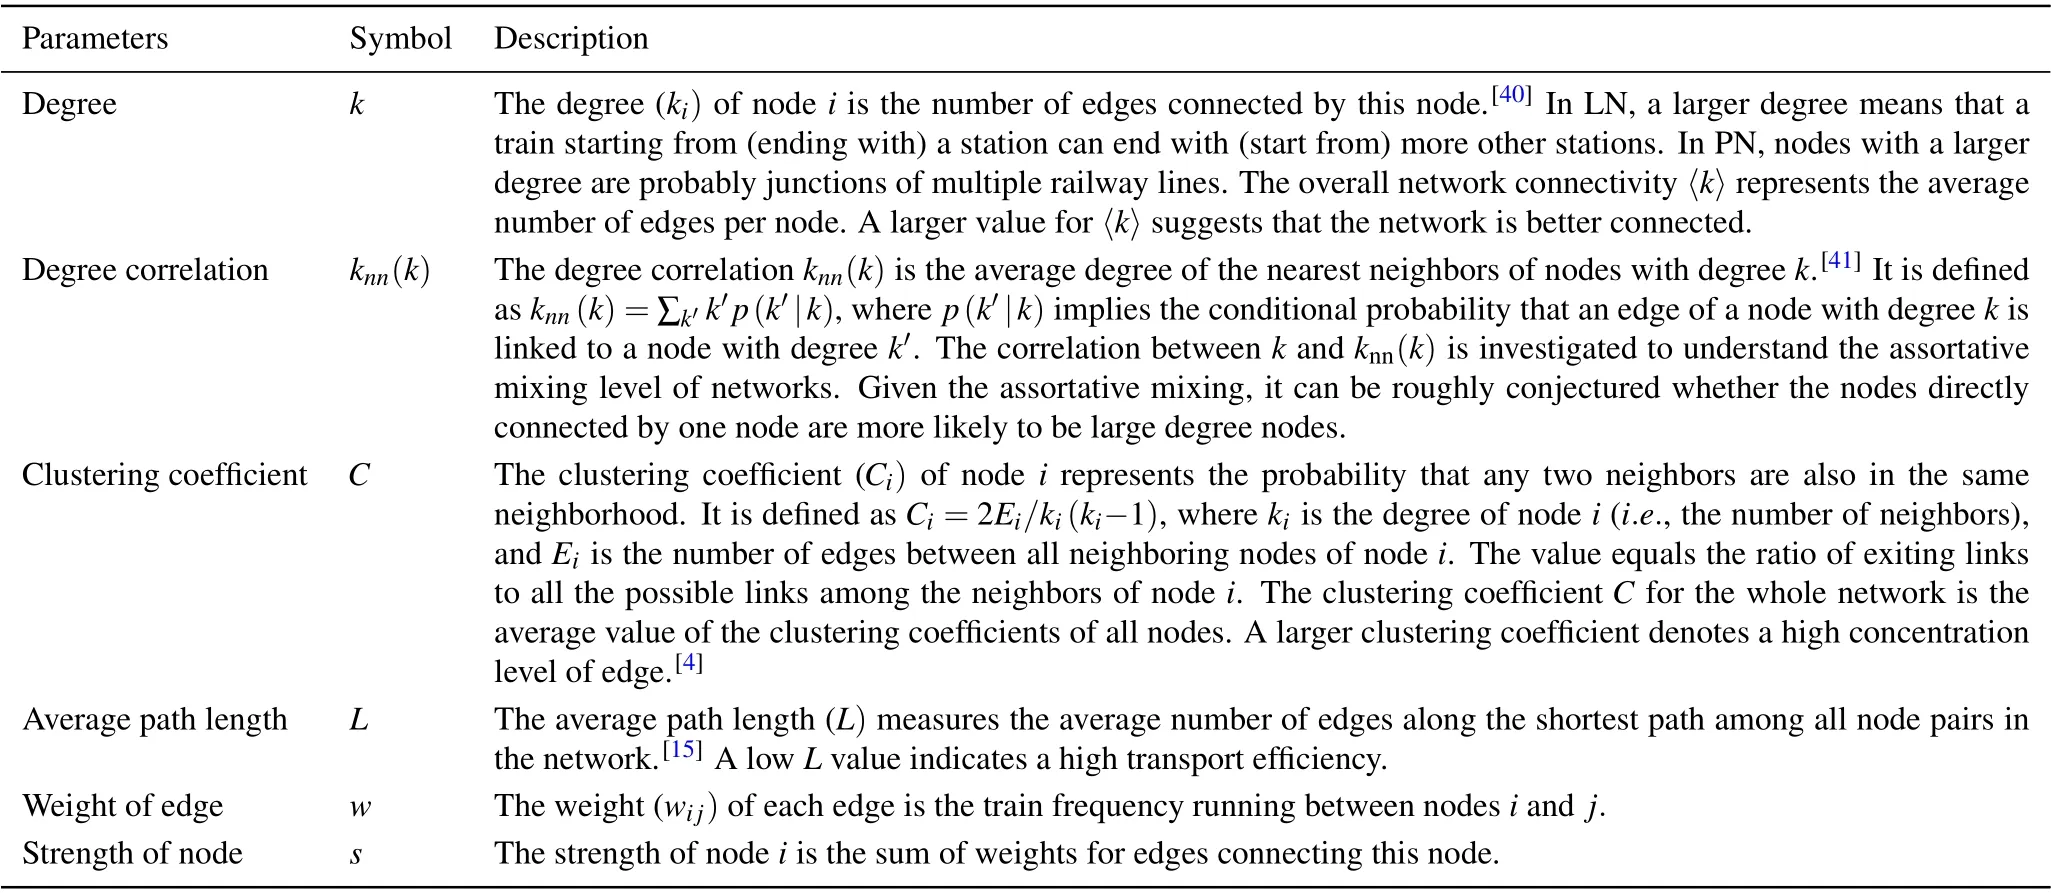
Table 2. Definitions of parameters.
A geographical representation of CHSR is given in Fig.2.The transportation activity is mainly concentrated in Eastern China (based on the layout of the logical and physical networks), but the topological structure and traffic dynamics of these two networks appear to differ from each other.In the logical network,the interactive strength between cities is largely related to socio-economic attributes as compared with the geographical proximity in the physical network. Subsections 3.1 and 3.2 present a detailed comparative analysis from the perspective of both topology and traffic dynamics.
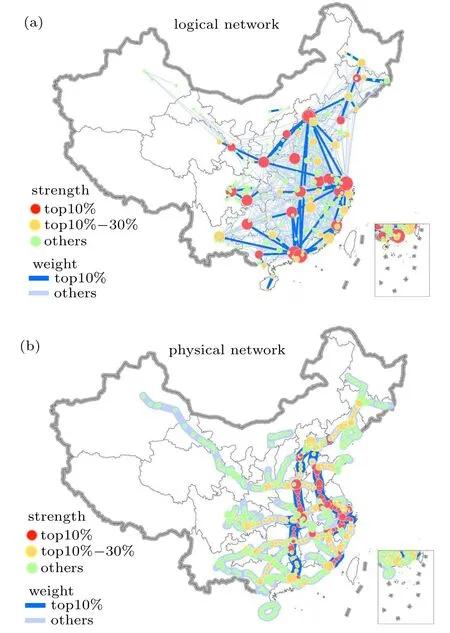
Fig. 2. Geographical representation of CHSR for [(a) and (b)] logical network (LN) and physical network (PN), with each node size being proportional to degree, three node colors representing three levels according to nodal strength, and width and color of edge being proportional to edge weight.
3.1. Topological structure
Table 3 displays the basic topological properties of the logical and physical networks. There are 269 nodes and 868 edges in the logical network.The average degree is〈k〉=6.45.For the physical network,there are nearly the same number of edges,but the number of nodes is nearly three times larger than in the logical network.The average degree is about〈k〉=2.11,indicating that the physical network is sparser than the logical network. The degree values for the top three stations(Shanghai Hongqiao,Shenzhen North,and Beijing South)in the logical network are 72,45,and 43,respectively.The largest degree value is only 7(Zhengzhou East and Hankou)in the physical network. Furthermore, the location of stations with high degree values are highly variable. In the logical network, these stations are in China’s economically developed areas and serve as the starting and ending sites of corridors. The stations are in the geometric center or are the junctions between horizontal and vertical train lines in the physical network. The average cluster coefficient for the logical network is 0.37 and the average path length is 3.These values are 0.02 and 32 for the physical network, respectively. The larger cluster coefficient and the lower average path length for the logical network demonstrate that this type of network resembles a“small-world”configuration.
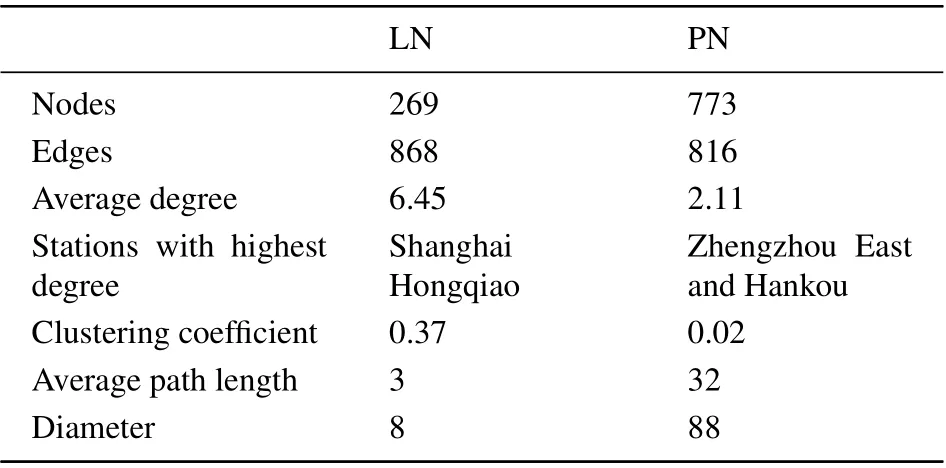
Table 3.Basic topological properties of logical network(LN)and physical network(PN).
Several detailed topological properties for the logical and physical networks are described in Fig. 3. This topological analysis further confirms that the logical network tends to be a “small-world” network while the physical network resembles a latticed network. Figures 3(a)and 3(b)display the cumulative degree distribution of these two networks. The cumulative degree distribution for the logical network follows the two-regime power-law (e.g., P(X ≥k)∝k-0.87for small degrees and P(X ≥k)∝k-2.89for large degrees). Interestingly, a similar finding has been made for the Chinese Airport Network,[42,42–44]which may result from relevant economic and geographical factors. In the physical network,75% of stations have a degree value of 2 and the largest degree value is 7,indicating a high homogeneity. Moreover,the logical network features a negative degree-degree correlation(Fig. 3(c)). Conversely, knnis always close to 2 for all degree values in the physical network(Fig.3(d)). Thus,the stations in the logical network with lower degree values tend to be connected with stations with larger degree values. However, the connections among stations in the physical network do not show such a tendency due to the limitation of transportation facilities. Figures 3(e) and 3(f) display the degreeclustering coefficient relationship for the logical network and physical network. The logical network is observed to have an apparent negative degree-clustering coefficient correlation while the clustering coefficient for the physical network is always close to 0 and irrelevant to nodal degree k. The stations with a large degree in the logical network are able to meet most of the transportation demands and could connect more stations with a low degree which have weak connections. This results in low clustering coefficients for stations with large degree values. There are almost no triangular physical connections among stations in the physical network,which results in a zero value for the clustering coefficient. Since the stations with large degree values form a hub-and-spoke structure with their neighbors, all neighbors always interact with each other via these hubs.Thus,no direct connection exists between their neighbors. Additionally,the path length distribution is investigated in these two networks. In the logical network,over 90%of station pairs were covered with a maximum of 4 connections and the diameter is 8 (Fig. 3(g)). The peak path length reaches about 30 and the diameter is 88 in the physical network(Fig.3(h)).

Fig. 3. Comparison of certain topological properties of LN and PN. [(a) and (b)] Accumulative degree distribution of LN and degree distribution of PN.[(c)and(d)]Degree–degree correlation of LN and PN,with fitting functions being knn=-0.08k+21.42 and knn=2.69,respectively. [(e)and(f)]Degree-clustering coefficient correlation of LN and PN,with fitting functions being C=-0.007k+0.488 and C=0.016,respectively). [(g)and(h)]Shortest path distribution of LN and PN.
In short,the topological properties of CHSR show that the logical network resembles a small-world network with a tworegime power-law degree distribution, and maintains a negative degree-clustering coefficient correlation. Moreover, the physical network resembles a regular lattice network since the construction of facilities is restrained by geographical barriers.
3.2. Traffic properties
In this section explored is the spatial configuration of traffic for different CHSR network layers (i.e., the logical and physical networks). Train traffic is inserted into the topological structure, and edges and nodes are weighted according to the frequency of trains. The weighted parameters for edges (weight wij) and nodes (strength si) are listed in Table 2. Larger wij(si) values represent a heavier traffic load in the edge(node). In Fig.2(a),the top 30%of nodes with the highest strength(marked by red and yellow)are the stations in the provincial capitals and Tier 1 cities.It is not surprising that most of the trains start from and end in those cities that play a socio-economic role in China, which results in heavy traffic. The edges with higher weight constitute a radial structure in which the influences of national socio-economic centers(e.g., Beijing, Shanghai, and Guangzhou) radiate out to the surrounding regional centers. The traffic is less relative to urban economies,in the physical network but is strongly affected by geographic location (Fig. 2(b)). Nodes and edges with high traffic flows are spread along the Beijing–Guangzhou high-speed railway and Beijing–Shanghai high-speed railway.These two railways are the busiest railway lines for passengers. The remaining four-vertical and four-horizontal lines are the second busiest, followed by the regional branch railway lines.
Figure 4 describes several traffic properties of these two networks. The degree-strength relation of the logical network and the physical network are shown in Figs.4(a)and 4(b),respectively.They both present positive relation,which suggests that the stations with large degree values tend to play a more important role in maintaining the train flow of the overall network. Figures 4(c) and 4(d) display the relation between the distance and the weight of edges. In the logical network, the spatial distances of most edges are centered around 600 km,but the average flow of edges shows a slight difference when the spatial distance changes. This indicates that the distance is not a main factor that influences the schedule arrangement for trains. In fact, the edges with high weight values (more than 20)have various kinds of spatial distances(long or short)partly because economic activity is less likely to be influenced by the distance. In the physical network,the spatial distances of most edges are less than 50 km due to the geographical proximity of actual facilities. Moreover,less traffic and more decentralized facilities in Western China cause the edges to have a spatial distance of over 200 km, with little train flow sustained.
Consequently, the logical network shows “developedcity pair effect” for traffic properties, while “corridor effect”is highlighted in the physical network. This indicates that developed-city pair is the main body for generating large traffic demand and the real traffic flow is mainly distributed along the HSR corridor, especially along the Beijing–Guangzhou line and Beijing–Shanghai line.

Fig. 4. Plots of degree–strength correlation for (a) logical network (LN), (b) physical network (PN), and distance-weight correlation for (c) logical network(LN)and(d)physical network(PN).
4. Spatial attributes of urban agglomeration
The high-speed transportation associated with CHSR dramatically transcends the geographic barriers of commuting between cities[28,36]and can lead the economic activities to be redistributed among local regions.[2,45]This can generate new communities where economic activities are relatively concentrated.The widely-used fast-Newman algorithm[46]is adopted to analyze CHSR’s community structure. The logical network reflects the flows of transport demand for cities, while connections in the physical network are restricted by geography,which makes it difficult to reflect this demand. This algorithm is naturally applied to the logical network to extract the groups of closely connected cities, which are nevertheless tenuously connected with other groups. Twelve communities are detected by using this algorithm. The rapid development of HSR has significantly facilitated market integration.[47]Also,urban spatial strategy has affected the spatial organization of communities. Figure 5(a)displays the geographical distribution of the communities. The two isolated communities (marked as gray)located in Hainan Province and Inner Mongolia are not taken into consideration.Ten urban agglomerations(Fig.5(b))are the primary bodies in the National New-Type Urbanization Plan (2014–2020)[38]and are given priority to be developed and optimized in the 13rd Five-Year Plan.[48]The communities extracted from CHSR feature an“agglomeration effect” for geographically neighboring nodes and share a similar shape with urban agglomerations. This confirms that the CHSR plays a significant role in intercity transportation for certain hinterland spaces.[47]One or more stations are selected as hubs in their own community if the number of stations they connect outside the communities is the highest number or close to the maximum value(but it differs from the maximum value by not more than 5). The hub stations usually perform the function connecting stations outside the community. Communities are named after the cities where the hub stations are located.
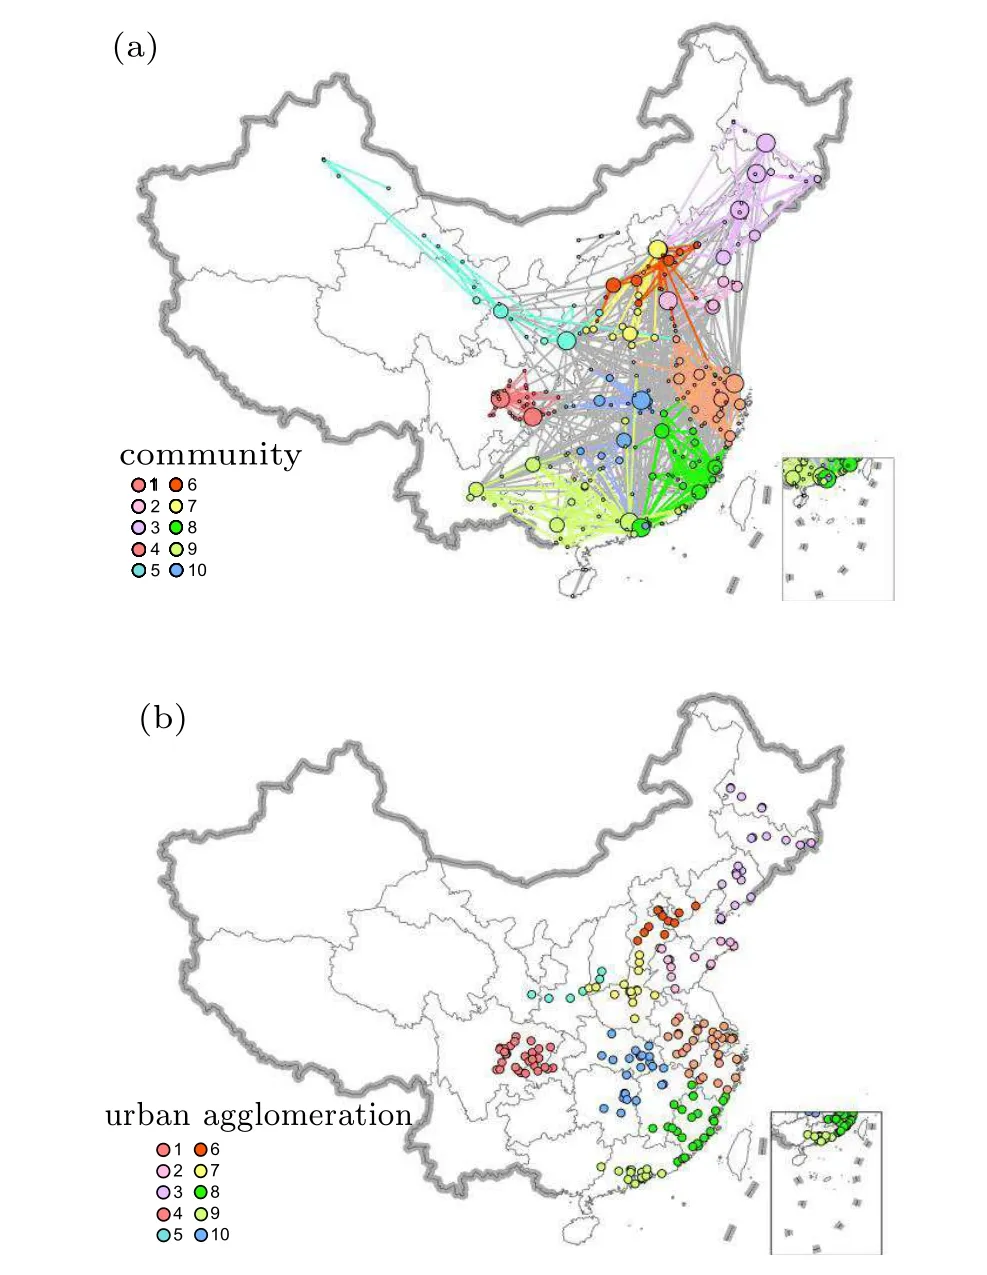
Fig.5. (a)CHSR communities based on LN.Each color represents a community. Among the communities,edges are marked by gray. The size of the nodes inside one community is proportional to the number of nodes outside the community they connect with.The larger the size of a node,the more important role it plays in connecting nodes inside the community with nodes outside of the community. (b) Planned urban agglomerations identified in the 13rd Five-Year Plan.
Table 4 displays the communities and their corresponding urban agglomerations. Some differences can be observed by comparing the identified hub cities with planned hub cities,although there is high coupling between them. For example,Beijing–Tianjin–Hebei has two hub cities (Beijing and Tianjin),while the Beijing community for CHSR has only one hub city(Beijing). It is suggested that Beijing–Tianjin–Hebei has a“dual-nuclei”structure,where Beijing plays a dominant role in high-speed railway transportation. Moreover, Beijing and Shenzhen have a stronger attraction than the planned hub in Central Plain and Western Taiwan Straits urban agglomerations. Table 5 displays the affiliation between urban agglomerations and CHSR communities. Half of the urban agglomerations can be included in only one community, while the other half is distributed in multiple communities. The former include Yangtze River Delta, Northeast Region, Chengdu–Chongqing,Guanzhong Plain,and Central Plain. This can be attributed to differences in the regional economy, geographic location, and administrative divisions. For example, Yangtze River Delta features highly developed economic areas that are equipped with an integrated transit system. Northeast Region and Chengdu–Chongqing are extremely remote and relatively independent.Guanzhong Plain and Central Plain cover a small area where inner cities are highly interdependent. Thus, it is not surprising that they are the most aggregated urban agglomerations as all nodes are included in one community.The latter are mainly located along China’s eastern coast. It is convenient for local inhabitants to travel to different cities and be engaged in additional economic activity due to improvements in infrastructure, which blurs the boundaries between urban agglomerations.
The results of the CHSR community structure reflects the current association among cities from the perspective of railway transportation. The similarities and differences between communities and urban agglomerations indicate an optimistic prospect for improving transportation and providing a wider range of travel choices for local inhabitants. It is a better means for developing high-speed train transportation into a carrier for optimizing the current spatial pattern of information exchange among cities. Also,additional measures should be taken to achieve beneficial results for both high-speed transportation and regional economies,such as the optimization of train systems,multimodal transport,and spatial resource allocation.
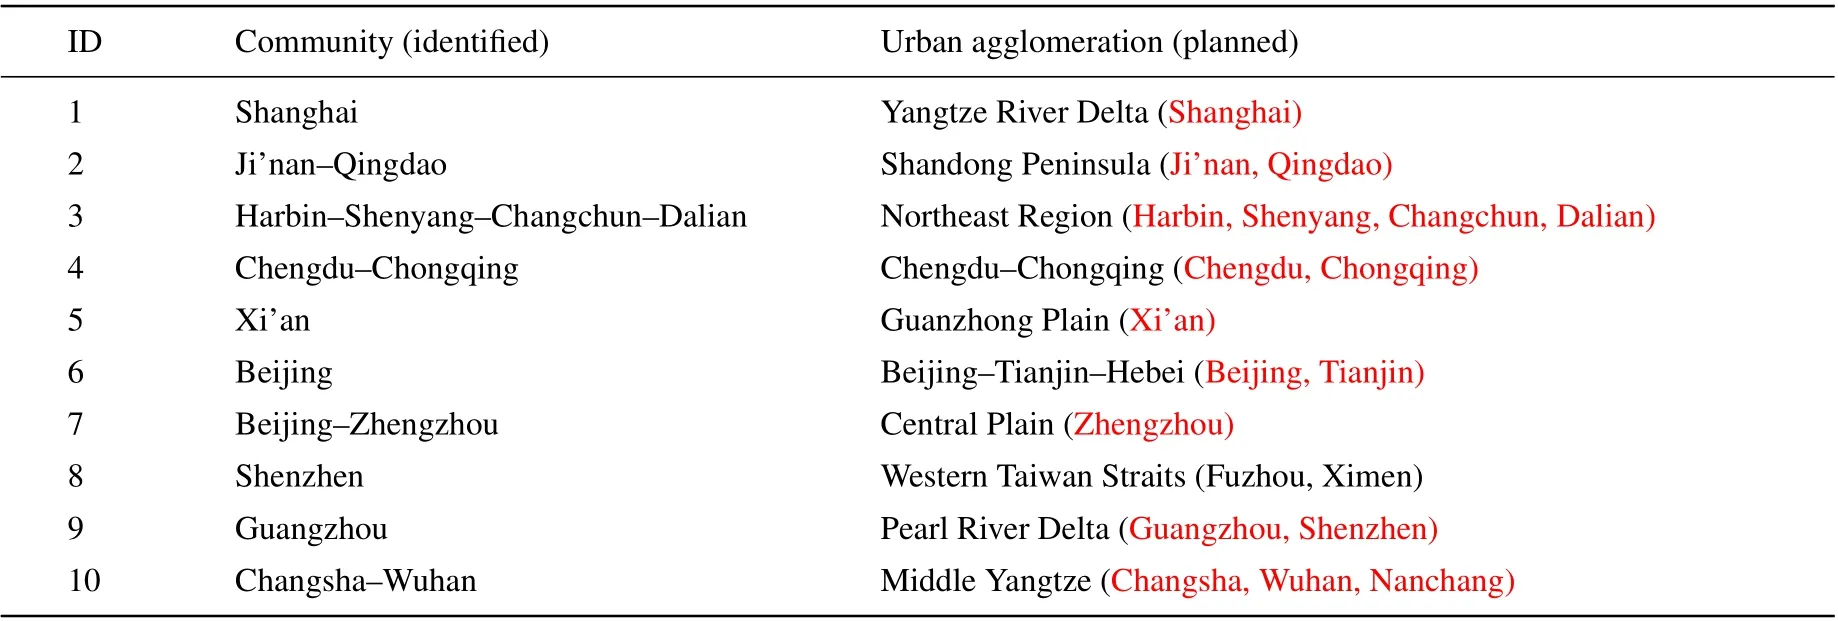
Table 4. CHSR communities and their corresponding urban agglomerations.
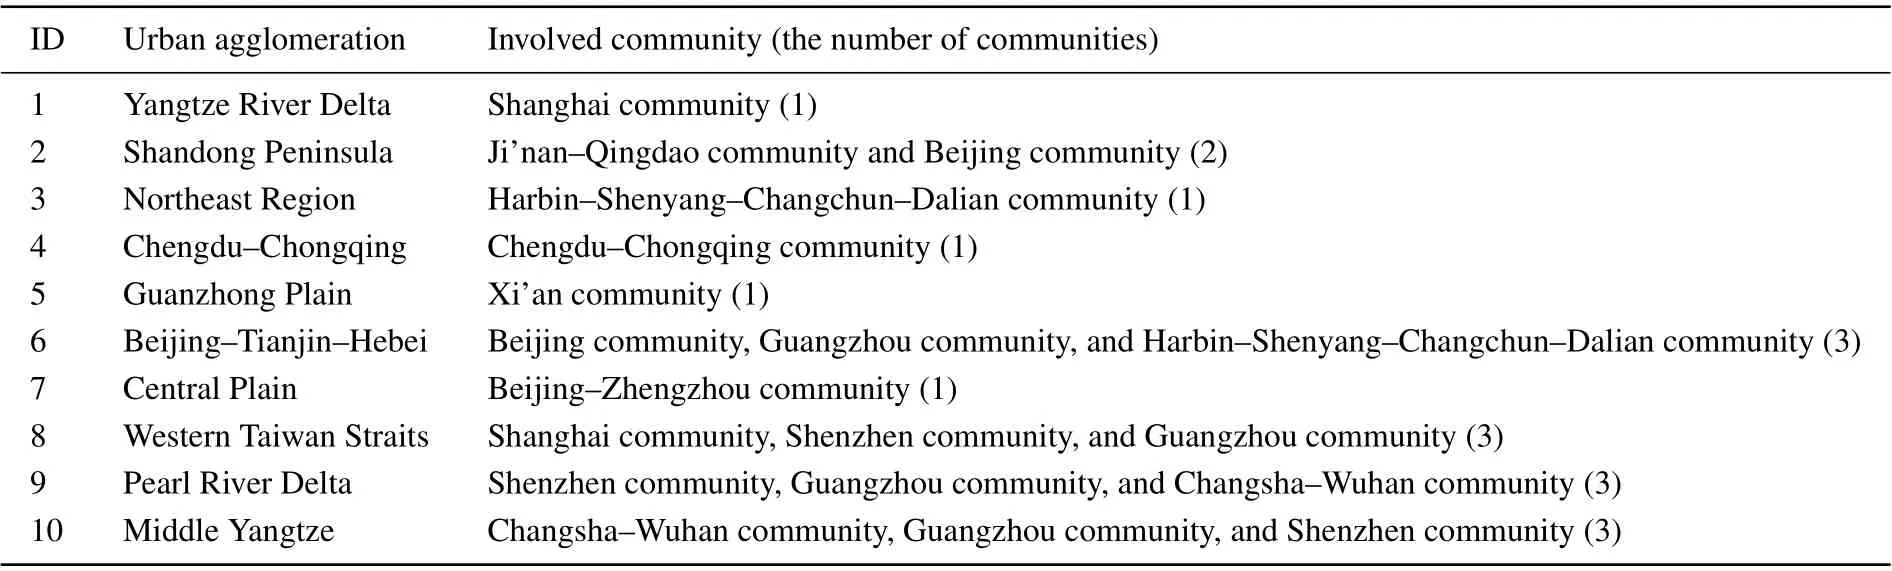
Table 5. Affiliation between urban agglomerations and communities.
4.1. Spatial interactions among urban agglomerations
In this part, urban agglomerations are regarded as nodes to focus on the correlations among urban agglomerations. As shown in Fig. 6, there were 10 nodes (i.e., the 10 urban agglomerations mentioned above)and 42 edges. All node pairs are almost directly connected except for Chengdu–Chongqing– Guanzhong Plain, Chengdu–Chongqing – Northeast, and Northeast – Pearl River Delta. The high-speed railway between Chengdu–Chongqing and Guanzhong Plain was not opened until late 2017. The long distance of Chengdu–Chongqing –Northeast (2037.20 km) and Northeast –Pearl River Delta (2323.70 km) made them temporarily inaccessible during the specified time period. Nodes are categorized into three levels according to internal strength (marked by node color). Yangtze River Delta and Pearl River Delta are classified as the first level (internal strength >300, see Table 6). Beijing–Tianjin–Hebei, Middle Yangtze, Chengdu–Chongqing, and Northeast Region were classified as the second level (100 <internal strength <300), and the other urban agglomerations are placed in the third level. Beijing–Tianjin–Hebei features a less developed HSR network than both Yangtze River Delta and Pearl River Delta despite their similar socio-economic roles. Thus, it is not surprising that the regional integration in Beijing–Tianjin–Hebei is not so great as in Yangtze River Delta or Pearl River Delta. Furthermore, Middle Yangtze, Chengdu–Chongqing, and Northeast Region have greater advantages in regional interactions.For external strength (marked by node size), the hierarchy of urban agglomerations seems inconsistent with internal strength. Yangtze River Delta remains in a dominant position (external strength>500), but both Pearl River Delta and Beijing–Tianjin–Hebei are in the second level(400 <external strength <500). The longer average distances (1113.76 km and 1422.04 km in Table 6) to other urban agglomerations made them less inter-regionally attractive than Yangtze River Delta. Moreover, the levels of external strength in Chengdu–Chongqing and Northeast Region are very low in contrast to that of their internal strength, indicating their weak connections with the rest of the country. It is difficult for railways to connect Chengdu–Chongqing with other areas in China since the area is in Sichuan Basin with Qinling Mountains in the north and Yunnan–Guizhou Plateau in the south. Northeast Region solely depends on the Beijing–Shenyang railway line to connect with other regions, so passengers must transfer in Beijing if they head for other destinations, leading to its poor external correlations with other areas. Thus, this region is closely connected with Beijing–Tianjin–Hebei while weakly connected to other urban agglomerations. The busiest three connections among communities resemble a “Z” shape and include Beijing–Tianjin–Hebei – Yangtze River Delta,Middle Yangtze–Yangtze River Delta, and Middle Yangtze– Pearl River Delta. Beijing–Tianjin–Hebei and Yangtze River Delta are the two most highly developed economic zones in China. More than 100 million passengers each year take bullet trains along the Beijing–Shanghai rail corridor.Middle Yangtze serves as the junction for the north–south rail corridor (Beijing–Guangzhou) and two east–west rail corridors (Shanghai–Chengdu and Shanghai–Kunming). It acts as a bridge between two highly developed economic zones(Yangtze River Delta and Pearl River Delta) and the rest of China. This enables the rich human resources to be delivered from Yangtze River Delta and Pearl River Delta to the other areas in China,such as West China.
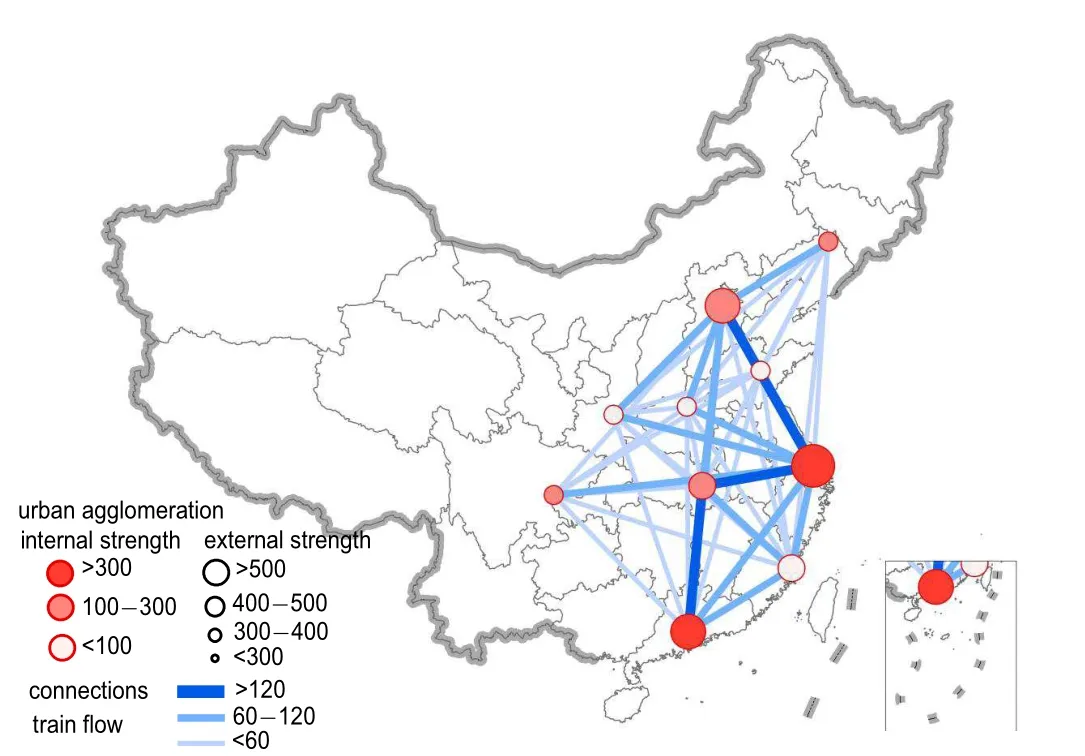
Fig.6.Relations among urban agglomerations in the logical network.Urban agglomerations are regarded as nodes. Edges between two urban agglomerations in the logical network are merged into one. The color of one node is related to train frequency inside this urban agglomeration. The size of one node is based on the train frequency outside this urban agglomeration.Edges are colored according to the train frequency between two urban agglomerations.
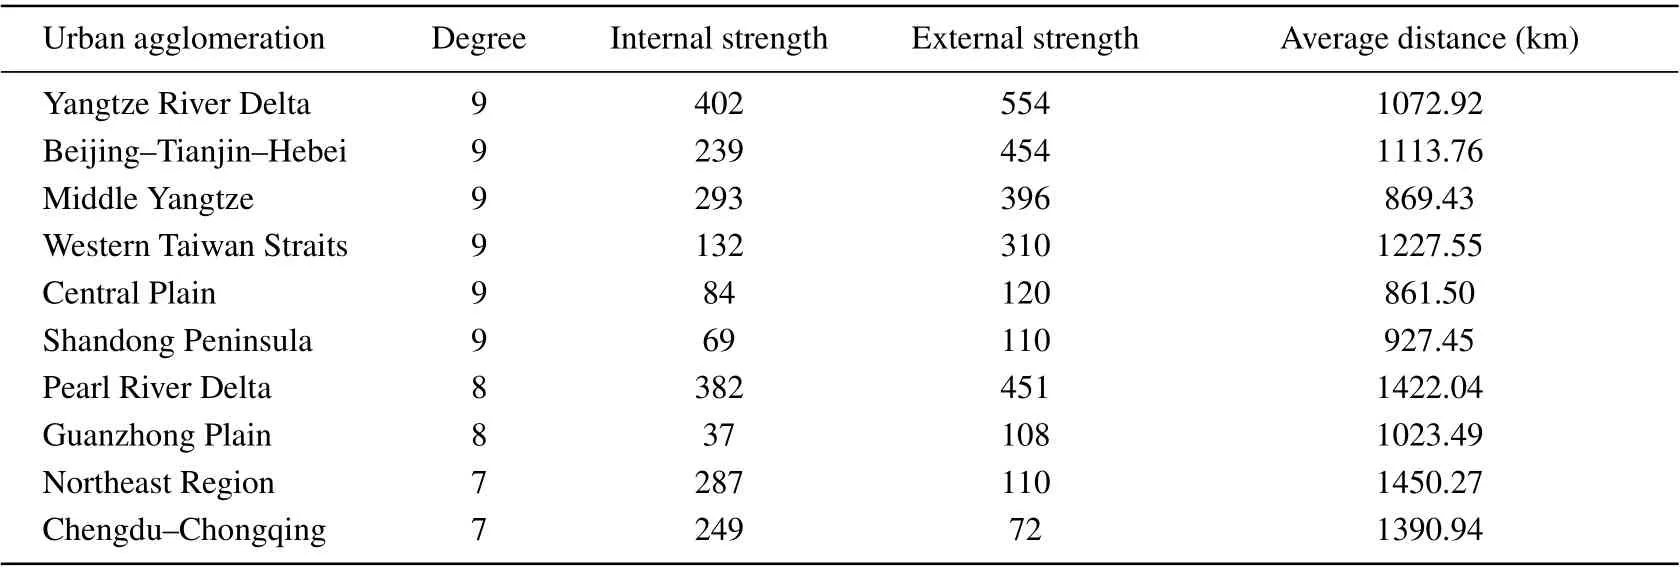
Table 6. Basic information about correlations among 10 urban agglomerations.
4.2. Catchment area of urban agglomeration
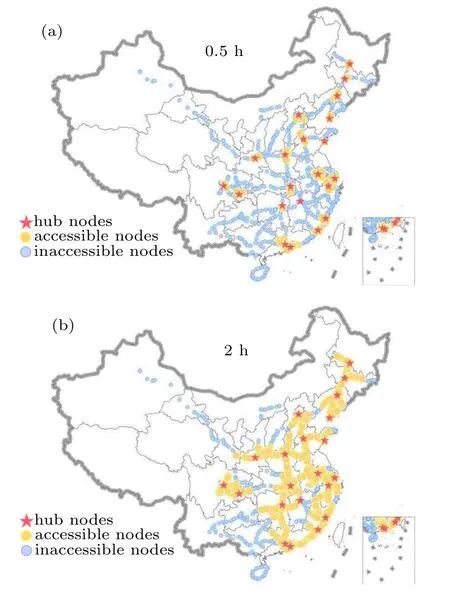
Fig.7. Catchment area for urban agglomerations within 0.5 h and 2 h.
Travel time has traditionally been a focus in studying transportation networks. A traffic circle of 0.5 h~2 h will be established in the future according to the “Med-and-longterm Railway Network Plan” published in 2016.[7]Here in this paper, the catchment areas within a two-hour train ride away from their hub stations are investigated based on the physical network. Figure 7 displays the spatial distribution of accessible stations that are within a half-hour and two-hour distance. Several stations near the hub stations are found to be accessible in catchment areas within half a hour. An increasing number of people choose to live in these areas and take high-speed trains to nearby megacities for employment so that they can enjoy social resources without suffering high housing prices and daily expenses in major cities.[47]It is found that 80%of stations on average(those areas within two hours)can be reached from hub stations inside an urban agglomeration. This indicates that people can enjoy convenient travel from hub cities to most cities in each urban agglomeration.
The Yangtze River Delta, one of the most developed urban agglomerations,is further analyzed to investigate temporal characteristics of catchment areas.Figure 8 displays the catchment area of the Yangtze River Delta that consists of nodes that are within a half-hour,one-hour,one-and-a-half-hour,and two-hour train ride away from hub stations. Three hub stations, i.e., Shanghai Hongqiao, Hangzhou East, and Nanjing South,are marked in three different colors as red,yellow,and green, respectively. If one station can be reached from one hub station within the required time,it is marked in the same color as the hub station. A station is marked as light blue if it is reached repeatedly from multiple hub stations. Figure 8 shows that the three hub stations play leading roles in different areas. Nanjing South ranges from Hefei in the west and Xuzhou to the north.Shanghai Hongqiao ranges from Nanjing in the north to Hangzhou in the south. Hangzhou East ranges from Nanjing in the north to Yiwu in the south.The catchment areas of three hub stations within one-hour distance have expanded rapidly from that within half an hour away, and these areas overlap slightly. Within 1.5-hours distance, a remarkable increase in number of trains is seen in the overlapping parts of three catchment areas and a slow rise in the remaining areas of them. A total of 89 stations can be reached from three hub stations within 2 hours, accounting for 96% of the total stations with a high overlapping for stations scattered along those railways that connect three hub stations. These hub stations have independent and overlapping service areas that provide optimal multi-center support for the Yangtze River Delta in railway transportation levels with limited resources.
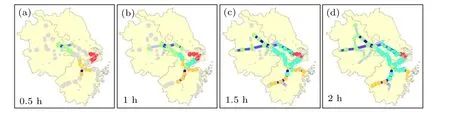
Fig.8. Catchment areas for Yangtze River Delta within 0.5 h,1 h,1.5 h,and 2 h. In the Yangtze River Delta,nodes with red,yellow,and green colors represent stations accessible within the required time from Hongqiao,Hangzhou East,and Nanjing South,respectively. Gray nodes refer to stations that are not accessible within the specified time. Light blue nodes refer to nodes that reach several hub stations.
To further understand the role of different stations, the traffic patterns of the Yangtze River Delta are explored at specific times under three station sets: stations in the physical network(i.e.,all stations),stations in the logical network(i.e.,starting and ending stations of trains), and hub stations. The outflow and inflow per hour are analyzed for each station in the urban agglomeration. The outflow refers to the number of departure trains and the inflow represents the number of arrival trains. Figure 9 displays the difference between inflow and outflow within 24 h under the three station sets. The gaps are basically the same although the three station sets have different numbers of stations and sustained different train flows(LN stations account for 33%of all stations and sustain about 50%of train flows; HUB stations account for only 3% of stations but sustain 20%of train flows). A morning peak of departure trains is observed from 5:00 to 10:00. An evening peak of arrival trains is observed from 18:00–24:00. A balanced period occurs during the rest of the day. This seems to indicate that there may be a huge gap in the difference between the inflow and outflow during the peak period,where the main contribution is made by stations in the logical network,especially the three hub stations. This further proves the importance of the three hub stations in the Yangtze River Delta. Figure 10 shows the spatial distribution of inflow and outflow in the Yangtze River Delta. The orange (blue) color denotes the percentage of departure(arrival)trains at 7:00,12:00,and 22:00 when net traffic flows reach their peak points and remain stable(Fig.9).

Fig. 9. Difference between inflow and outflow (i.e., net flow) within 24 h under three station sets,with“PN”referring to stations in physical network(i.e., all stations), “LN” denoting stations in logical network (included in PN), and “HUB” representing three hub stations mentioned above, that is,Shanghai Hongqiao,Hangzhou East,and Nanjing South.
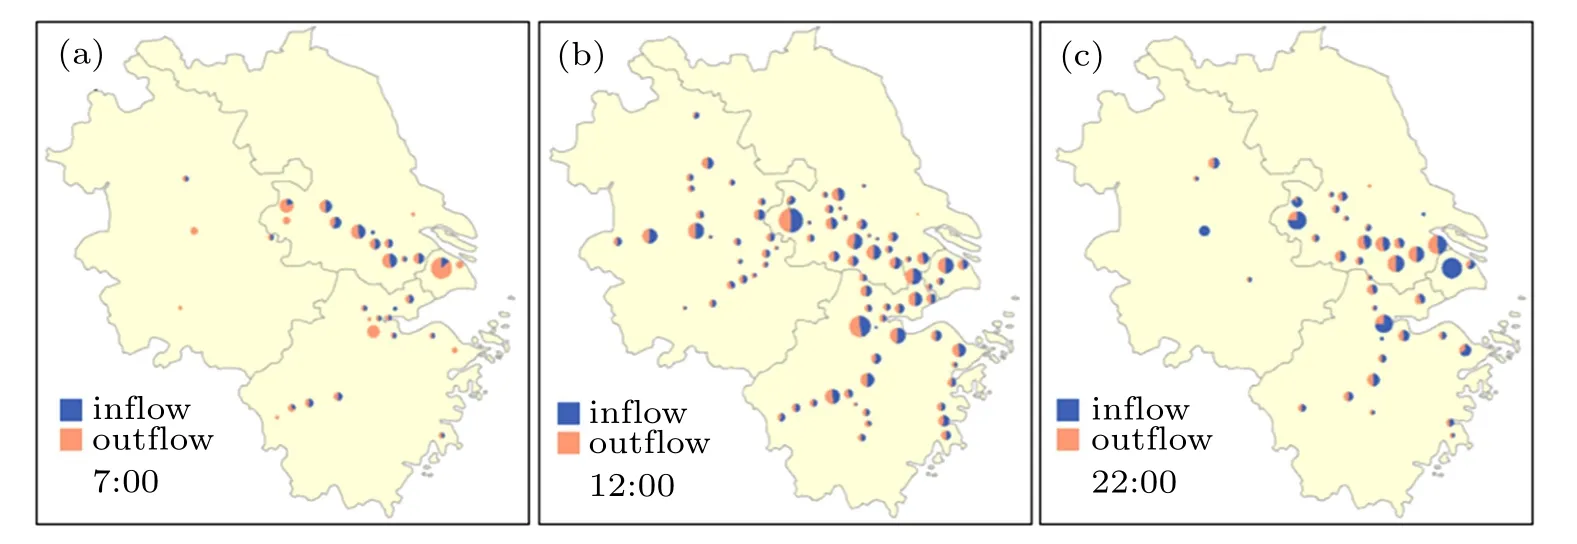
Fig. 10. Train flows of Yangtze River Delta at (a) 7:00, (b) 12:00, and (c) 22:00, with each node representing a station, node size being proportional to the sum of inflows and outflows, each node color referring to the ratio between inflow and outflow, and blue and orange representing inflows and outflow.,respectively.
At 7:00, the number of accessible stations is lower, and they are mainly distributed in the Shanghai–Nanjing railway line. The orange sectors of three hub stations, namely Shanghai Hongqiao, Nanjing South, and Hangzhou East, are much larger than the blue sectors. These results indicate that Shanghai–Nanjing is the busiest railway line at the beginning of the day, and the three hub stations are the main locations where trains are dispatched. The number of accessible stations increases at 12:00,and the orange sector is almost equal to the blue sector for each station. This suggests that more cities are accessible and a balance occurs between departure train and arrival train. The number of stations is notably lower at 22:00 and the three hub stations serve as the main location for incoming trains.
5. Conclusions
In this study, a dual network consisting of logical and physical networks is constructed to provide a comprehensive analysis of China’s high-speed railways. First, the comparison results show that both topological and traffic properties of these two networks are strikingly different. The logical network is a small-world network with a two-regime power-law degree distribution, while the physical network resembles a lattice network with a degree value of 2. Traffic in the logical network is strongly related to the economy and the population of cities, while the geographical proximity is a dominant factor for the physical network. Moreover, the community structure of China’s high-speed railways is studied based on the logical network and the phenomenon of urban agglomerations is examined. The high coupling between communities and planned urban agglomerations suggests that the highspeed railways play a crucial role in regional agglomeration and accelerate the development of the 13rd Five-Year Plan.Their differences reflect special development patterns, such as Beijing–Tianjin–Hebei, whose spatial development model is designed as a “dual-nuclei”. This model features a unipolar railway transportation mode with Beijing as the radiation center, leading other cities to be over-dependent on Beijing.Moreover, the study of catchment areas in the physical network shows that more than 80% of stations can be reached within 2 hours from hub stations in one urban agglomeration,indicating a high transportation efficiency for passengers. A detailed analysis of the Yangtze River Delta reveals that different hub stations can act as transportation centers in different districts and they seem to have a spatial division. Furthermore, the traffic dynamic phenomenon is also examined, and hub stations prove to be major contributors to generating and accommodating train flows.
This study helps to give a better understanding of the Chinese railway system and the relevant urban construction. It may be inspiring in terms of railway planning and can conduce to choosing a site for a new station or optimizing train schedules. Finally, it is important to integrate markets with multimodal transport and to conduct further studies from this perspective since different means of transportation dominate different markets.
猜你喜欢
动漫界·幼教365(中班)(2022年3期)2022-03-11
动漫界·幼教365(中班)(2022年3期)2022-03-11
动漫界·幼教365(中班)(2021年4期)2021-05-23
动漫界·幼教365(中班)(2021年4期)2021-05-23
动漫界·幼教365(中班)(2021年2期)2021-04-06
动漫界·幼教365(中班)(2021年3期)2021-04-06
动漫界·幼教365(中班)(2021年3期)2021-04-06
动漫界·幼教365(中班)(2020年8期)2020-06-29
江西社会科学(2019年12期)2020-01-11
财经(2019年10期)2019-05-19
- Chinese Physics B的其它文章
- Two-dimensional finite element mesh generation algorithm for electromagnetic field calculation*
- Stable water droplets on composite structures formed by embedded water into fully hydroxylated β-cristobalite silica*
- Surface active agents stabilize nanodroplets and enhance haze formation*
- Synchronization mechanism of clapping rhythms in mutual interacting individuals*
- Theoretical study of the hyperfine interaction constants,Land´e g-factors,and electric quadrupole moments for the low-lying states of the 61Niq+(q=11,12,14,and 15)ions*
- Ultrafast photoionization of ions and molecules by orthogonally polarized intense laser pulses: Effects of the time delay*