
Spatio-temporal evolution characteristics and pattern formation of a gas–liquid interfacial AC current argon discharge plasma with a deionized water electrode
2021-02-27 09:16HafizImranAhmadQAZIMuhammadAjmalKHANandJianjunHUANG黄建军
Plasma Science and Technology 2021年2期
关键词:建军
Hafiz Imran Ahmad QAZI, Muhammad Ajmal KHAN and Jianjun HUANG (黄建军)
1 SZU-CASIPP Joint Laboratory for Applied Plasma, College of Physics and Optoelectronic Engineering,Shenzhen University, Shenzhen 518060, People’s Republic of China
2 Department of Engineering Physics, Tsinghua University, Beijing 100084, People’s Republic of China
Abstract A discharge ignited by an AC power source in contact with deionized water as one of the electrodes is investigated.Immediately after initiation, the discharge exhibits a unique phenomenon: the gasphase discharge is extended into the liquid.Later, a cone-like structure is observed at the liquid surface.Synchronous monitoring of current–voltage characteristics and liquid properties versus time suggests that the discharge shapes are functions of the liquid properties.The spatio-temporal profiles indicate the potential effects of water,ambient air impurities,and metastable argon on the discharge chemistry.This becomes more obvious near the liquid surface due to increasing production of various transient reactive species such as·OH and NO·.Moreover,it is revealed that thermalization of the rotational population distributions of the rotational states in the Q1 branch of the OH band ro-vibrational system is influenced by the humid environment near the liquid surface.In addition,the transient behaviors of instantaneous concentrations of long-lived reactive species(LRS)such as are observed with lengthening the discharge time.The production of multiple transient and LRS proposes AC excited gas–liquid argon discharge as a potential applicant in industrial wastewater cleaning, clinical medicine, and agriculture.
Keywords: gas–liquid interface, discharge emission patterns, rotational temperature, plasma chemistry
1.Introduction
Electrical discharges at liquid surfaces have attracted considerable attention among engineering and scientific societies in recent decades due to their simple setup, low operating cost, and dynamic species generation.They have eventually become involved in promising technological applications such as wastewater cleaning, clinical medicine, agriculture,nanomaterial synthesis, and analytical techniques [1–7].Atmospheric gas-phase discharges can be operated with a large gap spacing over the liquid electrolyte surface.Various self-organized emission patterns have also been formed using an electrolyte anode [8–12].The formation of discharge emission patterns over the liquid surface is a crucial phenomenon that must be studied in order to explore the discharge operating mechanisms that are relevant when the liquid is an electrode.It is believed that the liquid electrode surface plays a critical role in discharge generation.The gas temperature (Tg) is an essential parameter as it reflects the internal kinetics in the plasma (discharge).Because of their high rotational-relaxation rates,the rotational temperature(Tr)of the plasma species is considered a good estimate of the plasmaTgin atmospheric-pressure plasmas.However, in higher water vapor conditions, the validity of usingTrto representTgis questionable because the rotational states vary from the Boltzmann distribution[13].Moreover,adjusting the chemical compositions of discharges produced with liquid as one electrode can allow various transient reactive species(TRS) (e.g.·OH, ·H, NO·, NO2·, and O·) and long-lived reactive species (LRS) (e.g.H2O2, NO−2,and NO−3) to be produced in the gas and liquid phases, respectively.This capability makes these discharges versatile with regard to potential applications [7, 14–16].Imported molecular impurities and water vapor are essential to improving the active underpinnings of discharge chemistry by stimulating various chemical reactions in order to produce TRS in the gas phase.In addition,liquid characteristics (e.g.electrical conductivity,temperature, pH value, and contaminants) and the TRS dissolved in the liquid are responsible for producing the cascaded liquid-phase chemistries necessary to produce various LRS [7, 15, 16].
Formation of ring-like, double ring-like, cone-shaped,and other patterns from AC- and DC-driven discharges over the liquid (deionized water (DIW) or tap water or electrolyte solution) surface has been examined by increasing current magnitudes and discharge power levels just after discharge initiation [8–12].In atmospheric pressure plasma generated by an AC power supply,self-organized patterns such as ringlike, plasma-spot etc were observed over the liquid-electrode(tap water (500 μS cm−1) or DIW (0.055 μS cm−1)) surface by varying experimental parameters such as power, gap spacing and liquid properties of the electrode [11].Selforganized patterns such as diffuse disk, single ring etc above the tap water (400 μS cm−1) anode were witnessed as a function of gap spacing and discharge current of an argon atmospheric pressure glow discharge driven by a DC power supply [12].Filamentary streamers from direct-in-liquid discharges excited using DC power have been observed in liquids(DIW and solution)[17].In addition,treelike structure formation has been reported for direct-in-liquid discharges excited by pulse [18].Various studies have been devoted to the formation of discharge structures at or below the liquid surface upon varying electrical parameters (the discharge current or discharge power) immediately after discharge ignition.However, temporal studies of discharge structure formation as a function of the operating time have not often considered.
For AC- or DC-excited discharges with liquid as one of the electrodes, the approximate OH (A–X)Trover the gas–liquid interface exhibits notably higher values as the water vapor content increases [13, 14, 19].When the water concentration is high, an OH quenching effect becomes prominent and the rotational distributions of higher OH (A–X)states depart from the Boltzmann distribution.Conventionally, a two-temperature approach to the rotational population distribution was adopted to extract theTrin order to minimize this overpopulation phenomenon[19].The slope of the first fitting to lower rotational numbers was assumed to beTr.In the present case, lower rotational states of theQ1branchare used to extract theTrvia the Boltzmann plot method in order to derive theTrfrom OH (A–X).Our goal is to explicitly define the coherence of this method based on the thermal equilibrium of the OH (A–X)rotational population distribution in a humid environment.
Plasmas at liquid surfaces generate chemically reactive species such as ·OH, NO·, and O·.The ·OH has a large oxidation potential (2.85 V) and thus has the capability to eliminate almost all types of hazardous organic substances from industrial wastewater [1, 20–22].Chemical reactions that use oxidative species are needed to advance oxidation processes in humid systems.In addition, plasmas offer various agents that impact pharmacological activity.For example, O· atoms lead to the destruction of micro-organisms via chemical sputtering or erosion [1].In contrast, NO· is important to tissue or wound healing and apoptosis prevention, as it diffuses rapidly through most biological tissues[23].Knowledge of reactive plasma species characteristics has improved greatly during the past decade.Nevertheless,the studies that have been performed thus far have been focused primarily on applications.A detailed understanding of this field requires awareness of the impacts of imported molecular impurities, water vapor, and feed gas metastable states on TRS generation mechanisms.The ability to generate certain chemically reactive species and atomic or molecular states at a specific discharge region, as well as the spatial distributions of their emission intensities as determined via optical emission spectroscopy (OES), are indispensable to predicting the governing chemical reactions in real space and time.
In recent years, plasma-activated water and other wet mediums have emerged as a potential approach to preferential destruction of cancer cells[2,24,25].The presence of various LRS, especially H2O2andin activated water have the potential to increase cell apoptosis rates.These may be combined with other approaches such as tumor necrosis factor-related apoptosis and temozolomide to produce robust synergistic effects [25].Moreover, thermal and non-thermal plasma discharges that operate either at or below the liquid surface have been considered for control of plant growth rates[26].Plasma treated water has shown effectiveness on the seed germination and seedling growth of the mung bean [3].Of the various reactive nitrogen species,is invaluable to fertilization and increasing its concentration in treated drainage water has been observed to accelerate plant growth rates[27].Simultaneous monitoring of how the electrical conductivities (σe), pH values, and instantaneous concentrations(ICs) of LRS evolve over time is important to increase the understanding of LRS and estimating their cascaded-liquid phase chemistries.This is different from conducting application evaluation studies.
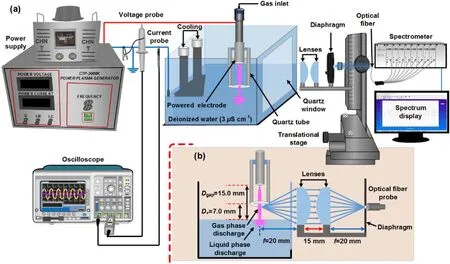
Figure 1.Schematic diagram of the experimental apparatus (a), and description of the discharge unit and optical setup (b).
The present study emphasizes the investigation of an ACoperated argon discharge at the liquid surface in a humid environment.The novel portions of this work are the extension of gas-phase discharges into liquids and observation of discharge shape variation during the discharge exposure period(texp,d).Moreover,to characterize the discharge shapes withtexp,d, corresponding current–voltage characteristics and liquid parameters such as the pH value and σeare measured simultaneously.To probe the chemical nature of the discharge at various positions, spatially resolved profiles of metastable argon (Armeta* ) and various TRS are measured along the discharge axis using OES.Armeta* behavior is studied in connection with excitation,dissociation,and ionization of diffuse air impurities as a function of its spatial distribution to gain insight into the processes that govern discharge chemistry.Among the various plasma diagnostics,Tgis critical since both ionization and excitation processes depend on it.Because of this,Q1branch of the OH (A–X) band ro-vibrational systemis selected forTrdetermination.The spatial profile ofTris determined using a Boltzmann plot and compared to theTrprofile obtained via the LIFBASE method.Moreover, an explicit investigation is conducted to inspect the thermalization of the rotational population distributions in various discharge regions using the aforementiond methods.In addition, an investigation is performed by measuring the ICs of LRS in the liquid,as well as the σeand pH as functions oftexp,d,in order to probe the liquid-phase chemistry.
2.Experimental setup
The schematic sketch of experimental apparatus is shown in figure 1(a), and an optical arrangement of the experiment is shown in figure 1(b).The discharge unit comprises a stainless-steel cylindrical electrode with an outer diameter of 2.0 mm, placed coaxially in a cylindrical quartz tube with an inner diameter of 5.5 mm.The distance of the stainless-steel electrode is fixed at 8.0 mm from the quartz tube opening surface.The discharge unit is mounted in a transparent chamber storing DIW.The position of discharge unit over the DIW surface is fixed atD+=7.0 mm by utilizing a micrometer caliper.The gap spacing(Dgap)is the distance from the stainless-steel electrode tip to the DIW surface; as the discharge unit remains over the water surface atD+=7.0 mm,theDgapis thus 15.0 mm, as shown in figure 2(b).Before performing each experiment, 400 ml fresh DIW (with an initial electrical conductivity 3 μS cm−1and pH 7.5) is filled in the chamber.During the experiment, the DIW temperature is kept at 25 °C by attaching an external cooling system.Argon as a working gas is injected into the discharge unit via the cylindrical stainless-steel electrode using a ball flow meter adjusted to 1.0 slpm.To generate the discharge, an AC voltage power supply operating at 22 kHz is applied to the stainless-steel electrode, and DIW electrode is grounded.To study the electrical characteristics,root mean square discharge voltage (Vrms,d) and root mean square discharge current(Irms,d) using a voltage probe (Tektronix P6015A) and a current probe (Tektronix TCP0030A) are recorded on an oscilloscope (Tektronix DPO4034).It is noted that all measurements in the present work are performed at constantamplitude AC dischargeIrms,d= 35 mA.The AC discharge current is sustained constant by controlling the discharge voltage using the knob of AC power generator.A Canon camera (EOS 7D) acquires optical emission patterns of the discharge.A spectrometer (Avantes, Avaspec Multi-Channel Spectrometer) with the 1800 grooves mm−1gratings is utilized to record the discharge emission spectra.To obtain the spatial measurements, an optical fiber connected with a 2D positioner stage (GCD-202100M and GCD-203100M, China Daheng Group, Inc.) is focused on the discharge column according to the optical setup as presented in figure 1(b).The LRS concentrations are measured with the Colorimetric methods, described in detail elsewhere [28–31].The treated samples with argon discharge are analyzed immediately after collecting from the reactor to eliminate the experimental error.
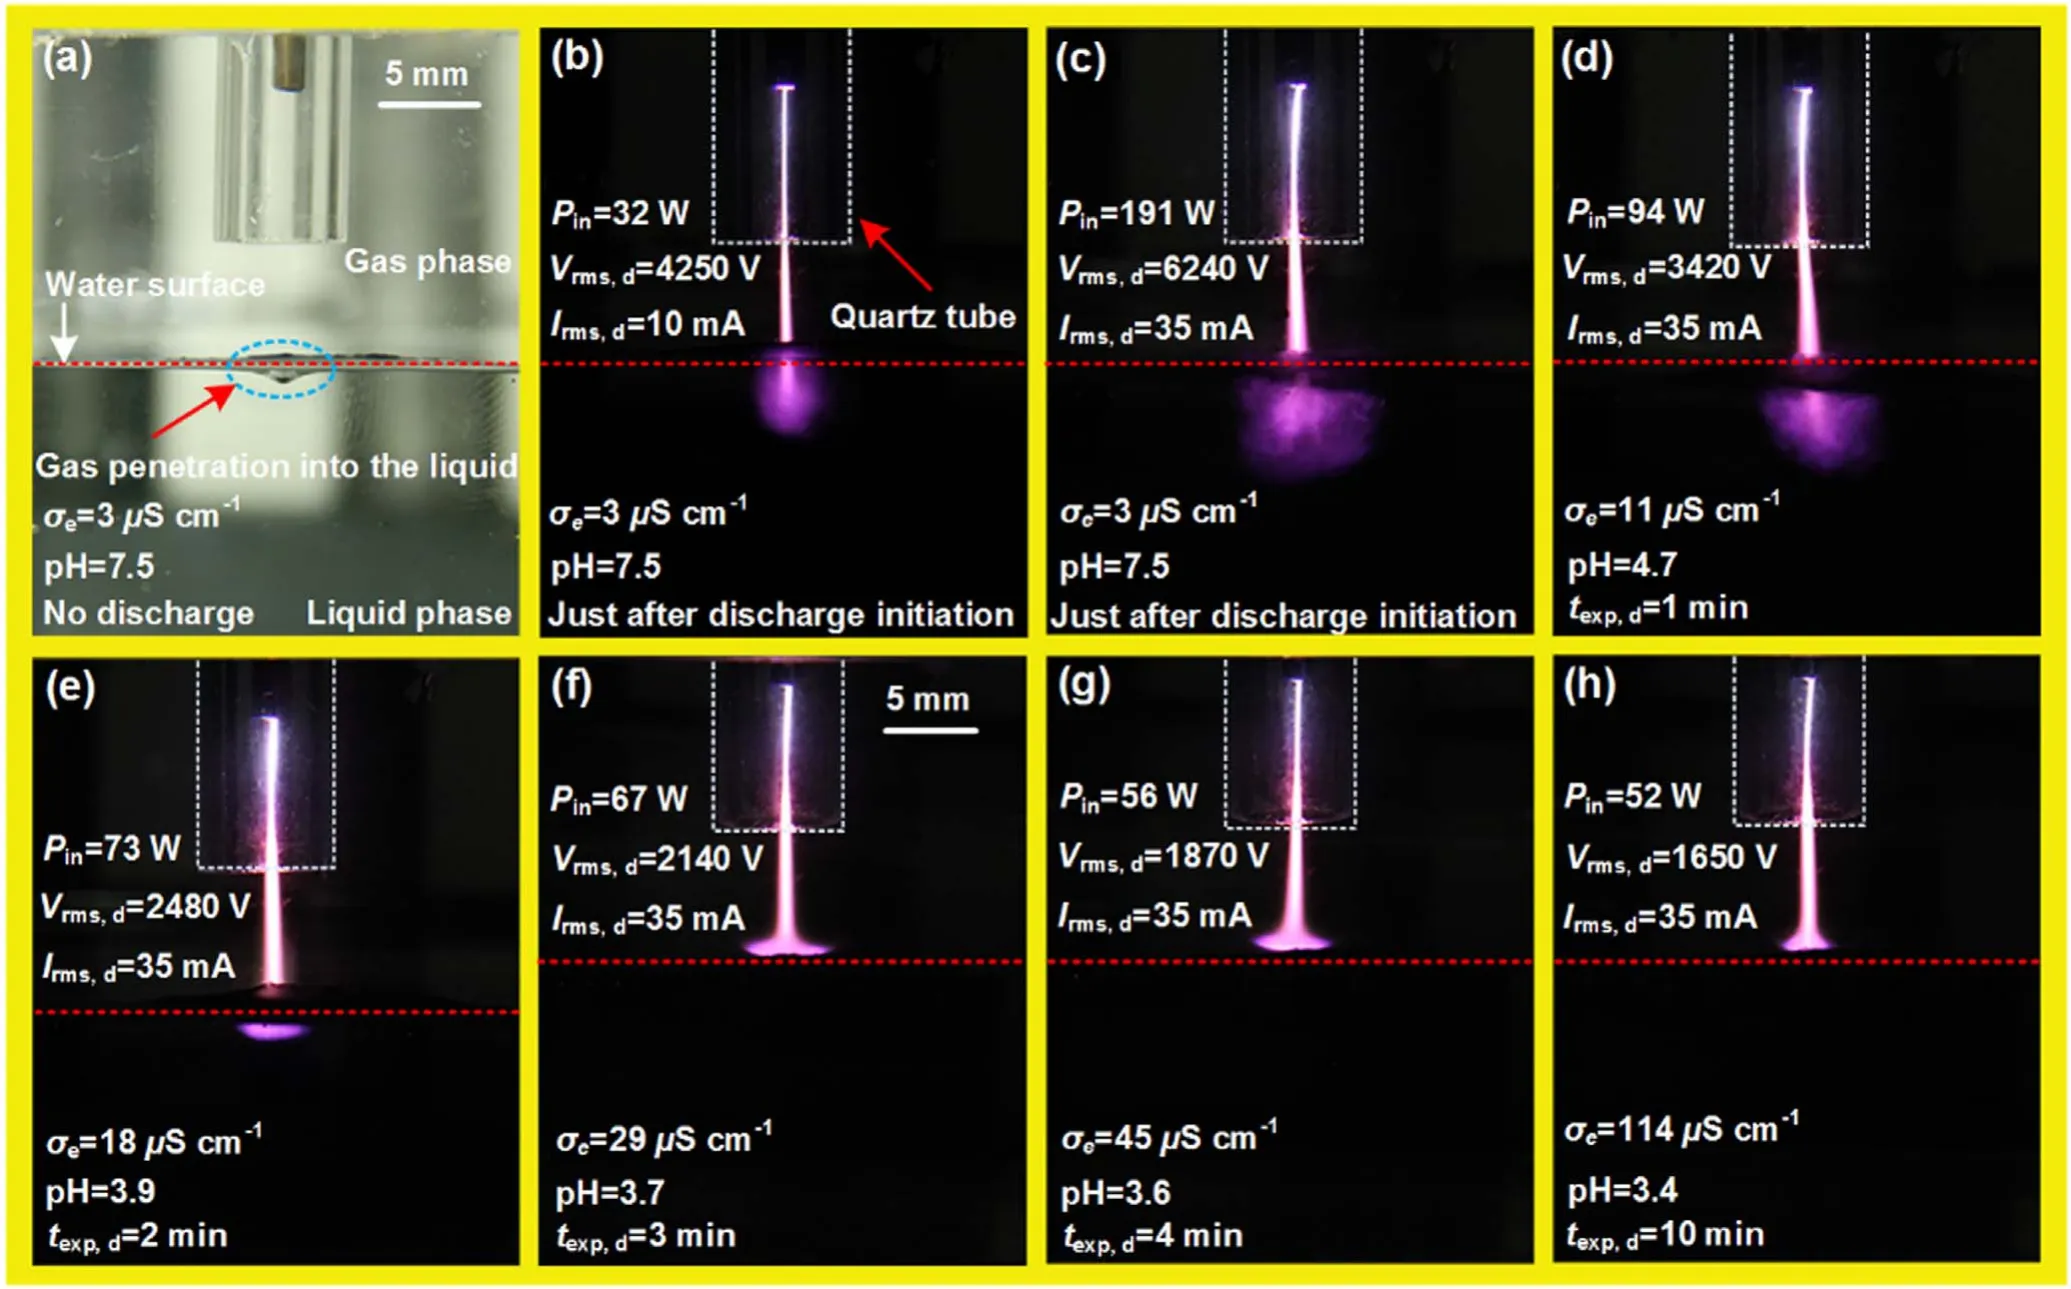
Figure 2.Image of the discharge unit without discharge ignition (a) and images of various discharge shapes as functions of texp,d(b)–(h) captured using a fixed camera shutter opening time of tshutter = 100 ms.
3.Experimental results and discussion
3.1.Temporal evolution of the discharge emission patterns
The temporal evolution of the argon discharge emission patterns (recorded using a constant-amplitude AC discharge current) over a liquid as a function of the discharge exposure time (texp,d) is presented in figure 2.The corresponding root mean square discharge voltage (Vrms,d), root mean square discharge current (Irms,d), power input (Pin), liquid electrode electrical conductivity (σe), and pH value are listed in each panel of figure 2.All images are captured using a camera with a fixed exposure time oftexp= 100 ms.Immediately after breakdown, the discharge initiated in the gas phase also extends into the liquid(Vrms,d= 3300 V andIrms,d= 4 mA).Hence in the reactor discharge exists in the gas and liquid phases simultaneously and thus can be called a gas–liquid phase discharge.This gas-phase discharge extension into the liquid is an exceptional phenomenon that has rarely been reported.
When the appliedVrms,dincreases, the scale of the discharge increases as well.The discharge column lengthens radially in the gas phase while the liquid discharge region expands (figures 2(b) and (c)).To observe this behavior over time,texp,dis increased using a constant-amplitude AC discharge current (Irms,d= 35 mA).The liquid discharge region shrinks and a cone-like structure appears at the liquid surface(figures 2(c)–(f)).A contraction in the cone-like structure is noted whentexp,dis extended further (figures 2(f)–(h)).The evolution process described above is accompanied by decreases inPin,Vrms,d, and the pH, as well as an increase in σe(figures 2(c)–(h)).
The gas-phase discharge appears visually like a constricted channel.Initially, the liquid discharge region has a plume-like shape(figure 2(b)).One may think that the plumelike shape of the liquid discharge region results from penetration by flowing gas rather than from propagation of the discharge in the liquid phase.The liquid discharge region is investigated by analyzing the discharge shapes and computer software is utilized to measure the discharge dimensions.(i)First,the hole depth generated in the liquid by the gas flow is measured (approximately 1 mm in figure 2(a)).This is much shorter than the discharge length in the downstream direction in the liquid (approximately 4 mm in figure 2(b)).So,extended discharge after covering approximately 1 mm depth into the liquid surface will no longer remain in the gas phase(inside the liquid).(ii) As theVrms,dvalue increases, the inliquid discharge region spreads in both the downstream and the radial directions(from ~4 to up to ~7 mm and from ~4 to up to ~8 mm, respectively, in the downstream and radial directions).In contrast, conventional plasma jet plumes elongate only in the stream direction in the gas phase.(iii)Visually, the liquid discharge region appears to be highly unstable and to follow random patterns.Thus, it can be concluded that the liquid discharge region is not a gas–phase plume, but rather is a direct liquid discharge.It might be comprised of single or multiple non-stationary streamer channels that spread chaotically through the liquid.The conelike structure appears later on the liquid surface and seems to be diffuse and homogeneous.
Non-stationary discharge channels in direct liquid discharges have been observed and described in [17, 18].At lower liquid conductivities,the discharge channels are thinner and longer[17,32].A similar phenomenon is observed in the present case; the discharge extension into the liquid is maximized at lower conductivities (DIW initial conductivity σe= 3 μS cm−1in figures 2(b) and (c)).After a minute of operating time, the liquid discharge region starts to shrink as the conductivity increases (from DIW σe= 3 μS cm−1to electrolyte σe=11 μS cm−1), as shown in figures 2(c) and(d).The increase in σeis attributed to gas impurities that are transported into the reactor and lead to generation of acidic products in the liquid (see section 3.7).After 2 min of exposure,the in-liquid discharge region vanishes and a conelike structure appears at the liquid surface.A nearly cone-like discharge structure has been observed in atmospheric air discharges sustained by an AC power supply(5–20 kHz)with a liquid as one of the electrodes [11].The electrolyte conductivity is an important parameter for discharge structure generation.However, the discharge structure generation mechanism from these previous experiments differs from ours[11].One dissimilarity is in the experimental procedure.In our case,the cone-like structure appears after atexp,dof 2 min.In the previous case,it was observed by raising the discharge power to a certain level shortly after the discharge was formed.In addition, static atmospheric air was used as a plasma-forming gas in the previous experiments.The previous experiments also used liquid electrodes with different electrical conductivities (either DIW or tap water with electrical conductivities of 0.055 μS cm−1and 500 μS cm−1,respectively) [11].A similar cone-like pattern was also reported over the DIW (σe=20 μS cm−1) electrode immediately after initiation of an AC-excited (operated at 22 kHz)helium discharge [14].
Gas-phase discharge propagation in the liquid phase is a complex physical phenomenon that can involve various concepts such as strong electric fields, phase instabilities,heating, bubble formation, and molecular dissociation.It has been concluded that the discharge process requires Joule heating to create bubbles in water [33].At the bubble-water interface, electrohydrodynamic instability can occur when stronger electrical fields are present, resulting in the breakup of bubbles into streamers [33].In addition, a reduction in the extension of the in-liquid discharge region withtexp,dcan be correlated to an increased liquid electrode σe.Dissociation and ionization of water molecules by the applied electric field increase σe.In addition, acidic products produced due to the presence of air impurities in the reactor are also involved in increasing σe.Thus, the σeincreases near the discharge channel head and the electric field from that area within the Maxwellian relaxation time becomes banished, and further dissociation does not occur inside the discharge [34].To develop the discharge channel, additional energy must be provided via the power supply to overcome the delay in restitution of the electric field at the channel head.However,in our case, the discharge power input decreases withtexp,d(figure 2).When this happens, channel development is interrupted and discharge propagation decreases withtexp,d(figures 2(c)–(e)).Likewise,the cone-like pattern at the liquid surface shortens withtexp,d(figures 2(f)–(h)).Therefore, formation of various discharge shapes in the gas and liquid phases is sensitive to variation in liquid properties.
3.2.Temporal evolution of the electrical signals
Temporally recorded current–voltage waveforms that correspond to the discharge emission patterns in figures 2(b), (c),(f),and(h)are displayed in figures 3(a)–(d),respectively.The current waveform in figure 3(a) recorded for the discharge(which extends into the liquid) in figure 2(b) shows a single dominant current pulse every half-waveform.It is evident that the current pulse is larger in amplitude and shorter in time(figure 3(a)).The current pulse amplitude continues to decrease as the applied voltage increases and is extinguished completely when the applied voltage is high(figure 3(b)).The current waveforms in figures 3(c) and (d) recorded for the discharges (appeared in a cone-like structures at the liquid surface) in figures 2(f) and (h) are quite different in that the current pulses that appear are shorter in amplitude and longer in time (see figures 3(c) and (d)).
As shown in figure 3, the current pulse characteristics from early and later discharge stages are completely different.The disparity in current pulse characteristics can be described as follows.At low power input levels, the discharge column has poor conductivity and the discharge current approaches zero when the discharge voltage changes polarity(figure 3(a)).The observed current spike amplitudes are different at different polarities since one electrode is liquid and the other is metallic (figure 3(a)).When the power input is increased further, a smoother current waveform is observed because more energy is absorbed into the discharge.This implies a higher discharge conductivity (figure 3(b)).Moreover, it is clear that transformation of the discharge into a cone-like structure is accompanied by obvious increase in current pulse durations (figures 3(c) and (d)).Also, the conelike structure appears during later operating stages at relatively low applied voltages (figure 2).Thus, the critical electric fields during the early and later stages of the discharge are different.The α coefficient (the average number of free electrons produced in a unit distance via collision of an electron with neutral gas atoms and molecules) should be larger for higher electric fields.In this case, the electron avalanche is established rapidly and additional electrons are released,resulting in electron avalanche multiplication.Thus,the charged particle flux is stronger under higher electric fields.Consequently, the generated electric field opposes the applied electric field,and the current pulse duration is shorter when the charged particle flux is stronger.Therefore, the Δtpulsenoted in the current waveforms is short immediately after discharge initiation but a larger Δtpulseis noted later.The recorded waveforms are unique and can be treated like a signature because of the two distinctive discharge shapes observed in- and at- liquid surfaces over the course of the discharge.The current pulses suggest that the discharges are streamer-like [35].Further investigation might be conducted using high-speed imaging cameras.
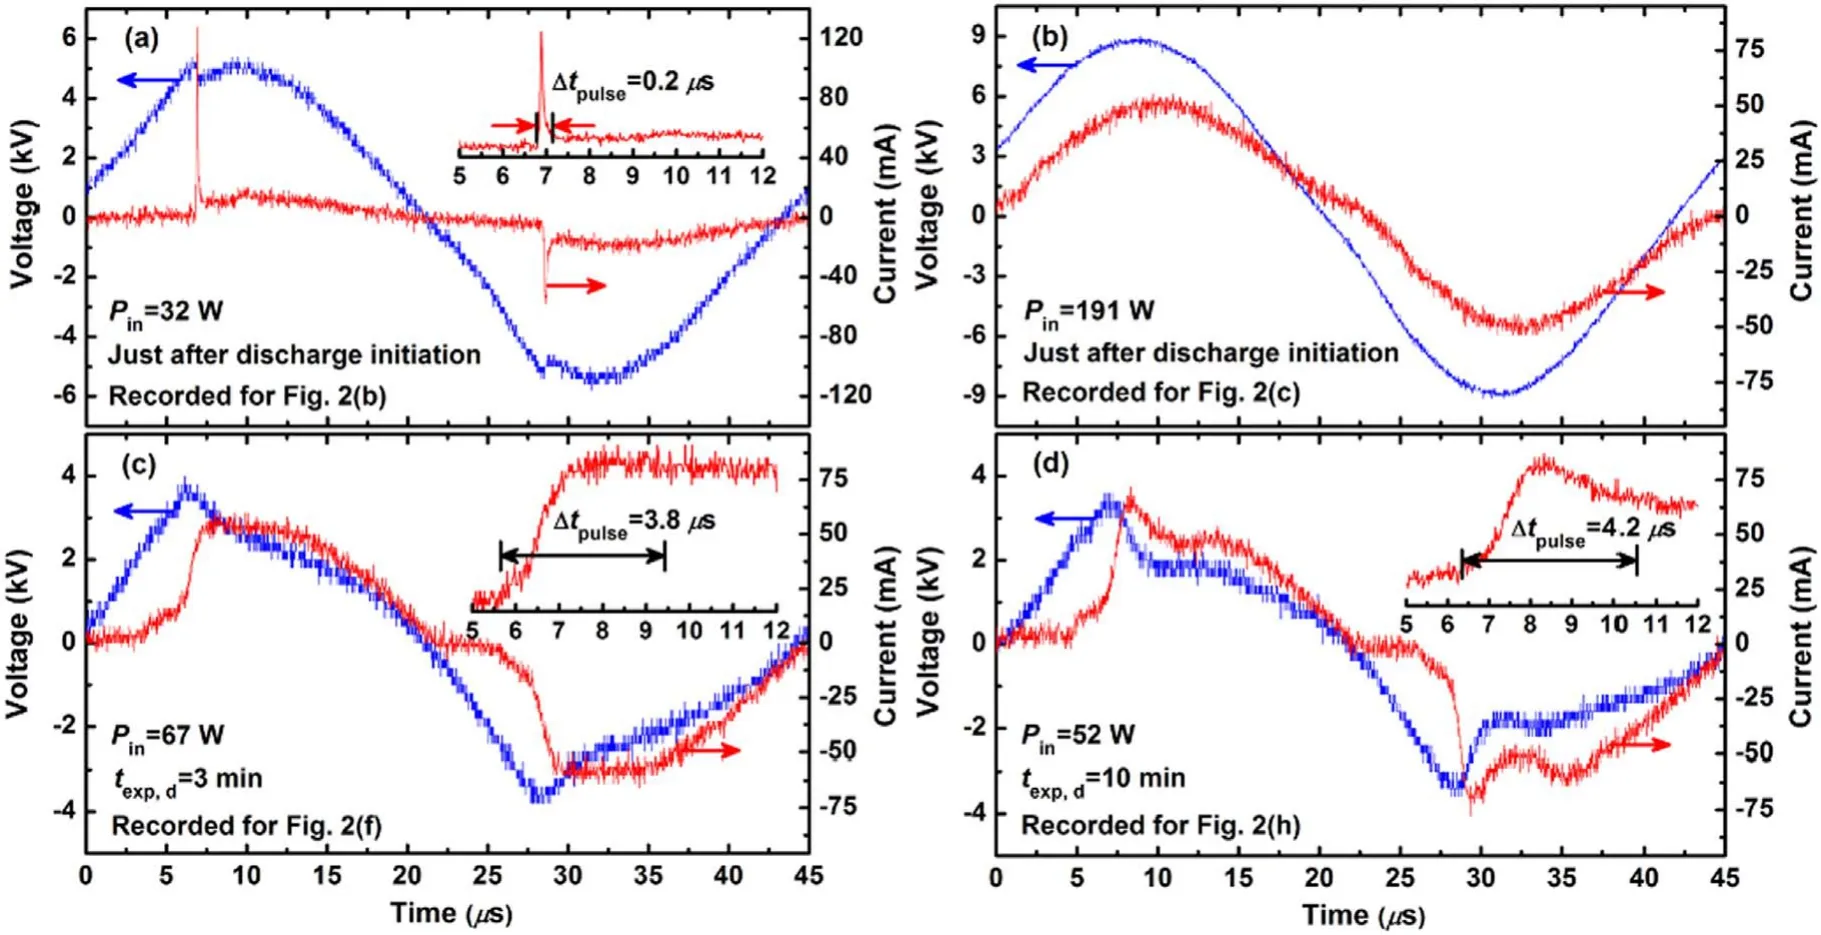
Figure 3.Temporal evolution of the current–voltage waveforms in figures 3(a)–(d) respectively recorded for the discharge shapes in figures 2(b), (c), (f), and (h).
3.3.Optical emission spectra
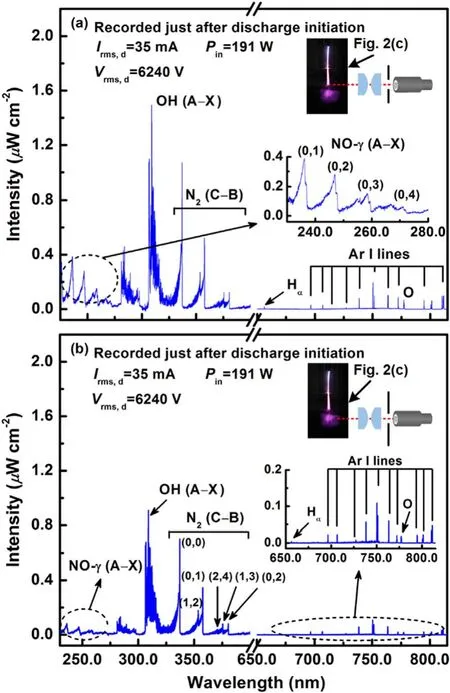
In figure 4, spatially resolved emission spectra are recorded(at constant-amplitude AC current) to compare the discharge chemistry of two distinctive discharge regions; at- and inliquid surfaces,as shown in the insets of figures 4(a)and(b),respectively).Both spectra are dominated by nitrogen oxide NO· radicals bands for NO-γ (A–X) transitions (occur between 230 and 272 nm), bands of hydroxyl ·OH radicals from OH(A–X)transitions(occur between 306 and 310 nm),and bands of the second positive system of molecular nitrogen for N2(C–B) transitions (occur between 330 and 381 nm).Moreover, the hydrogen Balmer alpha (Hα) line(occurs at 656 nm), and atomic oxygen line (occurs at 777 nm) are also detected.As argon is the feeding gas, atomic transitions of Ar I at 696,706,738, 752,763,772,794,801,and 811 nm are visible in both emission spectra in the range of 690–815 nm.In figure 4(a) for the gas–liquid interface region of discharge, molecular NO-γ (A–X), OH (A–X), and N2(C–B) bands transitions, and atomic H and O lines transitions are resulted from water vapor and ambient air gas entrainment.Moreover, emission intensities of NO-γ (A–X),OH (A–X), and N2(C–B) bands, and also Ar I lines are relatively stronger for the gas–liquid interface region incomparison to the in-liquid discharge region.In fact,there is a lesser exposure to air and feeding gas for the liquid discharge region.On the other hand,a part of the power is utilized in the dissociation of water molecules to propagate the discharge in the liquid phase.The key reaction pathways involved in the formation of various species are discussed in detail.
The emission bands such as NO-γ(A–X)and OH(A–X)are main features in the UV region of spectra.The chemical reaction (R1) is recognized to exclusively responsible to the production of NO· radical [23]:
This reaction boosts up in moist conditions(e.g.at gas–liquid interface),because H2O molecule Rydberg levels are resonant withconsequently ·OH is efficiently generated[36,37].Moreover,using the kinetic modeling,it was shown that,yields a significant amount of N, subsequently stimulates reaction R1 [38].Therefore, for argon-fed discharge under humid conditions, reaction (R1) is mainly dominant.To a minor extent, formation of NO· is known to consequence through the three-body reaction involving O· and N [38]

and also with the interaction of O· and metastable nitrogen molecule N2(A)

The excitation mechanism to NO-γ(A–X)band is through the following reaction of NO (X) with N2(A),

and then radiative emission to NO-γ (A–X) band

The highly reactive radicals, e.g.OH (A–X) band emissions are recorded at 309 nm.Among the several reactions to the formation of ·OH radical in the humid discharge, one of the probable reactions here is the electron impact dissociation to form ·H and ·OH radicals [39]:

The ionization of water molecules requires relatively higher electron energies (12.6 eV), so electron impact dissociation(6.4 eV)seems feasible reaction pathway for·OH production.Dissociative recombination of H2O+was hypothesized as a possible route for ·OH production [40]:

In this reaction, H2O+is less-likely the outcome of electron impact dissociation.The ionization potentials of H2O and N2are 12.6 and 15.6 eV, respectively.In the presence of substantial water molecules in plasma,relatively lower ionization of H2O is more favorable to originate H2O+ion through the Penning ionization process
Another most probable pathway to produce·OH radical is the direct dissociative excitation of H2O through theArmeta*[36, 37]
Reactions (R9) and (R10) are considered essential becauselevels are resonant with Rydberg levels of water molecule,and subsequently·OH radical production is boosted in the existence of humidity.Although, all the above-mentioned reaction pathways (R6)–(R10) are important for the·OH radical emission in the discharge region at the gas–liquid interface.Nevertheless, for liquid discharge region, lesser exposure to air and feeding gas suggests that electron impact reaction (R6) is principally more critical to produce ·OH radical.Aside from that,the nitrogen plasma emission band of the radiative state N2(C–B) can be resulted from electron impact excitation [41]

and also from the quenching of N2(A) molecules through Pooling reaction [42]

where important metastable N2(A) can be the outcome ofthrough following reaction [38]:


However,exposition of discharge to ambient air gas suggests that the occurrence of O· is not only the result of H2O dissociation but also of O2[44, 45]:

Figure 5.Temporal evolutions of emission intensities recorded as functions of texp,d in the discharge region at the gas–liquid interface.
Besides, for an argon assisted discharge, involvement ofto produce O· cannot be ignored through the following reaction [38]:
From the previous discussion on the various chemical reaction pathways, it is evident that ambient air and water vapor entrainment into the discharge regions lead to an active underpinning of plasma chemistry, andstates are participating the most to shape the chemistry suitable for the production of various TRS.Meanwhile, higher emission intensities of OH (A–X), NO-γ (A–X), and N2(C–B) transition bands at the gas–liquid interface proposed that discharge chemistry is stronger here than the in-liquid discharge region.
3.4.Temporal evolution of spectral intensities and metastable argon
The temporal development patterns of the TRS andemission intensities at the gas–liquid interface are shown in figure 5.This discharge region is selected because of its importance in TRS formation, as indicated in section 3.5.Emission spectra are collected in one minute intervals.Molecular transition bands such as those of NO-γ [(A–X),(0,1)]at 236 nm,N2[(C–B),(0,0)]at 337 nm,and OH(A–X)at 309 nm, and atomic lines such asat 811 nm and O at 777 nm are considered.An obvious drop in emission intensities is seen at atexp,dof 1–2 min.At the same time, a substantial decrease in the power input from 191 to 73 W is recorded(figure 2).This suggests a decrease in the density of highly energized electrons.These electrons are not only thought to be involved in excitation, dissociation, and ionization of N2, O2, and H2O via impact reactions but are also responsible for exciting argon gas atoms to metastable states.As the discharge time passes, all of the spectral lines exhibit steady trends that correspond well with the small discharge power input decreases that occurred later (figure 2).In an argon-fed discharge, where TRS can also be formed in addition to the impact reactions of N2, O2or H2O (reactions(R11), (R15), and (R16)) through Penning ionization or excitation and dissociative excitation of(reactions(R7)–(R10)and(R12)–(R14)).This also means that decrease in TRS emission intensities for reasons other than power input changes can be the result of relatively lowdensities.

Figure 6.Spatially resolved profiles of TRS and Armeta* emission intensities taken as functions of the axial position from the cylindrical electrode tip to the liquid surface.
3.5.Spatial profiles of TRS and metastable argon
For a deep understanding of TRS in various discharge locations, we can measure the spatial profiles of TRS emission intensities via OES to identify and monitor TRS in real time.Thus, the spatial distributions of emission intensities are recorded for the gas-phase discharge between the cylindrical electrode tip and the DIW surface using the optical arrangement in figure 1(b).The results are presented in figure 6.Emission data is collected in 1.0 mm intervals from the cylindrical electrode tip to the liquid surface.Experiments are performed just after the discharge exposure time of 10 min when the discharge voltage became stable.Various spectral line profiles including NO-γ [(A–X), (0,1)] at 236 nm, N2[(C–B), (0,0)] at 337 nm,[(B–X) (0,0)] at 390 nm, OH(A–X)at 309 nm,at 811 nm,and O at 777 nm are considered.
Starting from the cylindrical electrode tip, the emission intensities are almost steady because the quartz tube provides a nearly inert discharge atmosphere.Outside the tube, considerable variation in spectral intensities is recorded in humid ambient air.The discharge imports various molecular impurities (e.g.N2, O2, and water molecules) that eventually trigger various chemical reactions.The spatial profiles demonstrate that the NO-γ (A–X),N2(C–B),and OH (A–X)intensities increase, while theand O emission intensities decrease as one moves from the tube exit to the liquid surface.
The reactions responsible for increasing OH (A–X)emissions are (R7)–(R10), in whichatoms play a vital role in ·OH formation.The Penning ionization reaction (R8)fuels (R7) and direct dissociative excitation of H2O via reactions(R9)and(R10).Moreover,is involved in the N2(C–B)transition.This occurs directly via reaction R14 and indirectly by creating metastable N2(A) to stimulate the famous Pooling reaction(reactions(R12)and(R13).OH(A–X)and N2(C–B)emissions are most prevalent near the liquid surface.At high water vapor concentrations,is most likely to produce OH (A–X) and N2(C–B) transitions via reactions (R7)–(R10) and (R12)–(R14) instead of thetransition,as discussed earlier in section 3.3.Also,theline intensity decreases while the OH (A–X) and N2(C–B) intensities are maximized.This strongly suggests the involvement of chemical reactions that include species with lower energy thresholds thanTherefore, in a humid argon discharge, dissociative excitation and Penning ionization and excitation are assumed to be likely reasons for the appearance of OH (A–X) and N2(C–B) and the disappearance ofThe NO· is produced via reactions
(R1)–(R3), as discussed in section 3.3.Under humid conditions, the increasing NO· trend can be associated with enhanced ·OH production, which stimulates reaction (R1).Also,commonly leads to N2(A) states via reaction(R13) when excessive water molecule impurities are present.This is assumed from the strong N2(C–B) emission at the gas–liquid interface.This implies the formation of NO·radicals via reaction (R3).On the other hand, enhanced NO·radical production also reduces the O· atomic line via reactions (R2) and (R3).
Recently, a novel approach was used that combined experimental and numerical approaches to studying the reaction kinetics of non-thermal atmospheric argon plasma jets [38].Experimental and modeling results suggested thatwas the major species and that reactive oxygen and nitrogen species originated primarily fromreactions with N2, O2, and H2O [38].There might be other chemical processes that lead to TRS production in the present case.Some of these processes are described in section 3.3.However, qualitative analyses of optical emission spectra(figure 4), the temporal evolutions of various species(figure 5), and spatial profiles (figure 6) suggest thatreactions might contribute the most to TRS formation.
3.6.Determination of rotational temperatures and spatial profiles from OH (A–X) band transitions
To estimate theTg,OH(A–X)band transition is of particular interest in the case of discharges in- and at- liquid surfaces.These are typically containing excessive water vapor concentrations.It was shown that the rotational population distribution of higher rotational numbers is significantly overpopulated and deviated from Boltzmann distribution in a higher water vapor content [13, 19, 43].Also, the quenching effect of OH (A–X) through water diminishes the OH (A)effective life time, resulting in a deviation from the Boltzmann rotational population distribution.To avoid from an overestimation ofTgwhile using the OH(A–X)band,a twotemperature fitting technique was employed to the rotational population distribution.Where a significant overpopulation was witnessed for the higher rotational numbers(starting fromJ= 13)[19].The slope of initial fit involving lower rotational numbers was taken as theTrof OH (A–X).Alternatively, in the present work, population of lower rotational states with single fitting is considered for determination of theTr.Since,it is believed that the phenomenon of overpopulation is not strong for these rotational states.
For the first electronic state, the spectrum of OH (A–X)mainly contains three branches[Q1,R2,andP1].To obtain theTr,Q1branch of the OH (A–X) band ro-vibrational systemis selected because it is well resolved and situated in an uncongested region of the OH(A–X) spectrum.Lower rotational states ofQ1branchnote that stateis omitted from the calculation)are adopted to minimize the overpopulation’s consequences as mentioned earlier.The Boltzmann plot method is employed to extract theTrfrom the rotational structure ofQ1branch.The spectral line emission intensity as a result of rotational transition is given by [46]

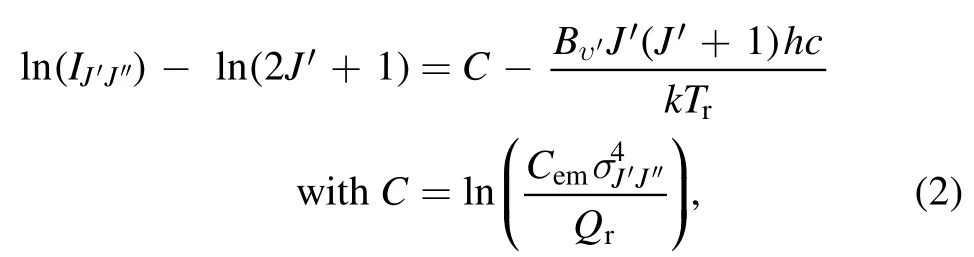
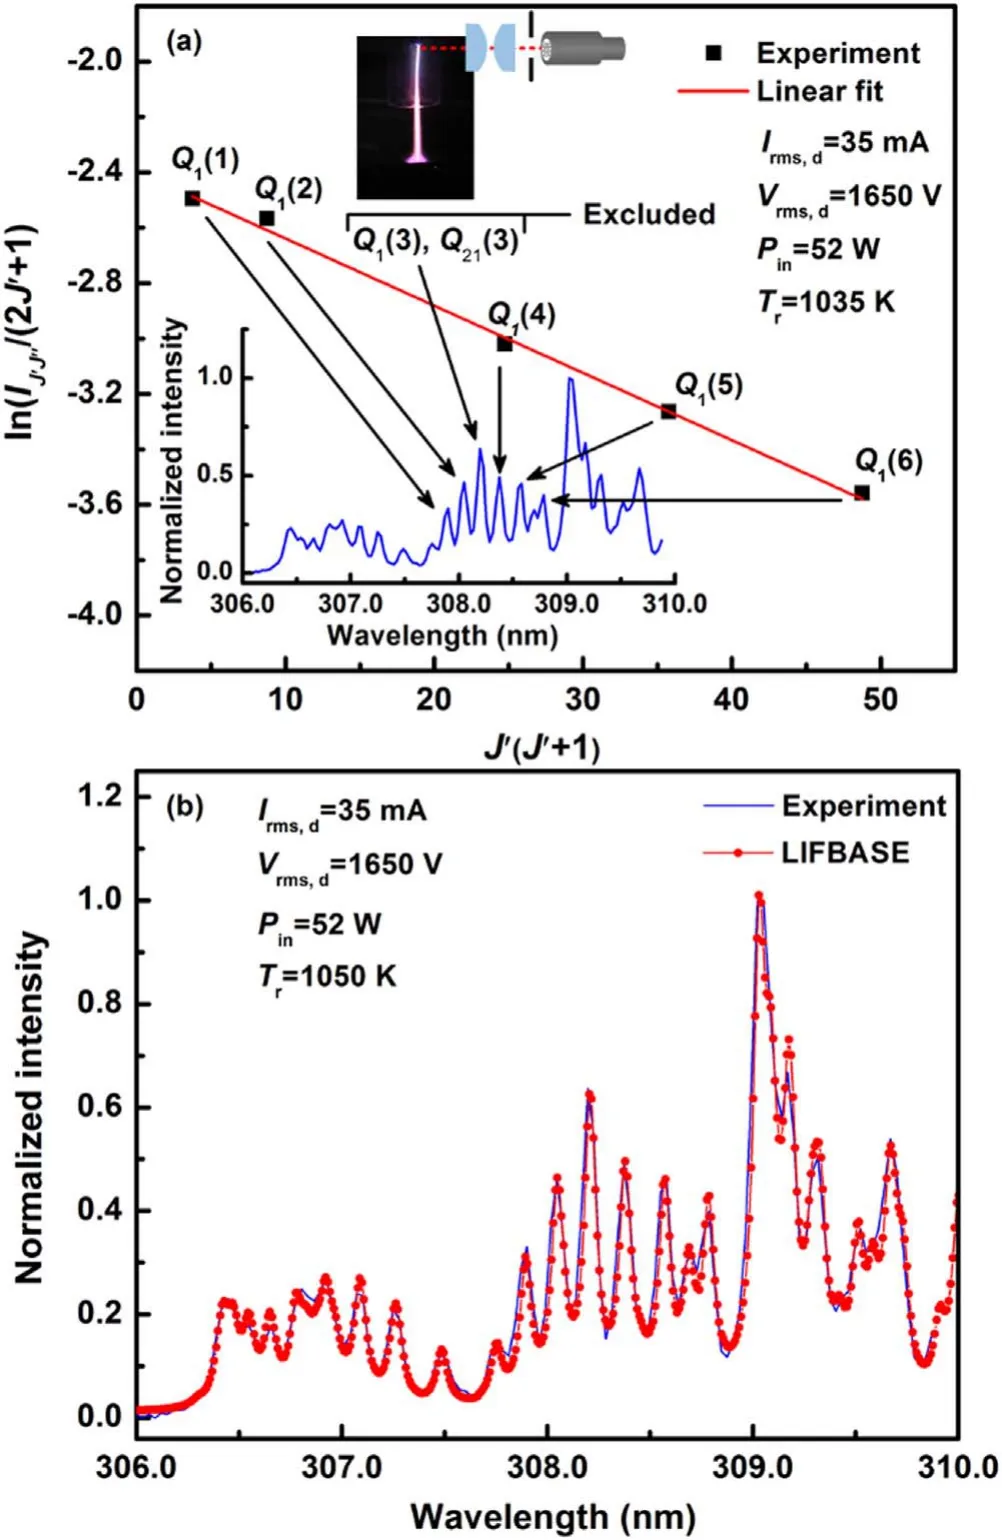
Figure 7.The ro-vibrational spectrum of OH (A–X) recorded at the discharge region near the cylindrical electrode tip and its estimated Tr based on the Boltzmann plot (a) and LIFBASE fit (b).
and left-hand side of the equation (2) is plotted verseswhere slope of the straight line represents theTr.Boltzmann plot offers several advantages,such as it improves the accuracy by taking number of lines into consideration,and minimizes possible errors due to involvement of lines weaker in intensity or overlapping.It also facilitates to authenticate whether rotational equilibrium occurs.Though to apply this method, some precautions are requisite such as utilization of well resolved lines free from self-absorption and overlapping.Self-absorption is one of the serious errors,which generates a dip at middle of the plot by the line with strongest emission intensity,and thus results in altering the slope,and leading to an apparent temperature.Therefore, involved lines overlapping with almost equivalent intensity need to be eliminated from the calculation to get rid of from the error.Figure 7(a)shows theQ1branch lines included in the calculation and their corresponding Boltzmann plot.The spectrum in figure 7(a)is recorded under the conditions as in figure 6,and it corresponds to the discharge region near the cylindrical electrode tip.It is noted thatQ1(3) line is excluded from the Boltzmann plot because of overlapping with an equivalent emission intensity lineQ21(3) on the basis of description as mentioned earlier.It is evident from figure 7(a) that selected linesQ1(1),Q1(2),Q1(4),Q1(5), andQ1(6) of theQ1branch of OH (A–X) band are in good agreement with linear fitting.So the obtained rotational temperatureTr= 1035 K can be equal toTg.

Figure 8.Spatially resolved OH(A–X)Tr profiles taken as a function of axial position between the cylindrical electrode tip and the liquid surface.
For comparison with the Boltzmann plot method,theTrof OH (A–X) is also determined via LIFBASE [47].This commonly used technique involves fitting an experimental spectrum to a simulated one.The spectrum with the best fit indicates the value ofTr,which is equal toTgwhen the rotational states follow the Boltzmann distribution.As an example,a LIFBASE fit to the spectrum in the inset of figure 7(a)is shown in figure 7(b).Good agreement between the experimental and synthetic spectra demonstrates that the rotational states are equilibrated and the resulting rotational temperatureTr=1050 K is equal toTg.One can conclude from figure 7 that theTrvalues determined using the Boltzmann plot and LIFBASE methods are in good agreement near the cylindrical electrode tip.
The atmosphere in the reactor is humid during the discharge.Thus,one can expect water vapor concentrations to be higher near the liquid surface than at locations far from the liquid surface.As mentioned earlier, the OH (A–X) higher rotational state population departs from the Boltzmann distribution in a humid environment.Therefore, the Boltzmann plot and LIFBASE methods estimatedTrare compared for different discharge locations to approximate theTg.In that aspect,spatially resolved profiles ofTrof OH(A–X)between the cylindrical electrode tip and liquid surface are deduced by considering these methods (figure 8).Spatial measurements are performed under the same operating parameters as in figure 6.At low water vapor concentrations, there is good correspondence among theTrprofiles inside the quartz tube.This indicates that the rotational states follow the Boltzmann distribution and one can confidently state thatTrequalsTg.As one moves along the discharge axis towards the liquid surface, growth in theTrprofiles is observed via both methods.The rotational temperature estimated using the LIFBASE method increases faster than that determined using the Boltzmann plot method.The maximumTrvalues are extracted near the liquid surface, although theTrcalculated using the LIFBASE method (Tr=3100 K) is much higher than that from the Boltzmann plot method(1510 K).It means that the phenomenon of overpopulation in large water vapor concentrations is not strong for the Boltzmann plotFor example, at a point 12.0 mm from the cylindrical electrode tip, the spectral databases calculated using a Boltzmann distribution produceTrvalues that vary from 1035 to 1125 K instead of to 1050–1565 K for the LIFBASE method.The marginally higherTrproduced using the Boltzmann plot can still be used asTg, but the corresponding LIFBASE-estimatedTris quite high.Nevertheless,theTrvalue determined using a Boltzmann plot reaches 1510 K near the liquid surface.Thus,Tris no longer representative ofTg.This shows that near the liquid surface,selected lines from theQ1branch are not aligned upon linear fitting.A typical example of Boltzmann plot fitting to the spectrum (recorded near the liquid surface under the same conditions as in figure 6) in the inset of figure 9(a) indicates the absence of rotational equilibrium.At high water vapor concentrations,considerable overestimation ofTrusing the LIFBASE method suggests that the water vapor concentration controls the population distributions of rotational states with high numbers.It also implies that LIFBASE fitting to the OH (A–X)spectrum does not work well when the water vapor content is high.A typical example of LIFBASE fitting to the spectrum in the inset of figure 9(a)is presented in figure 9(b).A poor fit between the experimental and simulated spectra indicates that the estimatedTrdoes not equalTg.It is evident from the results that utilization of lower rotational states limits overpopulation,although the hypothesis thatTris equivalent toTgdoes not remain valid near the liquid surface.

Figure 9.The ro-vibrational spectrum of OH (A–X) is recorded for the discharge region at gas–liquid interface.Tr is estimated based on the Boltzmann plot (a) and LIFBASE fit (b).

Figure 10.H2O2, ,and species concentrations as a function of texp,d.
3.7.Temporal evolution of LRS
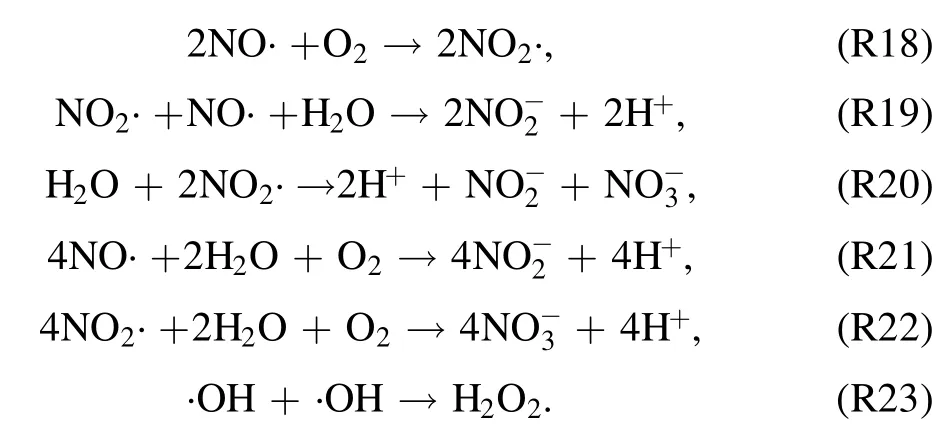
The ICs of LRS during thetexp,dare shown in figure 10.The evolution pattern indicates that ICs of LRS increase in the first 10 min oftexp,d.Further prolonging oftexp,d,yields in decreasing ICs of H2O2andIn contrast, at the same time,the IC ofincreases continuously withtexp,d.After the dissolution of TRS(e.g.·OH,·H,NO·,NO2·,and O·)in the DIW,the ICs of LRS (e.g.H2O2,can be expected to increase through the following reactions (R18)–(R23) [15, 48]:
The produced LRS are acidic in nature and bring a drop in pH value (from neutral to acidic) and an increase in σe(from DIW to electrolyte) of the plasma-treated DIW (see figures 2 and 10).This changing nature of liquid promotes several other chemical reactions in the liquid phase.For example, under acidic conditions (pH < 3.5), reaction R24 takes place [49]:

It is one of the main reactions responsible for disproportionation ofThe formation of various LRS as a result of gas phase discharge was studied on dependence with various gas mixtures and pH of the treated solution [15].According to the postdischarge analysis,the treated solution with fixed pH 6.9 using a buffer has shown an increased tendency of the H2O2,andconcentrations [15].In their case, disproportionation reactions are less-likely possible.In our work,DIW with pH 7.5 is used as a treated liquid.Samples are taken from a liquid continuously treated by the gas-phase discharge.Prolonging thetexp,dover a period of 10 min when the liquid pH value drops to acidic(pH < 3.5),a significant drop in IC offollows the further treatment time(figure 10).The drop in concentration ofcorresponds well with the reason that reaction (R24) is promoted under acidic conditions.Besides, the decomposition of H2O2may proceed through reaction (R25) [15]:

Reaction (R25) cannot justify the decrease in IC of H2O2later than 15 min of thetexp,d, as the corresponding IC ofthan that of H2O2is very low.Another reason for H2O2disintegration can be the interaction with NO· through reaction (R26) [50]:

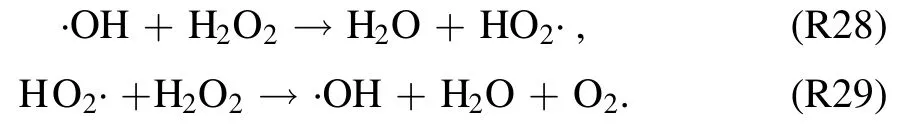
A well-known process that can play a critical role for the destruction of H2O2is the photolysis

by UV radiations produced by the discharge [51].Photolysis process results in the dissociation of H2O2into ·OH.The produced ·OH radical from this process further decomposes H2O2radical via reactions (R28) and (R29) [51]:
It is obvious from figure 10 that σesubstantially increases with longertexp,d.However, with increasing σe, the production of H2O2by the discharge decreased because of increasing photolysis of H2O2[51].Thus,in present case,decreasing IC of H2O2withtexp,dcan be associated to the increasing photolysis of H2O2.
Present results are similar to our previous work on an ACoperated helium discharge over the DIW(20 μS cm−1)electrode,where ICs of H2O2anddecreased with discharge time along with increased IC of.It signifeis that DIW can also be activated chemically at reduced cost by using inexpensive argon gas.ICs of LRS are significantly dependent on the properties of treated liquid,as the disproportionation and photolysis processes are highly influenced by pH value and σe.It is unlike the gasphase discharge chemistry that is mainly fueled by the electron impact reactions andto generate various TRS at the liquid surface (see sections 3.3 and 3.5).
4.Conclusions
In this study, an argon-fed discharge excited between a metallic cylindrical electrode and grounded DIW using a 22 kHz power supply is investigated.
Discharges are observed to have two distinctive shapes during the treatment; the gas-phase discharge extended into the liquid at first but later formed a cone-like shape at the liquid surface.Simultaneous monitoring of critical experimental parameters during the discharge indicated that extension of the gas-phase discharge into the liquid occurs only at higher pH values of approximately 4.5–7.5 and lower liquid conductivities of approximately 3–11 μS cm−1.The disappearance of the liquid discharge region at higher liquid electrode conductivities seems to be governed by electrical phenomena.A qualitative analysis of spatio-temporal profiles indicates different discharge chemistries near the quartz tube exit and liquid surface, attributed to the concentrations of trace gases and water vapor, which help to trigger trace gas reactions viaArmeta* Penning excitation and ionization,as well as dissociative excitation to produce various vital TRS such as·OH and NO· at the gas–liquid interface.
A Boltzmann plot that involved only lower rotational statesofQ1branch is adopted for determination of theTrprofile using the OH (A–X) band transition and compared to theTrprofile produced using LIFBASE to validate the coherence of the former technique.TheTrvalue based on the Boltzmann plot varies from 1035 to 1510 K while moving along the discharge axis towards the liquid surface.The deviation from the Boltzmann distribution is observed only in 3.0 mm region from the liquid surface (highest water concentration region).Contrarily, LIFBASE methodology basedTrvalue varies from 1050 to 3100 K for the same scale.The thermalization behavior is only perceived within 6.0 mm region from the cylindrical electrode tip.The higherTrvalues extracted using LIFBASE clearly emphasize the non-thermalization of higher rotational states due to overpopulation.Under the same conditions, lower rotational statesofQ1branch in OH (A–X) band are relatively insensitive to the water concentration and provide a way to measureTgbeyond the range of the LIFBASE fitting technique.
The evolutions of the instantaneous aqueous concentrations of H2O2,measured in plasma-treated liquids are significantly dependent on the pH value and conductivity.Lower instantaneous H2O2andconcentrations and higher instantaneousconcentrations are measured at lower pH values and higher conductivities than at higher pH values and lower conductivities.
In the long run, present studies may provide a better approach towards the calculation ofTgin a relatively high humid environment.Whereas process of producing various species in water through interfacial argon discharge is an environmental friendly and low-cost, and treated water possesses the potential in industrial wastewater cleaning,clinical medicine, and agriculture.
Acknowledgments
This work was supported by National Natural Science Foundation of China (No.51578309).
猜你喜欢
学习月刊(2022年8期)2022-10-10
环球时报(2022-08-02)2022-08-02
艺术评论(2020年6期)2021-01-22
江苏教育·书法教育(2020年10期)2020-09-10
当代人(2020年4期)2020-05-08
汽车观察(2019年2期)2019-03-15
美与时代·美术学刊(2018年4期)2018-06-21
东坡赤壁诗词(2018年1期)2018-03-31
教育界·上旬(2017年9期)2018-01-17
中华魂(2017年8期)2017-11-22
 Plasma Science and Technology2021年2期
- Plasma Science and Technology的其它文章
- Effect of edge turbulent transport on scrapeoff layer width on HL-2A tokamak
- An investigation on improving the homogeneity of plasma generated by linear microwave plasma source with a length of 1550 mm
- Turbulent boundary layer control with a spanwise array of DBD plasma actuators
- Plasma activation towards oxidized nanocarbons for efficient electrochemical synthesis of hydrogen peroxide
- Spatio-temporal evaluation of Zr plasma parameters in a single-beam-splitting double-pulse laser-induced plasma
- Enhanced electrocatalytic activity of carbon cloth by synergetic effect of plasma and acid treatment