
Theoretical model and experimental investigation optically triggered hollowcathode discharge formation
2021-03-01 08:09WeijieHUO霍卫杰JingHU胡静XiaotongCAO曹晓彤LingQIN秦岭andWanshengZHAO赵万生
Plasma Science and Technology 2021年1期
关键词:秦岭
Weijie HUO(霍卫杰) ,Jing HU(胡静),Xiaotong CAO(曹晓彤),Ling QIN(秦岭)and Wansheng ZHAO (赵万生)
State key laboratory of Mechanical System and Vibration, Mechanical Engineering Department, Shanghai Jiao Tong University, Shanghai 200240, People’s Republic of China
Abstract In order to investigate the process of optically triggered discharge formation, a model of ion space-charge formation based on classical plane electrodes and revised for a characteristic hollow-cathode discharge(HCD)configuration is proposed in this paper.The primary modified factor in our model is the penetrating electric-field parameter,which influences the ionization of trigger electrons and is calculated via particle simulation.Optical-trigger experiments are carried out using different voltages and under different seed-electron conditions, provided by two different photocathodes, Cu and Mg.The ion-accumulation rates calculated by our model are compared to the discharge-formation time, which is deduced from optical-trigger experiments.The results demonstrate that the process of positive space-charge formation is dominant in the HCD formation process or trigger delay, which is highly dependent on the seeding-electron density and applied voltage, and can therefore be quantitatively described by our model.Additionally, electron-beam generation is investigated by optically triggered HCD experiments on Mg- and Cu-photocathode-based devices.The results show that a more efficient trigger device is capable of generating an electron beam with higher amplitude and density.
Keywords: hollow-cathode discharge (HCD), trigger delay, optical trigger
1.Introduction
Pseudospark discharge, first discovered in 1979, is operated in the low-pressure region on the left-hand branch of Paschen’s curve,which is characterized by a discharge current in the kiloampere region and high-energy electron-beam generation within tens of nanoseconds [1, 2].In pseudosparkdischarge devices, single electrons cannot initiate the discharge in the main gap, therefore triggered ‘seed electrons’from a hollow cathode are required for discharge ignition[3-5].The time duration between the application of a trigger pulse and the initiation of pseudospark discharge is defined as the trigger delay or discharge-formation time [6].
The discharge-formation process is divided into three stages [7]: (1) the plasma virtual anode gradually forms near the anode, (2) movement of the plasma virtual anode, (3) the ionization process within the hollow-cathode cavity as the anode potential becomes close to the cathode.The second and third stages are discussed in detail in the related literature[8-13].However, there is a lack of discussion about opticaltrigger-motivated virtual-anode formation and the subsequent discharge-formation processes.
To investigate the relationship between trigger delay and the virtual-anode-formation process, a modified model for positive-ion space-charge formation is proposed, and then a series of optically triggered pseudospark-discharge experiments is presented.The triggered hollow-cathode discharge (HCD) formation time is compared with the growth rate of positive-ion density,which is decided by seed electrons and applied voltage etc.Furthermore,the influence of the optical trigger on beam generation is also discussed.This work is organized as follows:in sections 1.1 and 1.2,as part of the introduction, the modeling of positive spacecharge formation and calculation of the HCD parameterk(V,t)are presented;in section 2,the pseudospark-discharge experimental setup and the optical-trigger device are presented; in section 3.1, the experimental results for the triggered HCD and a comparison with our model are presented and discussed; in section 3.2, electron-beam characteristics are investigated with various optical-trigger parameters.The conclusions are finally summarized in section 4.
1.1.Model description
Equation (1), below, describes an ion-accumulation process,on the assumption that the positive ionic distribution, ρi, is varied with time but independent of the spatial location during the early period of the pre-breakdown stage [14].
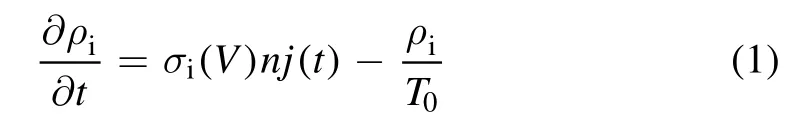
wherej(t) is the electron-current density, which is simply defined by Child-Langmuir current att= 0; σi(V) is the average cross-section for the ionization of gas atoms by electrons under applied voltageV;nis the atomic density,andT0is the average travelling time of the ions [14].
However, equation (1) describes the model of a typical parallel-plane discharge-gap configuration and it does not account for the influence of ‘seed electrons’.As shown in[15], the total ionization cross-section in the hollow-cathode region is one order of magnitude higher than that of the main gap during the pre-breakdown phase.The cathode’s aperture and the hollow-cathode configuration lead to the formation of a reducedE/Nregion(E/Nrepresents a reduced electric field,whereEis an electric field andNis the density of neutral particles) in the hollow cathode and promote substantial ionization events here, due to potential lines penetrating into the cathode region.Thus the classical parallel-plane model presented in equation (1) requires suitable modifications to take account of the HCD configuration.
Since the mean free path of the electrons is much greater than the gap spaced, the electrons pass through the main gap almost without collision [16].Therefore, the electron currentj(t) is formed by the initial seed-electron currentj0(t)through ionization multiplication in the hollowcathode region, which can be described by a multiplication coefficientk(V,N,t) under certain geometric conditions.Therefore, compared with equation (1), the model resulting from the inclusion of the hollow-cathode effect is as follows:
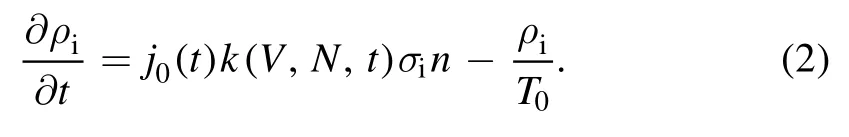
In the model described by equation (2), the initial seedelectron currentj0(t) mainly originates from the trigger process, which is the photoelectron current under this optically triggered discharge condition:

In equation (3), λ0is the minimum wavelength of the xenon flash lamp’s output in the following experiments,λ1is the cut-off wavelength of the photoelectric effect for a given material,t1is the duration of the flash light’s illumination,lis the attenuation coefficient of light,E(e,λ)is the spectral irradiance of the flash lamp,E0(λ) is the energy of a photon whose wavelength is λ,QEis the quantum efficiency for a specified material.
To simplify the discussion, for a fixed pressure and geometric structure,k(N,V,t) (ork(V,t)) is determined by the penetrating electric-field distribution inside the hollow-cathode region.In addition,the generated ion density at each location is only dependent on the time before the formation of the virtual anode, equation (2) can be simplified to the following form:

1.2.Modeling and calculation of the HCD parameter k(V, t)
In the HCD model presented via equation(4),the effect of the hollow-cathode configuration is represented by the multiplication coefficientk(V,t) determined by the penetrating electric field.In this work, a particle-in-cell (PIC) simulation via XOOPIC is presented to study the influence of applied voltage on the penetrating electric-field distribution, as illustrated in figure 1.The HCD device and the PIC calculationdomain model are illustrated in figures 1(a)and(b),which are the same as the experimental setup in section 2.The gas used is Ar and the gas pressure is 50.6 mTorr in the simulation,while the other simulation parameters including the cell size,time step,initial density for tracked particles,particle weight,and secondary coefficient are the same as those used in [15]and are shown in table 1.Figures 1(c)and(d)are the electronphase plots and potential distributions at 4 kV and 10 kV,illustrating that the potential lines penetrate more deeply and widely inside the hollow-cathode region under higher applied voltages.Therefore, a bigger intense ionization region is formed in the hollow-cathode region and dependent on the applied voltage.
The electric-field penetration coefficientk(V,t) is the electric-field-related penetration depth, which determines the efficient ionization region inside the hollow cathode.According to [17], the electron ionization cross-section reaches its maximum value when its energy is 2ξiz(31.6 eV for Ar) and the electrons around the 31.6 V potential region generate the highest-ionization events, thusk(V,t) is defined as the ratio of the 31.6 V potential line’s depth on the symmetric axis versus the length of the hollow cathode.Values ofk(V,t) versus various applied voltages ranging from 4 kV to 12 kV at different times are illustrated in figure 1(e),confirming the presence of an approximately linear dependency betweenk(V,t) and the voltage applied before the plasma caused by the strong positive space charge forms in the main gap.
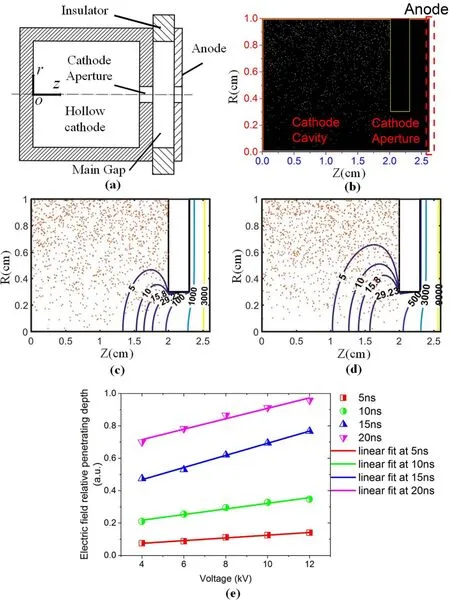
Figure 1.Numerical simulation results for a penetrating electric field in a hollow cathode.(a) Structure of a pseudospark-discharge device,(b)PIC model of the electrodes,(c)potential distribution when the applied voltage is 4 kV,(d)potential distribution when the applied voltage is 10 kV, (e) the penetrating electric-field depth versus different applied voltages at different times.
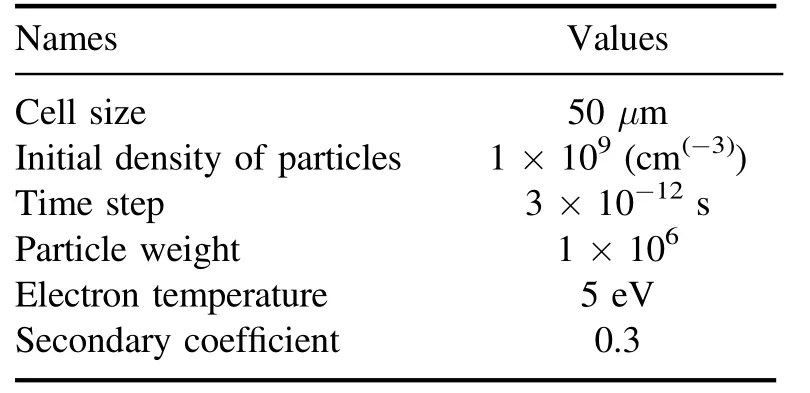
Table 1.The simulation parameters used for the PIC simulations.
2.Experimental setup
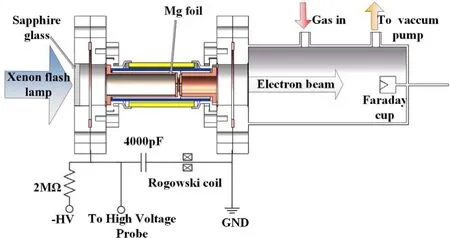
Figure 2.Experimental setup for an optically triggered pseudospark discharge.
The experimental setup including the pseudospark-discharge device, optical trigger, and electron-beam drift region is illustrated in figure 2.The single-gap pseudospark-discharge chamber consists of a cylindrical hollow cathode and a grounded anode insulated by Teflon.The anode and cathode each have a 20 mm diameter and a 3 mm on-axis hole for electron-beam extraction.The length of the cathode cavity is 20 mm and the thickness of the hollow-cathode cavity and the anode electrode is 3 mm.The material used for all the electrodes is Cu.
The optical-trigger source in the experiments is a xenon flash lamp (MXS1.5U-00) with a 5 W power input and a maximum emission frequency of 252 Hz.The output wavelength range of the flash lamp is 180mm to 2000 nm.To control the light-output intensity of the flash lamp, the discharge voltage of the flash lamp can be changed from 400 V to 600 V.In our experiments, the xenon flash lamp is triggered by an external trigger pulse from 0 V to 5 V in amplitude and with a 10 μs pulse width.The optical signal irradiates the cathode inner wall through a sapphire ultraviolet-transparent glass flange to generate seed electrons and trigger the discharge.
Through the use of a pure Cu hollow cathode and Mg foil covering the inside walls of the hollow cathode, the same photoemission areas are obtained to generate different amounts of seed photoelectrons, as decided by theQE.The work function of Mg is 3.66 eV and that of Cu is 4.5 eV[17,18].The influence of different amounts of seed electrons,j0, on the trigger delay is experimentally investigated in this paper, for two different photocathode materials, Mg and Cu.The hollow cathode is connected to a high-voltage DC power supply (AU-60N5-L (220)) through a 20 MΩ charging resistor.Two 2000 pF ceramic capacitors are connected symmetrically between the anode and cathode for energy storage.A high-voltage probe (North Star PVM-5) is connected to the cathode to measure the voltage breakdown waveform.The discharge current is measured by a fastresponse Rogowski coil.The electron-beam current is measured by 0.423 Ω Faraday cup [19, 20] located 10 mm downstream from the anode hole in the electron-beam drift space.Data are acquired by a high-speed oscilloscope with a 1 GS s−1sampling rate, at a bandwidth of 500 MHz.
The experiments on the formation of optically triggered pseudospark discharges and the generation of HCD-based electron beams are performed in argon gas.
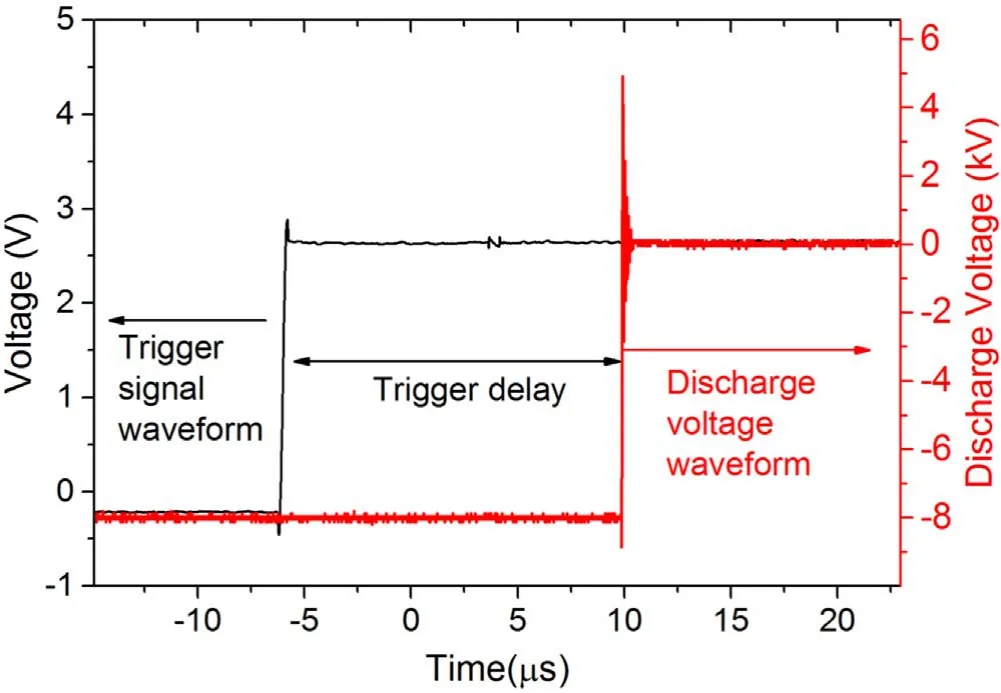
Figure 3.Typical waveforms of trigger pulse and onset of discharge.
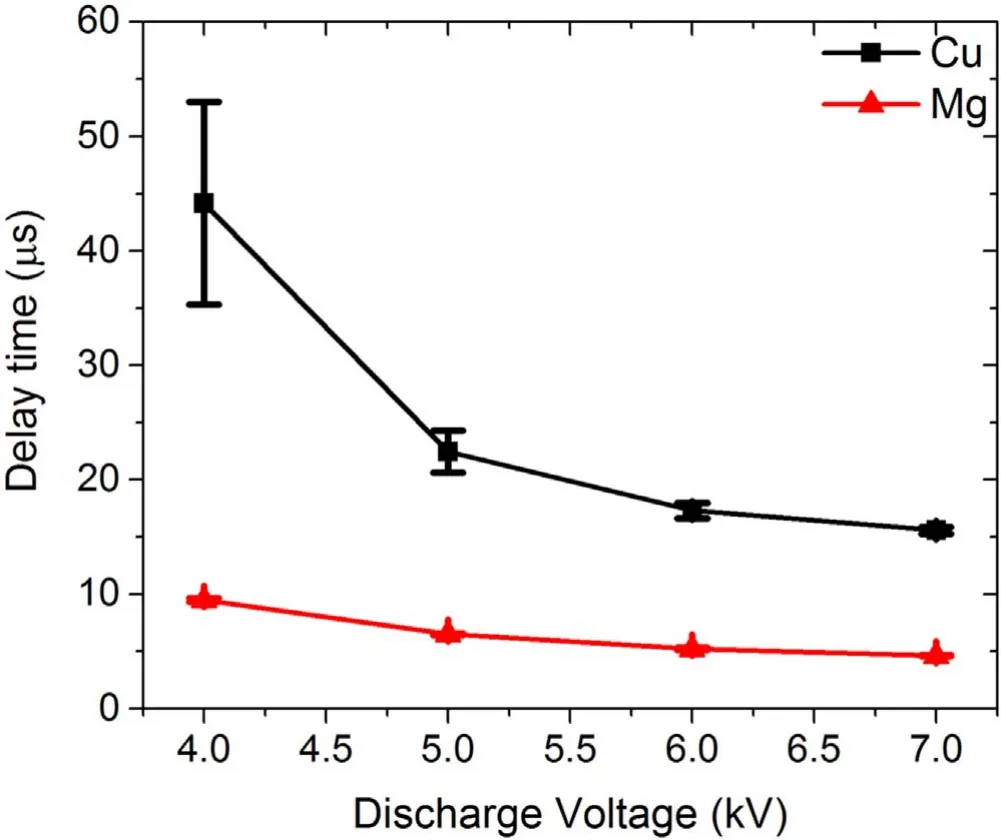
Figure 4.The HCD formation times of different photocathodes versus varying voltages at a pressure P = 50.6 mTorr.
3.Experimental results and discussion
3.1.Trigger delay
The typical waveforms of the optical-trigger pulse and the onset of HCD are presented in figure 3.In this section, the time interval between the optical-trigger pulse and the onset of HCD is treated as the HCD formation time or trigger delay.The influences of the applied voltage and seeding-electron density,j0, on discharge-formation time are studied experimentally.Each data point presented in the plots is the mean value of five continuous measurements.The time intervals for Cu and Mg photocathodes and four breakdown voltages ranging from 4 kV to 7 kV are investigated and plotted in figure 4, for which the pressure is 50.6 mTorr.As illustrated in figure 4, compared with the Cu cathode, the Mg cathode brings about a higher initial current density,j0, and thus a faster HCD formation time for the same voltage and pressure conditions.For the lowest voltage applied (4 kV), the HCD formation time of the Cu-cathode device is 44.2 μs, which is 4.6 times the 9.5 μs obtained with the Mg-cathode device.At the highest operational voltage of 7 kV, the HCD formation time of a Cu-cathode device is 15.6 μs,which is 3.4 times that of the 4.6 μs obtained using the Mg-cathode device.
In addition, in both Cu- and Mg-photocathode devices,the HCD formation process is faster with an increased breakdown voltage at the same pressure orN,as illustrated in figure 4.In the Mg-cathode device, the HCD formation time is decreased from 9.5 μs to 4.6 μs when the breakdown voltage is increased from 4 kV to 7 kV.In the Cu-cathode device,the HCD formation time is decreased from 44.2 μs to 15.6 μs when the breakdown voltage is increased from 4 kV to 7 kV.
According to our model in section 1, the remaining positive-ion(ρi)distribution depends on the growth rate of the ions generated due to ionization,dρi_g,(or the right-hand side of equation (4)):

whereςk V t,( ) is the averagedk(V,t), which is linearly dependent on the applied voltageV, oraccording to the PIC simulation results presented in section 1.The average ionization cross-section, σi(V), is calculated through the same method as that shown in [14].
To evaluate the influence of applied voltage on the ionaccumulation process, the non-dimensional ion-density growth rateρdViin arbitrary units, which is the ratio between the growth rate of ion density for other applied voltages and the growth rate of ion density for an applied voltage of 4 kV is calculated, and plotted in figure 5.
According to equation (5), the photoelectron current determined,ρdVi, is calculated by:
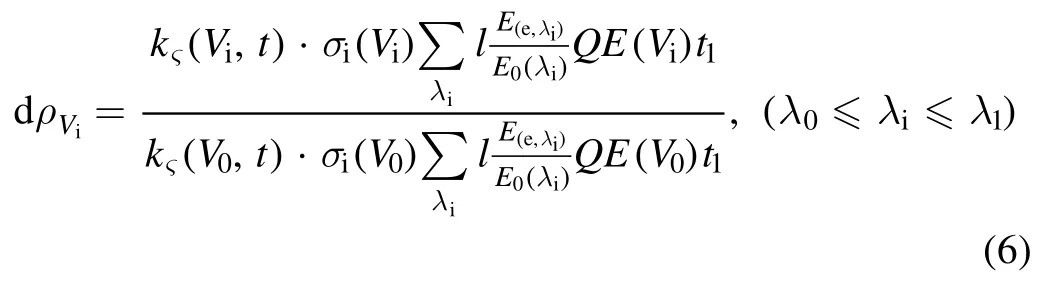
whereViis another applied voltage,V0is 4 kV,and theQEis assumed to be linearly dependent on the applied voltageVfor the same photocathode, as shown in [21, 22];E(e,λi)are the discretized spectral irradiance values of the optical-trigger source,E0(λi) is the energy of photon at the wavelength λi,andt1is the pulse duration of the trigger light.
In addition to the ion-density growth ratethe righthand y-coordinate of figure 5 represents the non-dimensional change rate of the discharge-formation velocityin arbitrary units obtained from the experimental results of the Mg and Cu-photocathode-trigger delays.

where delayViis the measured delay time for another applied voltage,and delayV0is the measured delay time for an applied voltage of 4 kV.
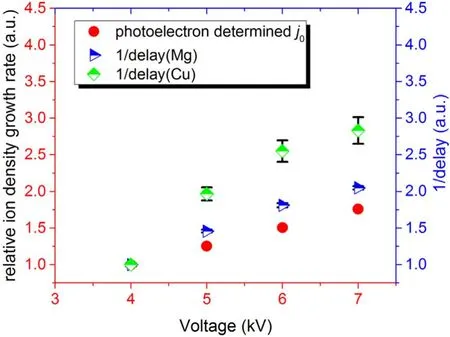
Figure 5.Calculated ion-density growth rates compared with the non-dimensional change rate of discharge-formation velocity(1/delay) from the experimental results.
Figure 5 shows that an increased voltage promotes ion accumulation and a higher 1 /d elaya.u,and therefore a faster discharge-formation process is established using the same HCD pressure and geometric conditions.Additionally, as illustrated in figure 5, the slopes of the induced 1 /d elaya.uin the experimental data obtained from both the Mg and Cu photocathodes show a similar tendency to the ion-density growth ratesd,(determined by the photoelectron current)versus changes in the applied voltage.Compared with the Cu device, 1 / d elaya.ufor theMg photocathode is closer to the determined photoelectron current,dρVi.The results of 1 /d elaya.uobtained from the experimental delaydρ Viof the ion-growth model (as determined by photoelectric current)demonstrate that the ion-accumulation process(as determined by photoelectron emission),or virtual-anode formation,is the dominant factor in the discharge-formation process.
From the experimental results as shown in figure 4, the discharge-formation time of the Mg-photocathode-based HCD device is shorter than that of the Cu photocathode under the same conditions, which is consistent with our model that prdicts that the increased photoelectrons orj0provided by the lower-QEmaterial, Mg, result in faster ion-formation rate.
3.2.Electron beam
In this section, electron-beam generation is investigated for HCD devices based on two photocathode materials, Cu and Mg.The typical electron-beam current waveform obtained from a Mg-photocathode HCD at a 16 kV breakdown voltage is illustrated in figure 6.A hollow-cathode-phase electron beam with high energy but a low current density[23-25]and a conductive-phase electron beam with low energy and a high electron-beam current [26, 27] are identified in figure 6.
The electron-beam current pulses obtained from the Mgand Cu-photocathode-based HCD devices are illustrated in figure 7, under the same breakdown voltage of 17 kV and a pressure of 40.5 mTorr.As shown in figure 7, the Mg-photocathode device with a higher initial photoelectron current,j0, is capable of generating a higher electron density or a 146.4 A beam current,which is 1.27 times that of the 115.2 A beam current obtained from the Cu-cathode device.Meanwhile, the electron beam’s current-pulse duration is slightly different for various cathode materials, varying from the Cucathode device’s 587 ns to the Mg-cathode device’s 690 ns.
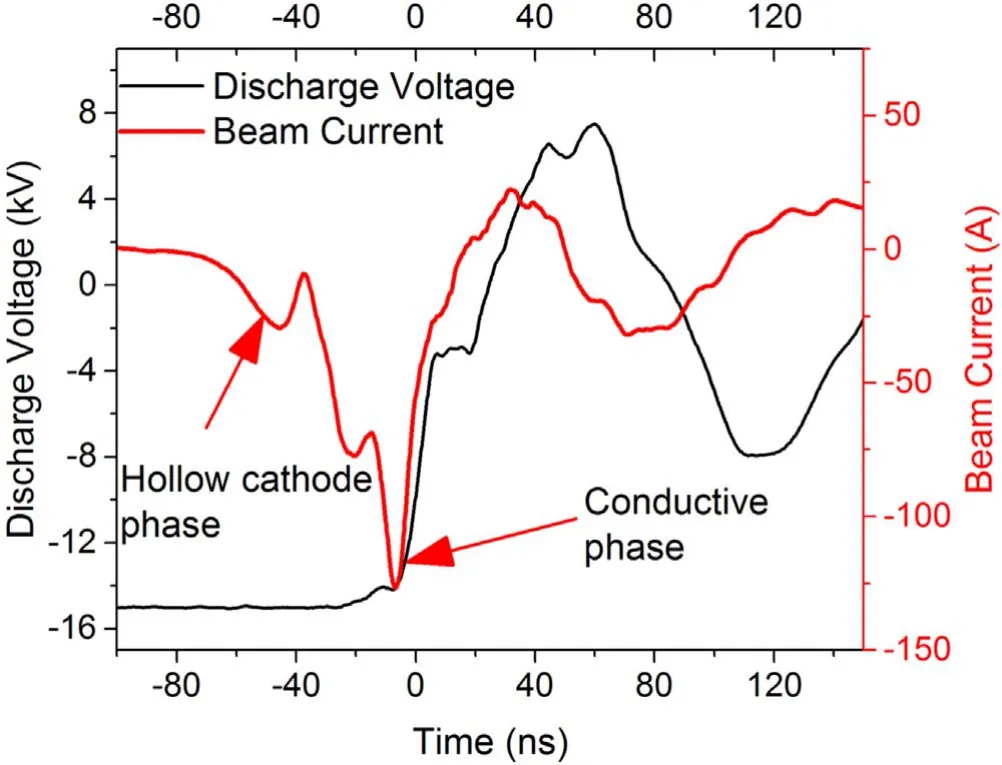
Figure 6.Typical electron-beam current waveforms for two independent phases.
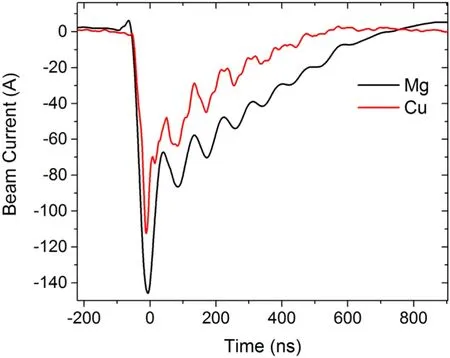
Figure 7.The electron-beam current waveforms of pure Cu and Mg cathodes.
The peak values of the electron-beam currents obtained from Cu- and Mg-photocathode-based HCD devices are plotted in figure 8.As shown in figure 8, the peak current is increased from 57.4 A to 68.4 A, comparing the electron beam generated by the Cu-HCD device with the Mg-HCD device at 6 kV.At a 10 kV breakdown voltage, the peak electron-beam current obtained from the Mg-HCD device is 1.3 times that obtained from the Cu-HCD device.
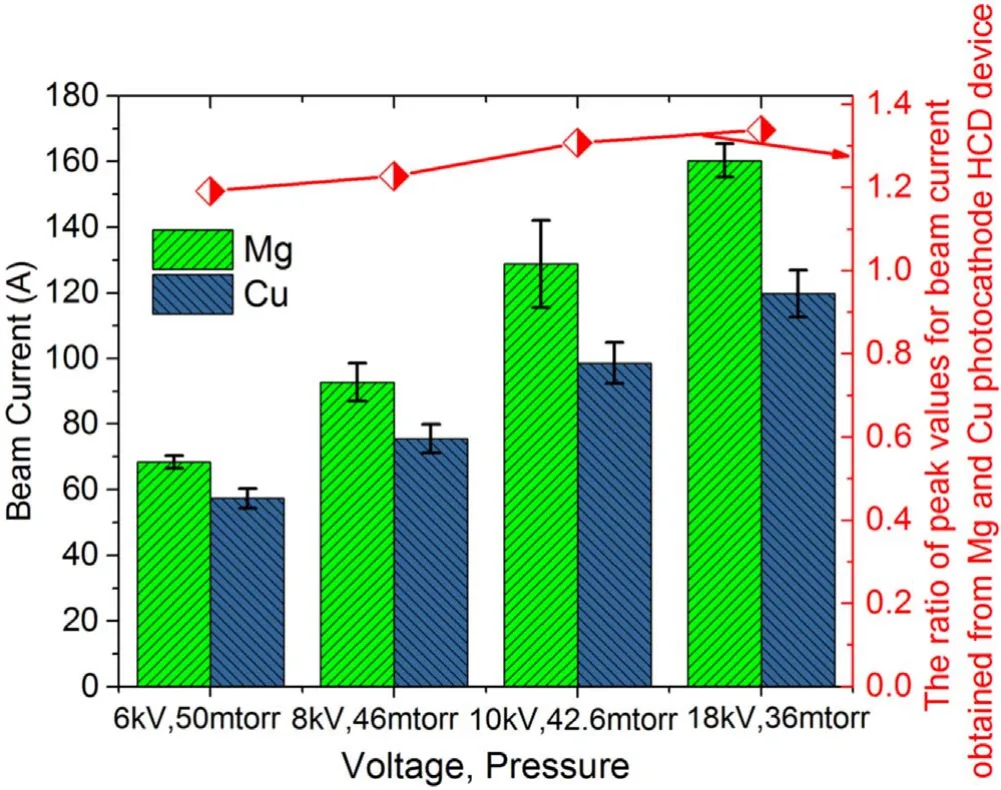
Figure 8.The peak values of electron-beam currents generated by two different photocathodes under the same external conditions.
The results presented in figures 7 and 8 demonstrate that the Mg-photocathode-based HCD device generates a higher electron-beam current, while the beam pulse duration is slightly increased at the same time.As a low work-function material, the Mg photocathode is capable of generating more seed electrons under the same optical-trigger conditions.As a result, the gas-ionization and plasma-formation processes are promoted in both the hollow cathode and the main gap for the Mg-photocathode-based HCD device.However, as presented in the above sections, the triggering photoelectrons and subsequent ionization processes mainly promote the formation of a virtual anode and the main discharge process,but following the trigger processes, the subsequent photoemission that is due to the low work function of the material in the hollow cathode does not cause more low-energy electron generation.Therefore, the efficient optical-trigger device based on the photoelectric effect of the lower work-function material is capable of improving the amplitude of the electron-beam current but slightly impacts the electron-pulse duration,which is favorable for applications based on multiple energetic electron beams.
4.Conclusions
HCD is characterized by its high current and very fast breakdown, which are highly dependent on its hollow-cathode configuration.Multiple works and studies of HCD are mainly focused on the influence of the hollow-cathode structure on high-efficiency discharge and multiple energetic electron-beam generation.Regarding the condition of a sufficient electron current for triggering, the hollow cathode served as a hollow anode with respect to the trigger to analyze discharge-formation processes in the pre-breakdown stage[28].In order to further study the triggered-discharge-formation process, microsecond-time-scale optical-trigger experiments with insufficient seed electrons are introduced.In this paper,a model based on the classical plane-parallel model but modified for the hollow-cathode-influenced positive space-charge formation process is presented.The HCD spacecharge formation model is validated by the results obtained from optical-trigger experiments using two cathode materials,Cu and Mg, with different discharge voltages.In addition,electron-beam generation is also investigated by optically triggered HCD experiments for Mg- and Cu-photocathodebased devices.The conclusions can be summarized as follows:
(1) In an HCD device, the discharge-formation process is mostly relevant to the positive space-charge formation process,which is influenced by the penetrating electricfield distribution in the hollow cathode.Therefore, the trigger delay is mainly quantitatively dependent on the positive space-charge formation rate or the gas-iondensity growth rate, which is determined by the penetrating electric-field depth described by our model.
(2) Both the theoretical model and the experimental results demonstrate that in the positive space-charge formation and movement process, the effect of initial seedingelectron density is dominant, which is described quantitatively by our model.In an optically triggered HCD, the ion-density growth rate is increased by an increasing applied voltage and a higher seed-electron density is obtained from a lower work-function material, resulting in a short delay.
(3) The electron-beam measurement results demonstrate that a more efficient trigger device is capable of generating an electron beam with higher amplitude and density.However, the trigger electrons mainly promote initial high-energy electron formation.As a result, the collision loss and low-energy electron generation are not influenced by the trigger efficiency,therefore the electron-beam duration does not vary by much, which also matches our model description.
ORCID iDs
Weijie HUO (霍卫杰) https://orcid.org/0000-0002-1533-2986
猜你喜欢
天天爱科学(2022年4期)2022-05-23
当代陕西(2022年5期)2022-04-19
当代陕西(2020年23期)2021-01-07
当代陕西(2020年16期)2020-09-11
当代陕西(2020年13期)2020-08-24
当代陕西(2019年23期)2020-01-06
当代陕西(2019年9期)2019-05-20
陕西画报(2018年4期)2018-10-15
红岩(2017年6期)2017-11-28
中国文艺评论(2017年5期)2017-06-10
 Plasma Science and Technology2021年1期
- Plasma Science and Technology的其它文章
- First results of negative ion extraction with Cs for CRAFT prototype negative beam source
- Manipulation and optimization of electron transport by nanopore array targets
- Modulational instability of the coupled waves between fast magnetosonic wave and slow Alfvén wave in the laser-plasma interaction
- Dense positrons and γ-rays generation by lasers interacting with convex target
- Linear gyrokinetic simulations of reversed shear Alfvén eigenmodes and ion temperature gradient modes in DIII-D tokamak
- Design and performance study of a gas-Cherenkov detector with an off-axis parabolic reflector for inertial confinement fusion experiments