绕极深层水入侵阿蒙森海陆架的路径及其性质
2021-03-05 02:13白雨赵亮李磊
极地研究 2021年4期
白雨 赵亮 李磊
研究论文
绕极深层水入侵阿蒙森海陆架的路径及其性质
白雨1赵亮1李磊2
(1天津科技大学海洋与环境学院, 天津 300457;2中国海洋大学海洋与大气学院, 山东 青岛 266100)
近几十年来较暖的绕极深层水(Circumpolar Deep Water, CDW)不断入侵阿蒙森海陆架, 使冰架底部融化, 导致阿蒙森海冰架质量不断损失。分析CDW入侵阿蒙森海陆架的路径及性质变化, 对研究冰架变薄和接地线后退具有重要意义。基于GLORYS12V1[Global Ocean (1/12)° Physical Reanalysis]再分析数据, 对阿蒙森海西侧、中央、东侧通道的体积输运和热输运进行了计算, 给出了陆架上CDW温度和盐度的变化特征, 并分析了它们与流场间的关系。结果表明, Dotson-Getz海槽内的CDW主要源自西侧通道, Pine Island海槽内的CDW主要源自中央通道和东侧通道。由东侧通道入侵的CDW温度最高, 西侧入侵的CDW温度最低。CDW通过西侧通道入侵陆架的体积输运和热输运在时间序列上呈现微弱的上升趋势。CDW通过中央通道向Pine Island海槽的体积输运和热输运约是东侧通道的2倍。CDW进入海槽时的温度主要受两方面影响, 一方面与入侵陆架时的温度有关, 一方面又被后续的混合过程所控制。
绕极深层水 阿蒙森海陆架 流场结构 体积输运 热输运
0 引言
近几十年来南极冰盖质量不断损失[1], 特别是西南极冰盖在加速消融, 融化速率为每年97±13 Gt[2], 最大损失出现在阿蒙森海和别林斯高晋海[3]。南极冰盖的融化对海平面变化具有重要影响[4-5], 仅阿蒙森海区域就有使海平面升高约1.5 m的潜力, 如果阿蒙森海的冰川加倍入海将导致海平面每世纪上升5 cm[6], 对世界各地的沿海地区造成威胁[7-8]。此外, 冰架融化向海洋注入的融冰水还会对全球气候造成影响, 延缓全球气候变暖的趋势[9]。
阿蒙森海范围内的冰架融化主要受到绕极深层水(Circumpolar Deep Water, CDW) 的影响[10-11], CDW随着南极绕极流(Antarctic Circumpolar Current, ACC)不断输运, 其南部边界(Southern Boundary of the Antarctic Circumpolar Current, SBACC)在该海域可以接近大陆边缘[12], 温暖的CDW沿着大陆架边缘的潜流向东流动, 在近岸大陆架坡折处, 通过海底通道不断上涌入侵陆架[13-14]。目前已观测到, 在2007年CDW通过阿蒙森海东部陆架的西侧通道进入陆架, 体积通量为2.34× 10⁵m3·s–1, 热通量为2.8 TW[13]。通过模型模拟也再现了这个过程, 并且发现在其他位置也存在类似入侵过程[15]。在2013年通过水文数据验证了CDW从东侧和中央通道进入陆架, 对Pine Island冰架(Pine Island Ice Shelf, PIIS)的融化起重要贡献[16]。CDW上涌入侵陆架的时间与局部风场强迫有关, 在东风增强的时期通常伴随较大的流入量[17]。这种入侵陆架的过程除了与风场强迫有关还与海流和地形的交互作用有关, 在陆架坡折处, 陆坡流受埃克曼运输作用可以向阿蒙森海东部陆架深处输送深水[18]。在陆架上的CDW通常温度较高, 在暖冰腔过程的作用之下不断融化上覆冰架[19]。入侵性CDW的温度被其厚度所控制[16], 而厚度呈现出季节性变化, 冬季比夏季约厚49 dbar[20], 这种季节性变化可以通过风的水平方向变化和海冰漂移所引起的埃克曼抽吸现象所解释[21]。
随着南极冰架与海洋的相互作用日益受到关注[22], 确定CDW流向南极冰架的路径及其性质, 对研究冰架变薄和接地线后退的现象具有重大意义。目前, 相关研究主要通过建立模型模拟CDW的入侵过程或通过观测数据分析CDW入侵后的温盐变化, 缺乏两者之间的联系。此外由于阿蒙森海是一个典型的数据匮乏区域[23], 在海冰的限制下几乎不存在冬季的观测数据, 在夏季也缺乏连续观测数据, 较难对CDW入侵陆架的过程进行连续的过程分析。因此本文采用了全球海洋资料同化再分析数据[Global Ocean (1/12)° Physical Reanalysis, GLORYS12V1]对CDW入侵阿蒙森海陆架的路径及其性质进行分析与探讨。
1 数据与方法
本文的研究区域是阿蒙森海陆架海域, 水深数据来自GLORYS12V1, 水深分布及研究断面如图1所示, 阿蒙森海大陆架从东向西逐渐变窄, 平均深度约为500 m。在研究区域内存在两个主要的海槽系统, 分别为Dotson-Getz海槽和Pine Island海槽, 最大深度都超过1600 m[24]。Dotson- Getz海槽内的CDW主要来自西侧通道, 该海槽内的CDW主要影响Getz冰架(GIS)和Dotson冰架(DIS); Pine Island海槽内的CDW主要来自中央和东侧通道, 该海槽内的CDW主要影响Thwaites冰架(TIS)、PIIS、Cosgrove冰架(CIS)和Abbot冰架(AIS)。TIT和BI分别表示Thwaites冰舌和Burke岛, 等值线分别表示了500 m和700 m等深线。相关研究已证实CDW可以通过海底通道上涌入侵大陆架, 并且在b、c、f断面处都发现了这种过程[14,16,25]。在本文研究中, 根据地理位置及水深结构补充并分析了a、d、e和g 4个新的断面。
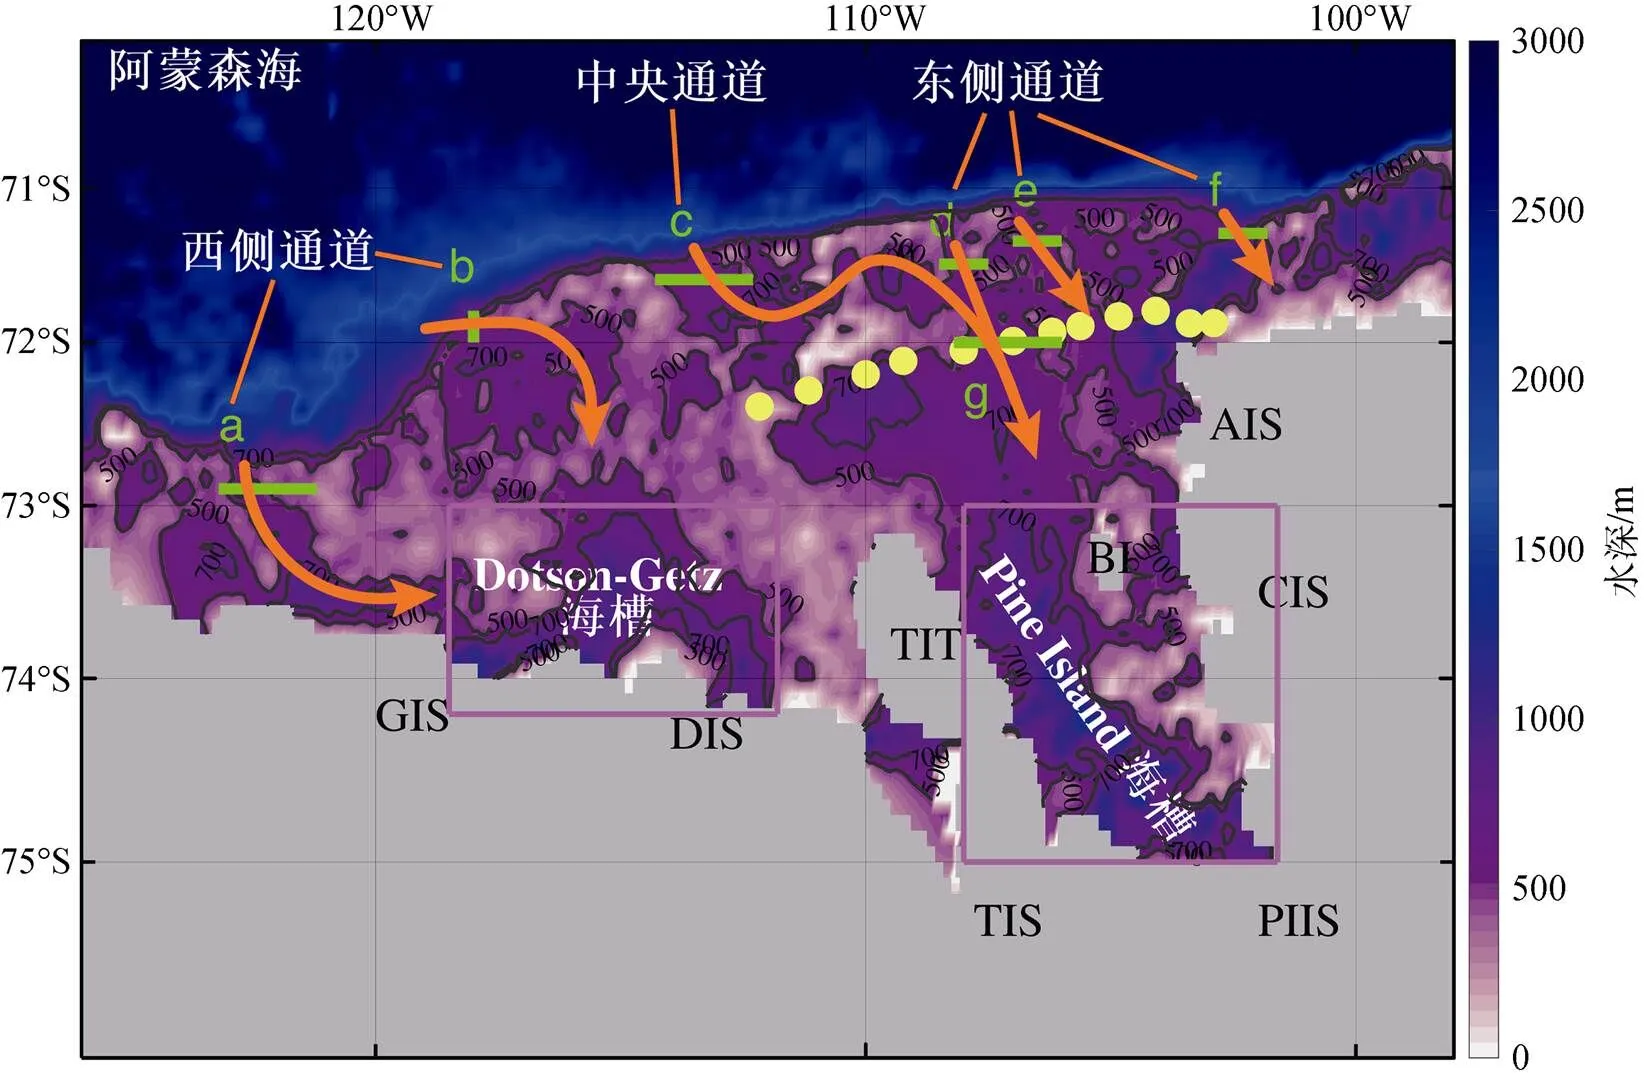
图1 阿蒙森海CDW入侵路径及研究断面示意图.绿色线段代表研究断面, 橙色箭头代表CDW入侵路径示意图, 黄色圆点代表验证断面, 紫色方框代表海槽范围, GIS、DIS、TIS、PIIS、CIS、AIS、TIT和BI分别表示Getz冰架、Dotson冰架、Thwaites冰架、Pine Island冰架、Cosgrove冰架、Abbot冰架、Thwaites冰舌和Burke岛
Fig.1.Schematic diagram of CDW intrusion pathways and study sections in the Amundsen Sea.The green line segment represents the study section, the orange arrow represents the invasion path of CDW, the yellow dot represents the validation section, and the purple box represents the extent of the trough.GIS, DIS, TIS, PIIS, CIS, AIS, TIT and BI represent the Getz Ice Shelf, Dotson Ice Shelf, Thwaites Ice Shelf, Pine Island Ice Shelf, Cosgrove Ice Shelf, Abbot Ice Shelf, Thwaites Ice Tongue and Burke Island
本文采用了基于CMEMS(Copernicus Marine Environment Monitoring Service)系统提供的全球海洋资料同化再分析数据GLORYS12V1(数据来源: http://marine.copernicus.eu/services-portfolio/ access-to-products/), 数据水平分辨率为(1/12)°, 垂向分层为50层。该再分析系统使用的数值模式是NEMO(Nucleus for European Modelling of the Ocean)3.1版本, 同时耦合了海冰模式LIM2 (Louvain-la-Neuve Sea Ice Model), 其大气强迫采用ERA-interm(European Centre for Medium- Range Weather Forecasts interim Re-Analysis)[26]。该模型通过降阶卡尔曼滤波器同化了高程卫星提供的沿轨道高度计数据、AVHRR(Advanced Very High Resolution Radiometer)提供的卫星海表面温度数据、CERSAT(Centre de Recherche et d’Exploitation Satellitaire)提供的海冰密集度, CMEMS CORAv4.1(Coriolis Ocean Dataset for Reanalysis)数据库提供的现场温度和盐度的垂直剖面数据等数据, 并利用3D-VAR方案对温度和盐度的偏差进行修正[27]。
在本研究中通过中性密度(γ)[28]定义了CDW,γ取28 kg·m–3定义为CDW的上边界,γ取28.27 kg·m–3定义为CDW的下边界[29], 上、下边界之间的距离为CDW的厚度, 并以该层厚范围内的温度、盐度、流场分析CDW的性质变化。在西侧、中央和东侧通道范围内的7个断面处, CDW的体积输运()和热输运()的计算公式如下:
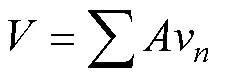
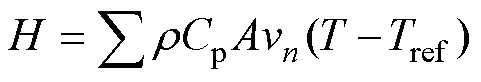
式中,表示网格面积,v表示断面处流速法向分量,表示海水密度,p表示定压比热容,和ref分别表示入流或出流海水温度和参考温度, 参考温度为冰点温度取–1.9℃。
2 数据验证
本文选取的验证断面位置如图1中的黄色圆点所示, 采用的验证数据来自号考察船(ANT-XXVI/3)2010年在南极阿蒙森海获取的实测CTD(Conductivity-Temperature-Depth)数据[30], 使用的测量设备是Seabird 911+ CTD (SN 561), 附带有24个采水瓶[16]。如图2所示, 阿蒙森海陆架范围主要存在3种水团[25]: 在300 m以浅的深度范围主要为南极表层水(Antarctic Surface Water, AASW)和冬季水(Winter Water, WW), 在400 m以深的深度范围主要为CDW。根据CDW性质的差异, 又分为上绕极深层水(Upper Circumpolar Deep Water, UCDW)、下绕极深层水(Lower Circumpolar Deep Water, LCDW)和变性绕极深层水(Modified Circumpolar Deep Water, MCDW)。在实测断面中, CDW的核心温度为1.18℃, 核心盐度为34.7[16]。根据最高温度和最大盐度分别定义了UCDW和LCDW[14], 其温度最大值约为1.57℃,盐度最大值约为34.73。CDW入侵陆架的过程中, 不断与上层水团发生混合, 逐渐转变为相对低温的MCDW[31]。相比之下, 在GLORYS12V1中CDW的温度最大值偏低, 约为1.29℃, 盐度最大值与CTD数据相差不大, 约为34.74。GLORYS12V1与CTD数据的相关性较高, 温度相关系数为0.85, 盐度相关系数为0.92。
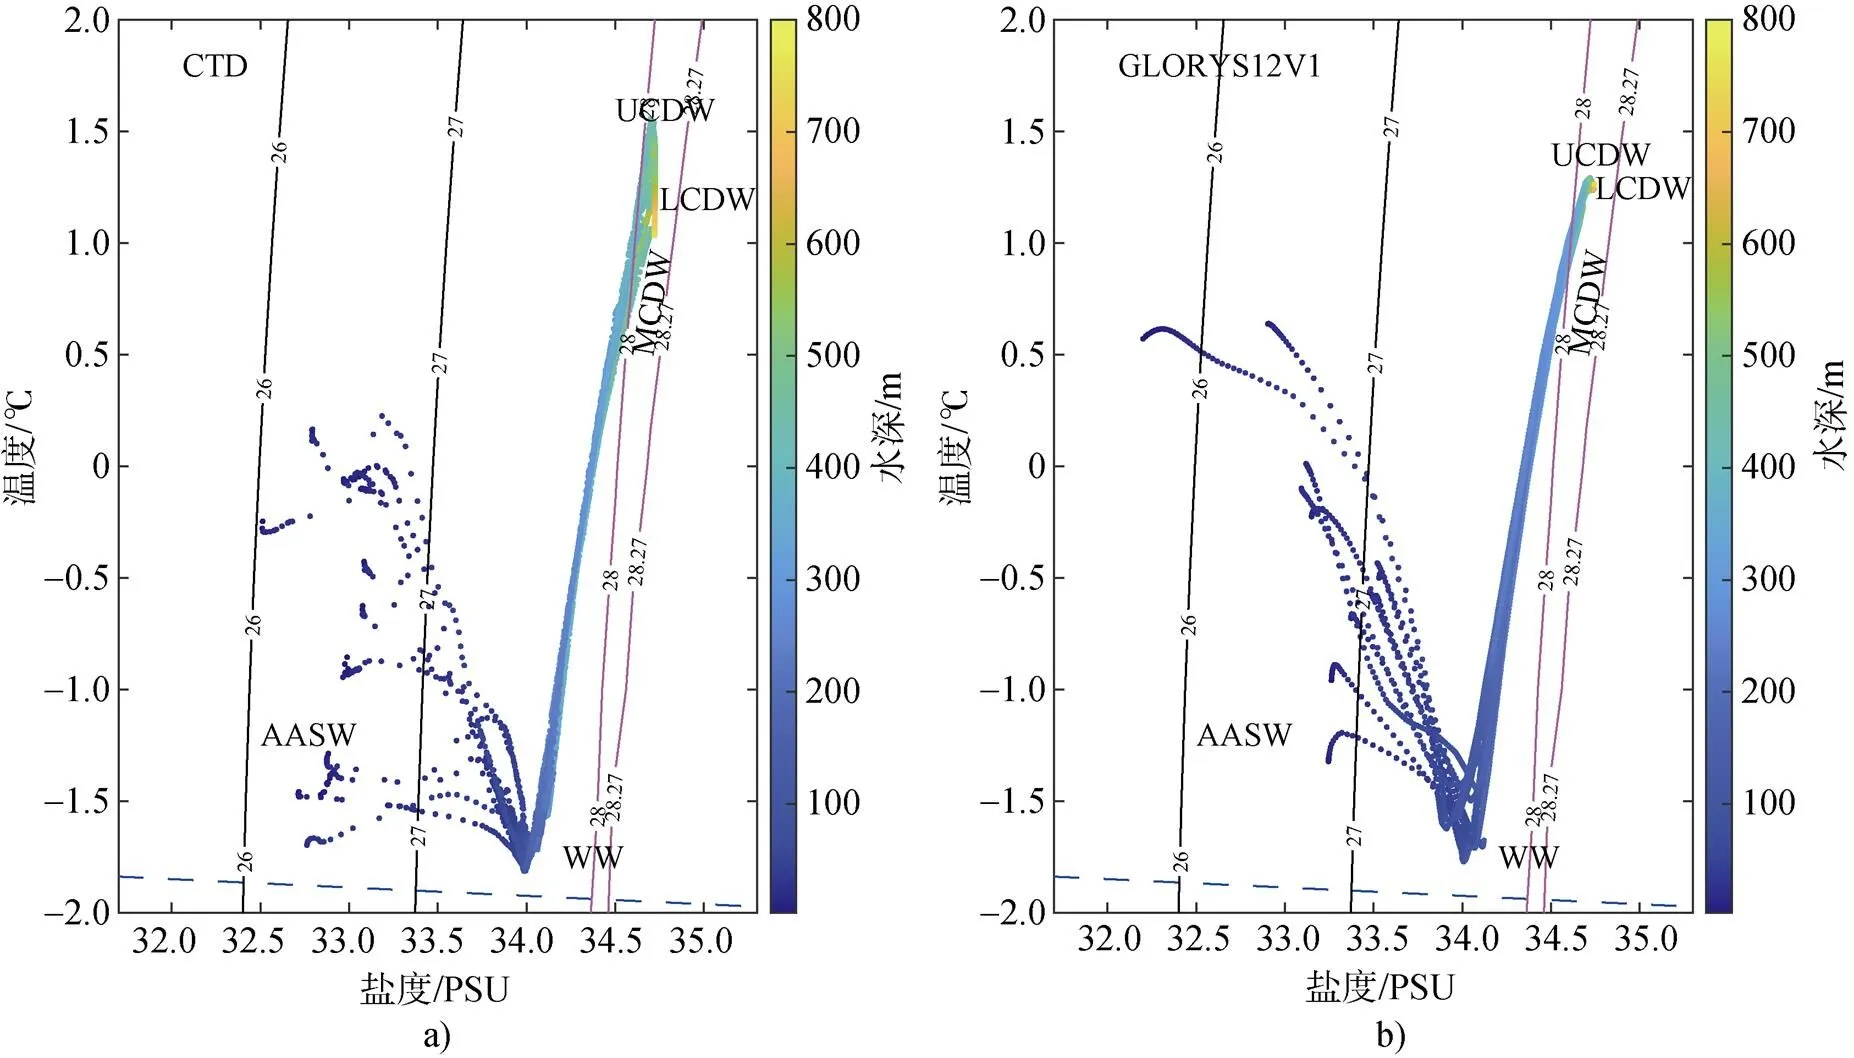
图2 验证断面处的温盐点聚图.a) CTD温盐点聚图, b) GLORYS12V1温盐点聚图
Fig.2.-diagram of the validation section.a)-diagram of CTD; b)-diagram of GLORYS12V1
如图3所示, 在GLORYS12V1和CTD数据中, CDW上边界位置都与1℃等值线较为接近, 在西侧都略浅于1℃等值线, 在东侧都略深于1℃等值线, 且CDW的平均温度分别为(1.19±0.09)℃和(1.24±0.15)℃, 平均差值分别为0.07℃和0.13℃。虽然CDW的温度在CTD断面中更高, 但总体上2个断面中CDW的温度都呈现东高西低的分布特征。此外, CDW上边界位置与34.6等值线较为接近, 在400 m以深的东侧陆架底部呈现高盐特征。在GLORYS12V1和CTD数据中, CDW的平均盐度分别为34.70±0.04和34.70±0.03, 平均差值分别为0.03和0.02。综上所述, 虽然CTD数据与GLORYS12V1数据存在一些差异, 但总体上GLORYS12V1数据可以表现出CDW高温高盐的性质及其分布特征。
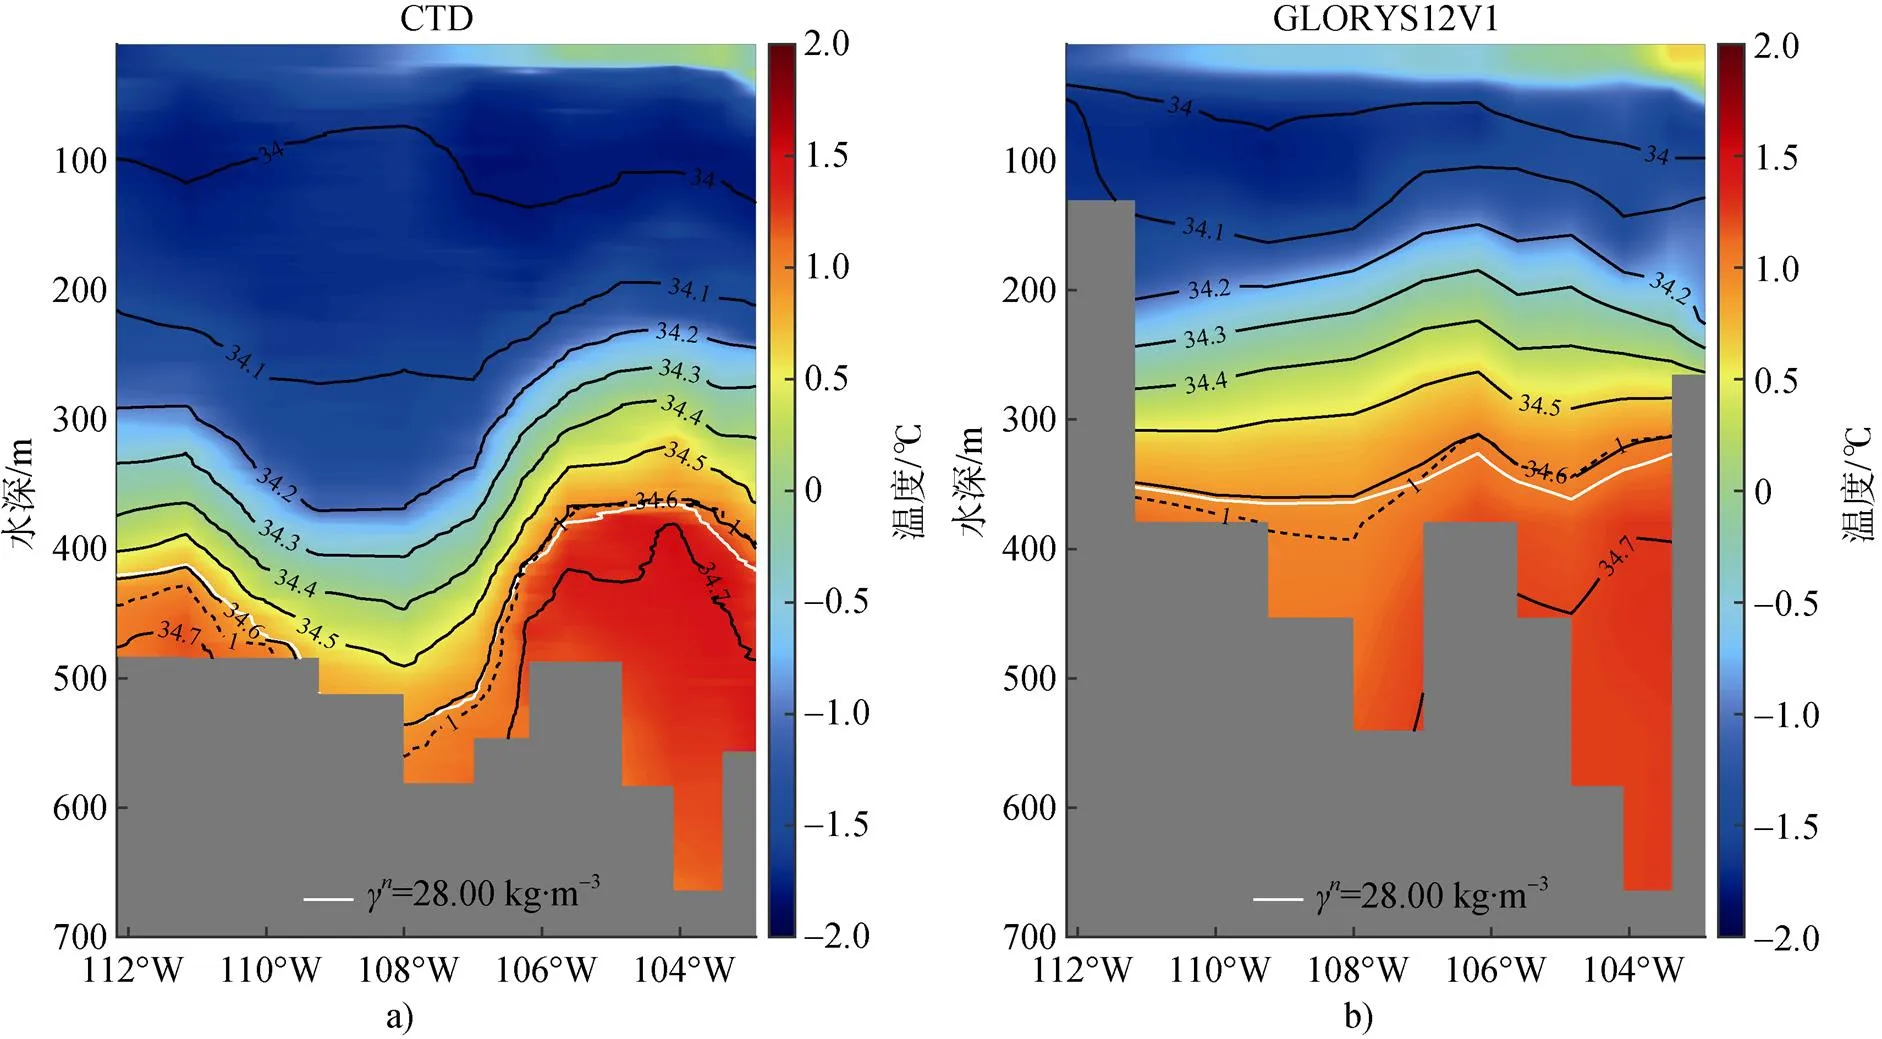
图3 验证断面温盐分布图.a) CTD温盐分布, b) GLORYS12V1温盐分布.黑色虚线代表1℃等值线, 黑色实线代表盐度等值线, 白色实线表示CDW上边界, γn=28 kg·m–3
Fig.3.Temperature and salinity distribution of the validation section.a) temperature and salinity distribution of CTD; b) temperature and salinity distribution of GLORYS12V1.The dashed black line indicates the 1℃ isotherm.The solid black lines indicate the salinity contours.The solid white line indicates the upper boundary of CDW,γ=28 kg·m–3
3 结果与讨论
根据1993—2017年多年的平均流场结构, 给出西侧、中央和东侧3个通道断面处的体积输运及热输运变化, 讨论了流场对温盐性质变化的影响。
3.1 绕极深层水入侵路径及性质
CDW上涌入侵陆架的物理机制主要包括在陆架上由冰架融化驱动的深层流, 沿岸流与海槽的相互作用, 罗斯贝波沿着陆架坡折处与海槽的相互作用这三个方面[32]。此外, 涡流在入侵过程中也起到重要作用, 其诱导的输运主要集中在远离摩擦边界的中间层[33]。CDW的入侵位置与地形特征有关, 其入侵过程主要发生在陆架坡折处[34]。在阿蒙森海, CDW沿着ACC的路径向东输送, 在ACC与罗斯涡流的分叉附近(120°W~110°W之间)向南弯曲靠近阿蒙森海大陆坡, 观测结果表明在110°W存在沿大陆架向东的潜流, 由东向正压流诱导的埃克曼输运将115°W以东的暖深层水抽吸送入海槽之中[18]。在南极陆坡流附近的一些细微的地形变化也会影响其上涌过程, 如在海床阶梯状下沉的区域也会促进上涌过程[35], 而这种入侵过程的季节性变化还与南极陆坡流的季节性周期有关[36]。
CDW入侵陆架的过程如图1所示。从西侧通道入侵陆架的CDW主要向Dotson-Getz海槽附近输运。从中央通道入侵陆架的CDW在科氏力的作用下[16]会先向东输运, 与东侧通道d断面入侵陆架的CDW发生混合, 混合后的CDW经过g断面继续向南延伸进入Pine Island海槽。从东部通道的e、f断面入侵陆架的CDW主要向东输运, 进入别林斯高晋海陆架。CDW进入海槽后, 由于其温度相对较高, 会不断造成冰架底部融化[37]。从图4a可以看出, CDW上边界位置在a和g温度断面上与1℃等值线基本重叠, 在b~f温度断面上深于1℃等值线。从图4b可以看出, CDW上边界位置均略深于34.6等值线, 且在b~g断面存在盐度大于34.7的高盐CDW。从图4c可以看出, CDW在b断面处的流速最快, 其核心区域流速超过0.02 m·s–1。在c、d断面处, CDW主要从断面中部流入陆架, 从两侧流出陆架, 在a、f和g断面处, CDW主要从东侧进入陆架, 从西侧流出陆架, 其核心区域流速均达到0.01 m·s–1。
如图5所示, 自1993—2017年CDW的最大温度在a~c断面处呈现先升高后降低的趋势变化, 在d~g断面呈现降低的趋势变化。CDW的盐度变化较小, 但在f断面处的盐度明显增加, 且在2015年存在盐度最大值, 约为34.82。从图5h中可以看出, 25年平均的温盐性质表明CDW在f断面处的温度和盐度最高, 在7个断面中CDW的温度范围约为1.07~1.43℃, 盐度范围约为34.64~34.74。
3.2 绕极深层水体积输运及热输运变化
在西侧通道(a、b断面)处, 1993至2017年期间CDW经过a、b断面的平均体积输运分别为2.16×10⁴m3·s–1、2.55×10⁴m3·s–1, 在时间序列上呈现微弱的上升趋势,值均小于0.01, 表明CDW向Dotson-Getz海槽中的输运量不断增加。在CDW不断入侵陆架的过程中携带大量的热量, 经过a、b断面的热输运分别为0.27 TW、0.33 TW。根据表1所示, b断面处的体积输运方差及热输运方差均为7个断面中的最低值, 表明该断面处的年际差异最小。
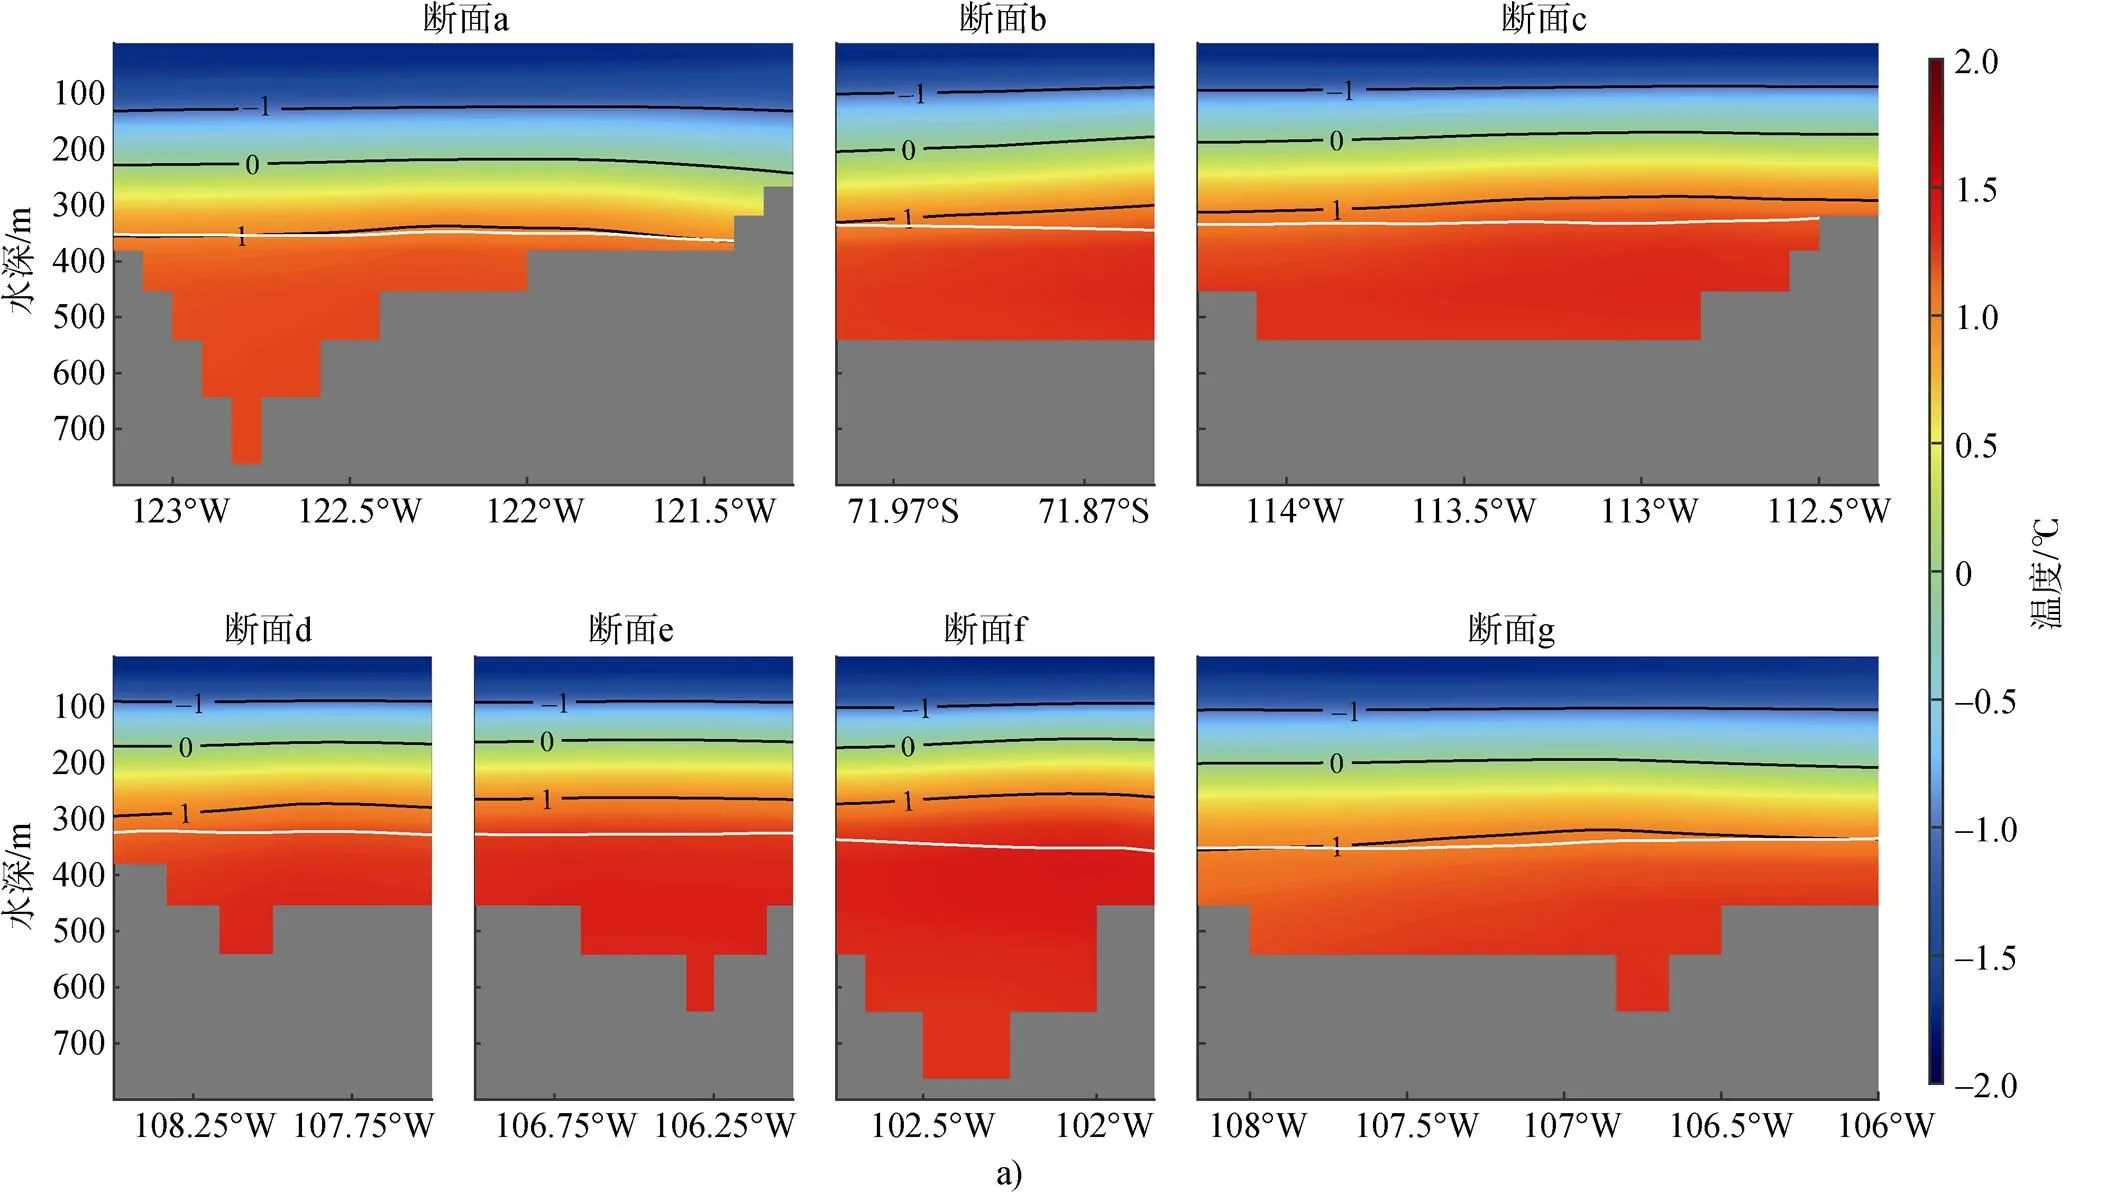
Fig.4.Vertical sections of average temperature, salinity and normal velocity distribution from 1993 to 2017.a) temperature; b) salinity; c) normal velocity distribution.The white contours indicate the upper boundary of CDW,γ=28 kg·m–3.Positive value in c) indicates the inflow to the Amundsen Sea shelf
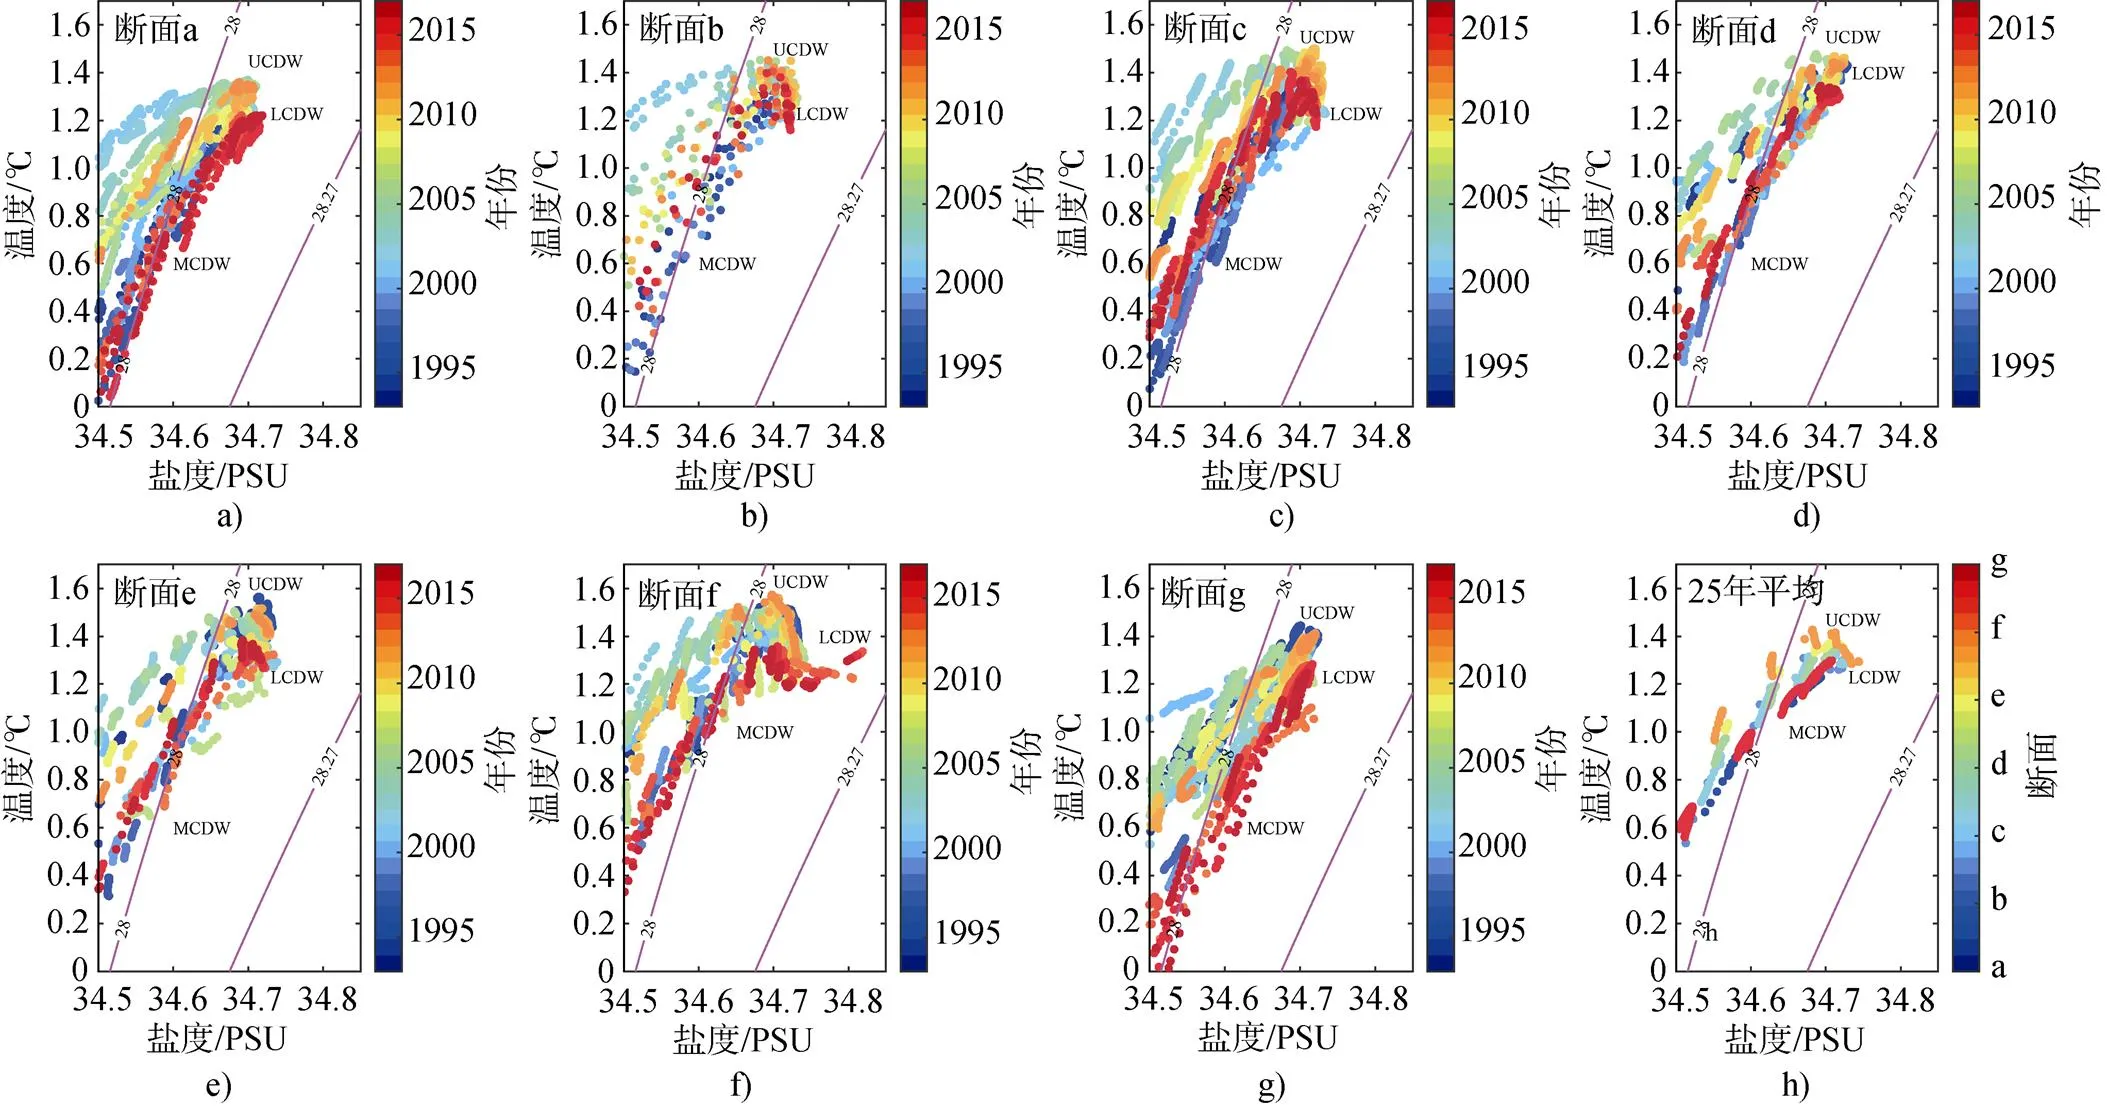
图5 1993—2017年断面处的温盐点聚图.a) 断面a; b) 断面b; c) 断面c; d) 断面d; e) 断面e; f) 断面f; g) 断面g; h) 25年平均
Fig.5.-diagram of the vertical section from 1993 to 2017.a) section a; b) section b; c) section c; d) section d; e) section e; f) section f; g) section g; h) average data of 25 years
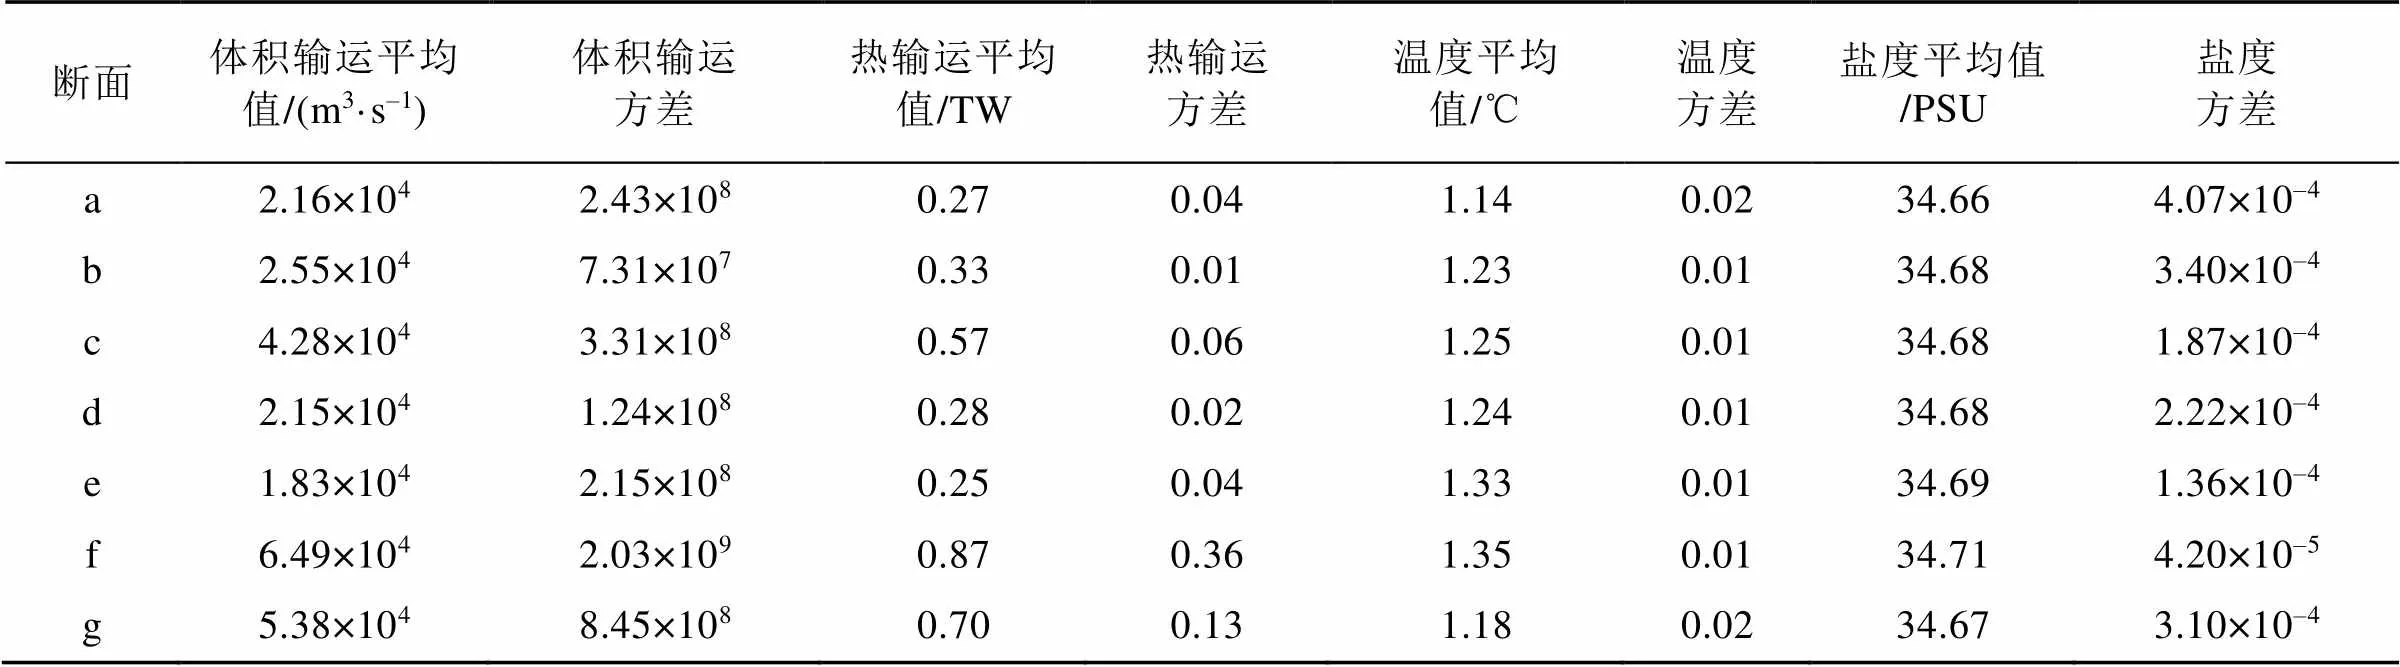
表1 1993—2017年a~g断面处CDW体积输运、热输运、温度及盐度的平均值及方差
在中央通道(c断面)和东侧通道(d~f断面)处, 1993至2017年期间CDW经过c~f断面的平均体积输运和热输运分别为4.28×10⁴m3·s–1、2.15× 10⁴m3·s–1、1.83×10⁴m3·s–1、6.49×10⁴m3·s–1和0.57 TW、0.28 TW、0.25 TW、0.87 TW。Pine Island海槽中的CDW主要源自于中央和东侧通道的c、d断面, 其中c断面的体积输运和热输运约是d断面的2倍, 并且CDW经过g断面向Pine Island海槽输送的总体积输运和热输运约是c、d断面之和, 在输运过程中由c、d断面向g断面流动过程中会产生小部分支流损耗, 此外由东侧通道入侵的少量CDW也会向南输运经过g断面。由于d断面和g断面位置较为接近, 在2个断面间的输运过程中产生的支流损耗较少, 因此在年际变化上, d断面与g断面的相关性较高, 相关系数为0.84。在1993年至2017年期间CDW经过g断面进入Pine Island海槽的平均体积输运和热输运分别为5.38×10⁴m3·s–1和0.70 TW。在2000至2007年期间, 经过e断面处的体积输运及热输运呈现显著的下降趋势,值小于0.01。在1993至2017年期间, 体积输运和热输运的峰值均出现在2000年的f断面处, 并且在大多数年份上, f断面的体积输运和热输运均大于其他断面, 经f断面入侵到陆架的CDW主要流向别林斯高晋海陆架, 为别林斯高晋海的冰川融化提供了较暖的CDW。虽然经过西侧、中央和东侧通道的CDW温度存在一定的差异(图6c), 但热输运的变化与体积输运的变化趋势一致(图6a、6b), 相关系数均大于0.99。这与Assmann等[38]的结论一致, 热输运主要受流速控制。

图6 a–g断面处CDW的体积输运、热输运及温度变化情况。a)体积输运; b)热输运; c)温度变化
Fig.6.Variations of volume transport, heat transport and temperature of CDW in section a to g.a) volume transport; b) heat transport; c) temperature
3.3 绕极深层水厚度及温盐分布特征
1993年至2017年期间, 阿蒙森海陆架范围内的CDW平均厚度被水深所限制, 其厚度空间分布情况与水深分布较为接近。如图7所示, 在71°S~72°S附近, CDW经过f断面沿着700 m等深线向西南方向延伸的海域厚度明显较大, 在该区域中厚度普遍大于500 m, 最大厚度可达1200 m, 此外在100°W以东的海域中同样存在较厚的CDW层, 最大厚度约1000 m。在冰架附近的海槽中, CDW厚度也相对较大, 在Pine Island海槽中较厚的CDW分布范围广, 最厚约1100 m, 在Dotson-Getz海槽中的CDW厚度虽然比Pine Island海槽薄, 但最厚处也超过600 m。
在大尺度环流与中纬度CDW性质变化的共同控制下[15], CDW入侵陆架时的温度存在一定的差异(图6c和图8a)。经过西侧通道断面处的平均温度最低, 约1.18℃; 中央通道断面处的温度约1.25℃; 东侧通道断面处的温度最高, 约1.32℃。观测数据也表明从东侧通道入侵的CDW温度高于中央通道, 这种温度差异还与陆架边缘CDW入侵的厚度有关[16], 而陆坡流的埃克曼输运过程又会影响入侵厚度[18]。阿蒙森海陆架范围内CDW的温度和盐度分布特征较为相似(图8), 在大陆架边缘温度和盐度由北向南、由东向西逐渐降低, Dotson-Getz海槽中的温度和盐度明显低于Pine Island海槽, 且最低值均出现在TIS和TIT西侧。东侧较暖的CDW向Pine Island海槽流动的过程中, 会不断与来自中央通道较冷的CDW发生混合, 与此同时, CDW在向南输运的过程中也会与上层较冷的表层水或融冰水发生混合[16]。在这两个过程的影响下, 温度逐渐降低, 最终经过g断面向Pine Island海槽输运时的温度约为1.18℃。
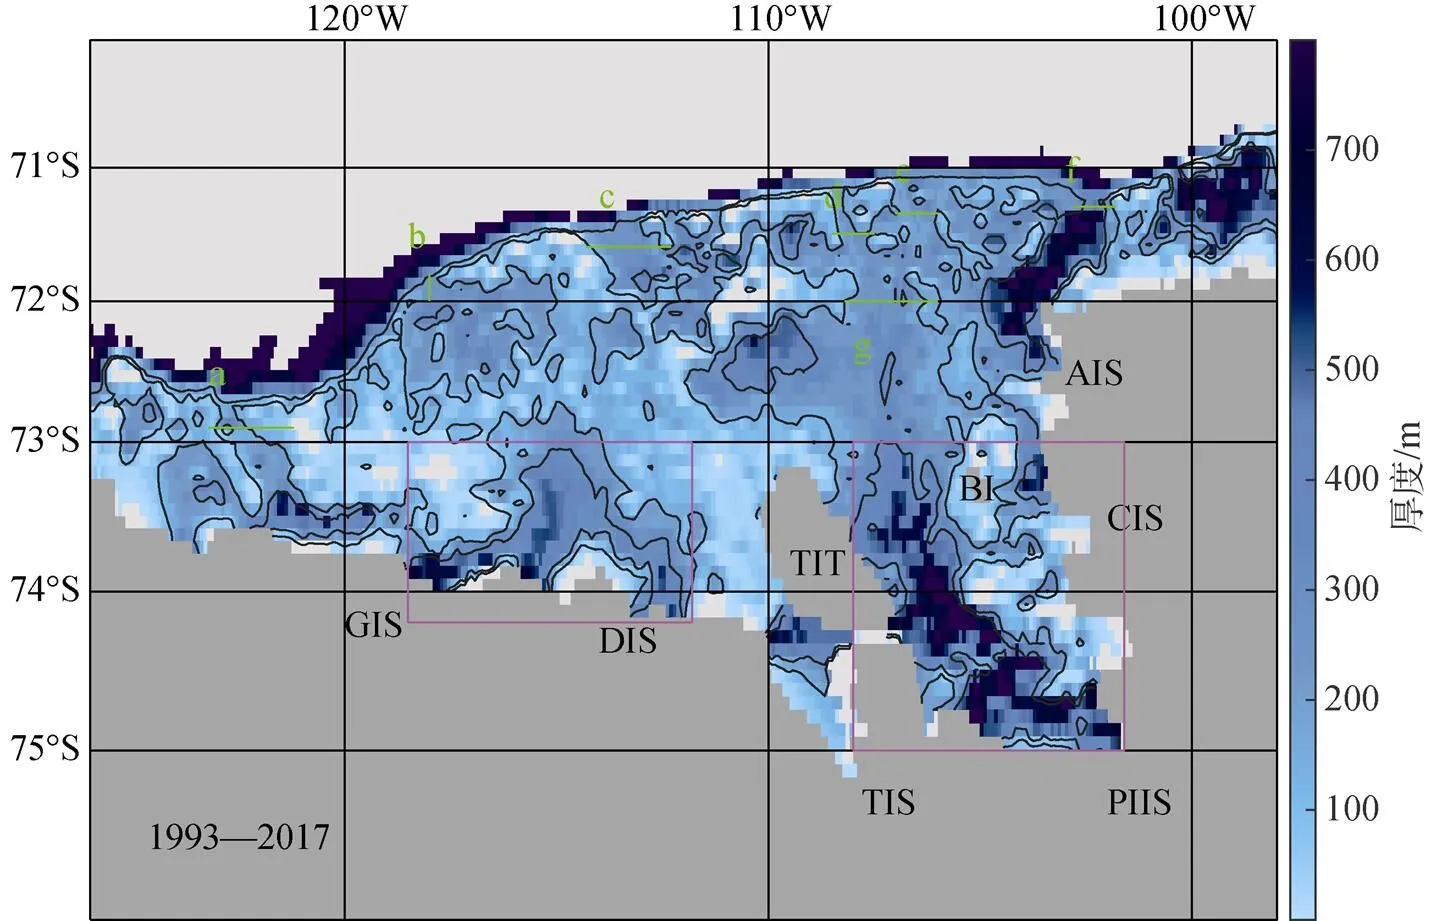
图7 1993—2017年阿蒙森海CDW平均厚度分布
Fig.7.Average thickness distribution of CDW in the Amundsen Sea from 1993 to 2017
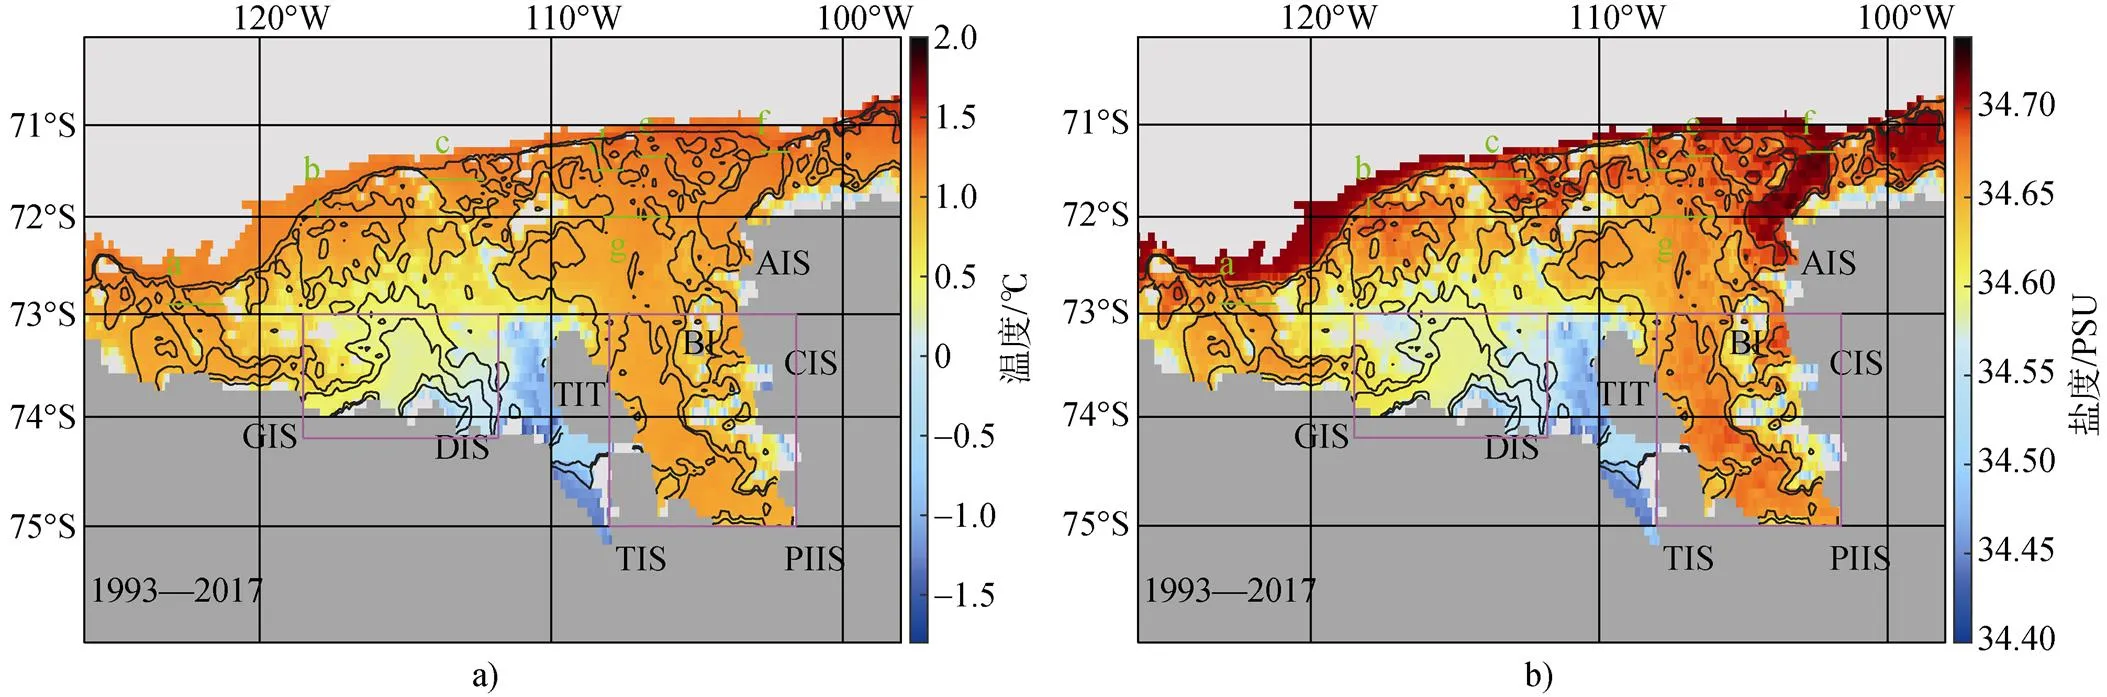
图8 1993—2017年阿蒙森海CDW平均温度和盐度分布(对CDW层内的温盐进行深度平均).a)温度分布; b)盐度分布
Fig.8.Average temperature and salinity distribution of CDW in the Amundsen Sea from 1993 to 2017 (depth-averaged of the temperature and salinity within the CDW layer).a) temperature distribution; b) salinity distribution
3.4 海槽内绕极深层水的性质变化
本文以2013—2016年的变化为例, 阐述CDW温盐性质与流场之间的关系, 由于温度与盐度变化过程基本一致(图10和图11), 因此仅以温度为例阐述其与流场间的关系。如图9和图10所示, 在2013年TIT西北侧, 低温的CDW其流向先指向西北, 在112°W附近流向转变为西南, 进入Dotson-Getz海槽范围, 与此同时在TIT南侧的冷MCDW也向西北流动, 低温的CDW与冷MCDW沿着该路径不断与Dotson-Getz海槽内相对较暖的CDW发生混合, 使其温度不断下降, 在2014年可以发现Dotson-Getz海槽内的CDW温度明显变低。2015年与2016年流场分布结构比较相似, 但2016年的流速明显较大, 在TIT东侧的冷MCDW沿着TIT边界不断向Pine Island海槽流动, 此外在2014年TIT的东北侧也存在向Pine Island海槽输运的东南流。在2013—2016年期间, TIT西侧的冷MCDW随着流场不断向外扩散, 逐渐影响两个海槽内的温盐性质。
如图11所示, 在2001年, Dotson-Getz海槽中的CDW温度明显升高, 并且在后续几年内, 温度不断上升。在2014年, 两个海槽中的CDW温度明显降低, 且在Dotson-Getz海槽内温度差异较大。从图6c中可以看出, 在2001年CDW通过a、b断面时的温度明显升高, 并且在后续几年仍处于较高温度, 在2014年经过断面入侵陆架的CDW温度明显低于其他年份, 并且g断面的温度变化较为显著, 随着流入Pine Island海槽的CDW温度变低, Pine Island海槽内的整体温度也明显变低。CDW除了入侵陆架时的温度存在一定的差异, CDW入侵陆架后的性质还受到流场结构变化的影响。在温盐方面, 随着流场结构的变化, 较高温盐的CDW与较低温盐的CDW在输运过程中

图9 2013—2016年CDW的流场分布(对CDW层内的流速进行深度平均).a)2013年; b)2014年; c)2015年; d)2016年
Fig.9.Flow field distribution of CDW from 2013 to 2016 (depth-averaged of the velocity within the CDW layer).a) 2013; b) 2014; c) 2015; d) 2016
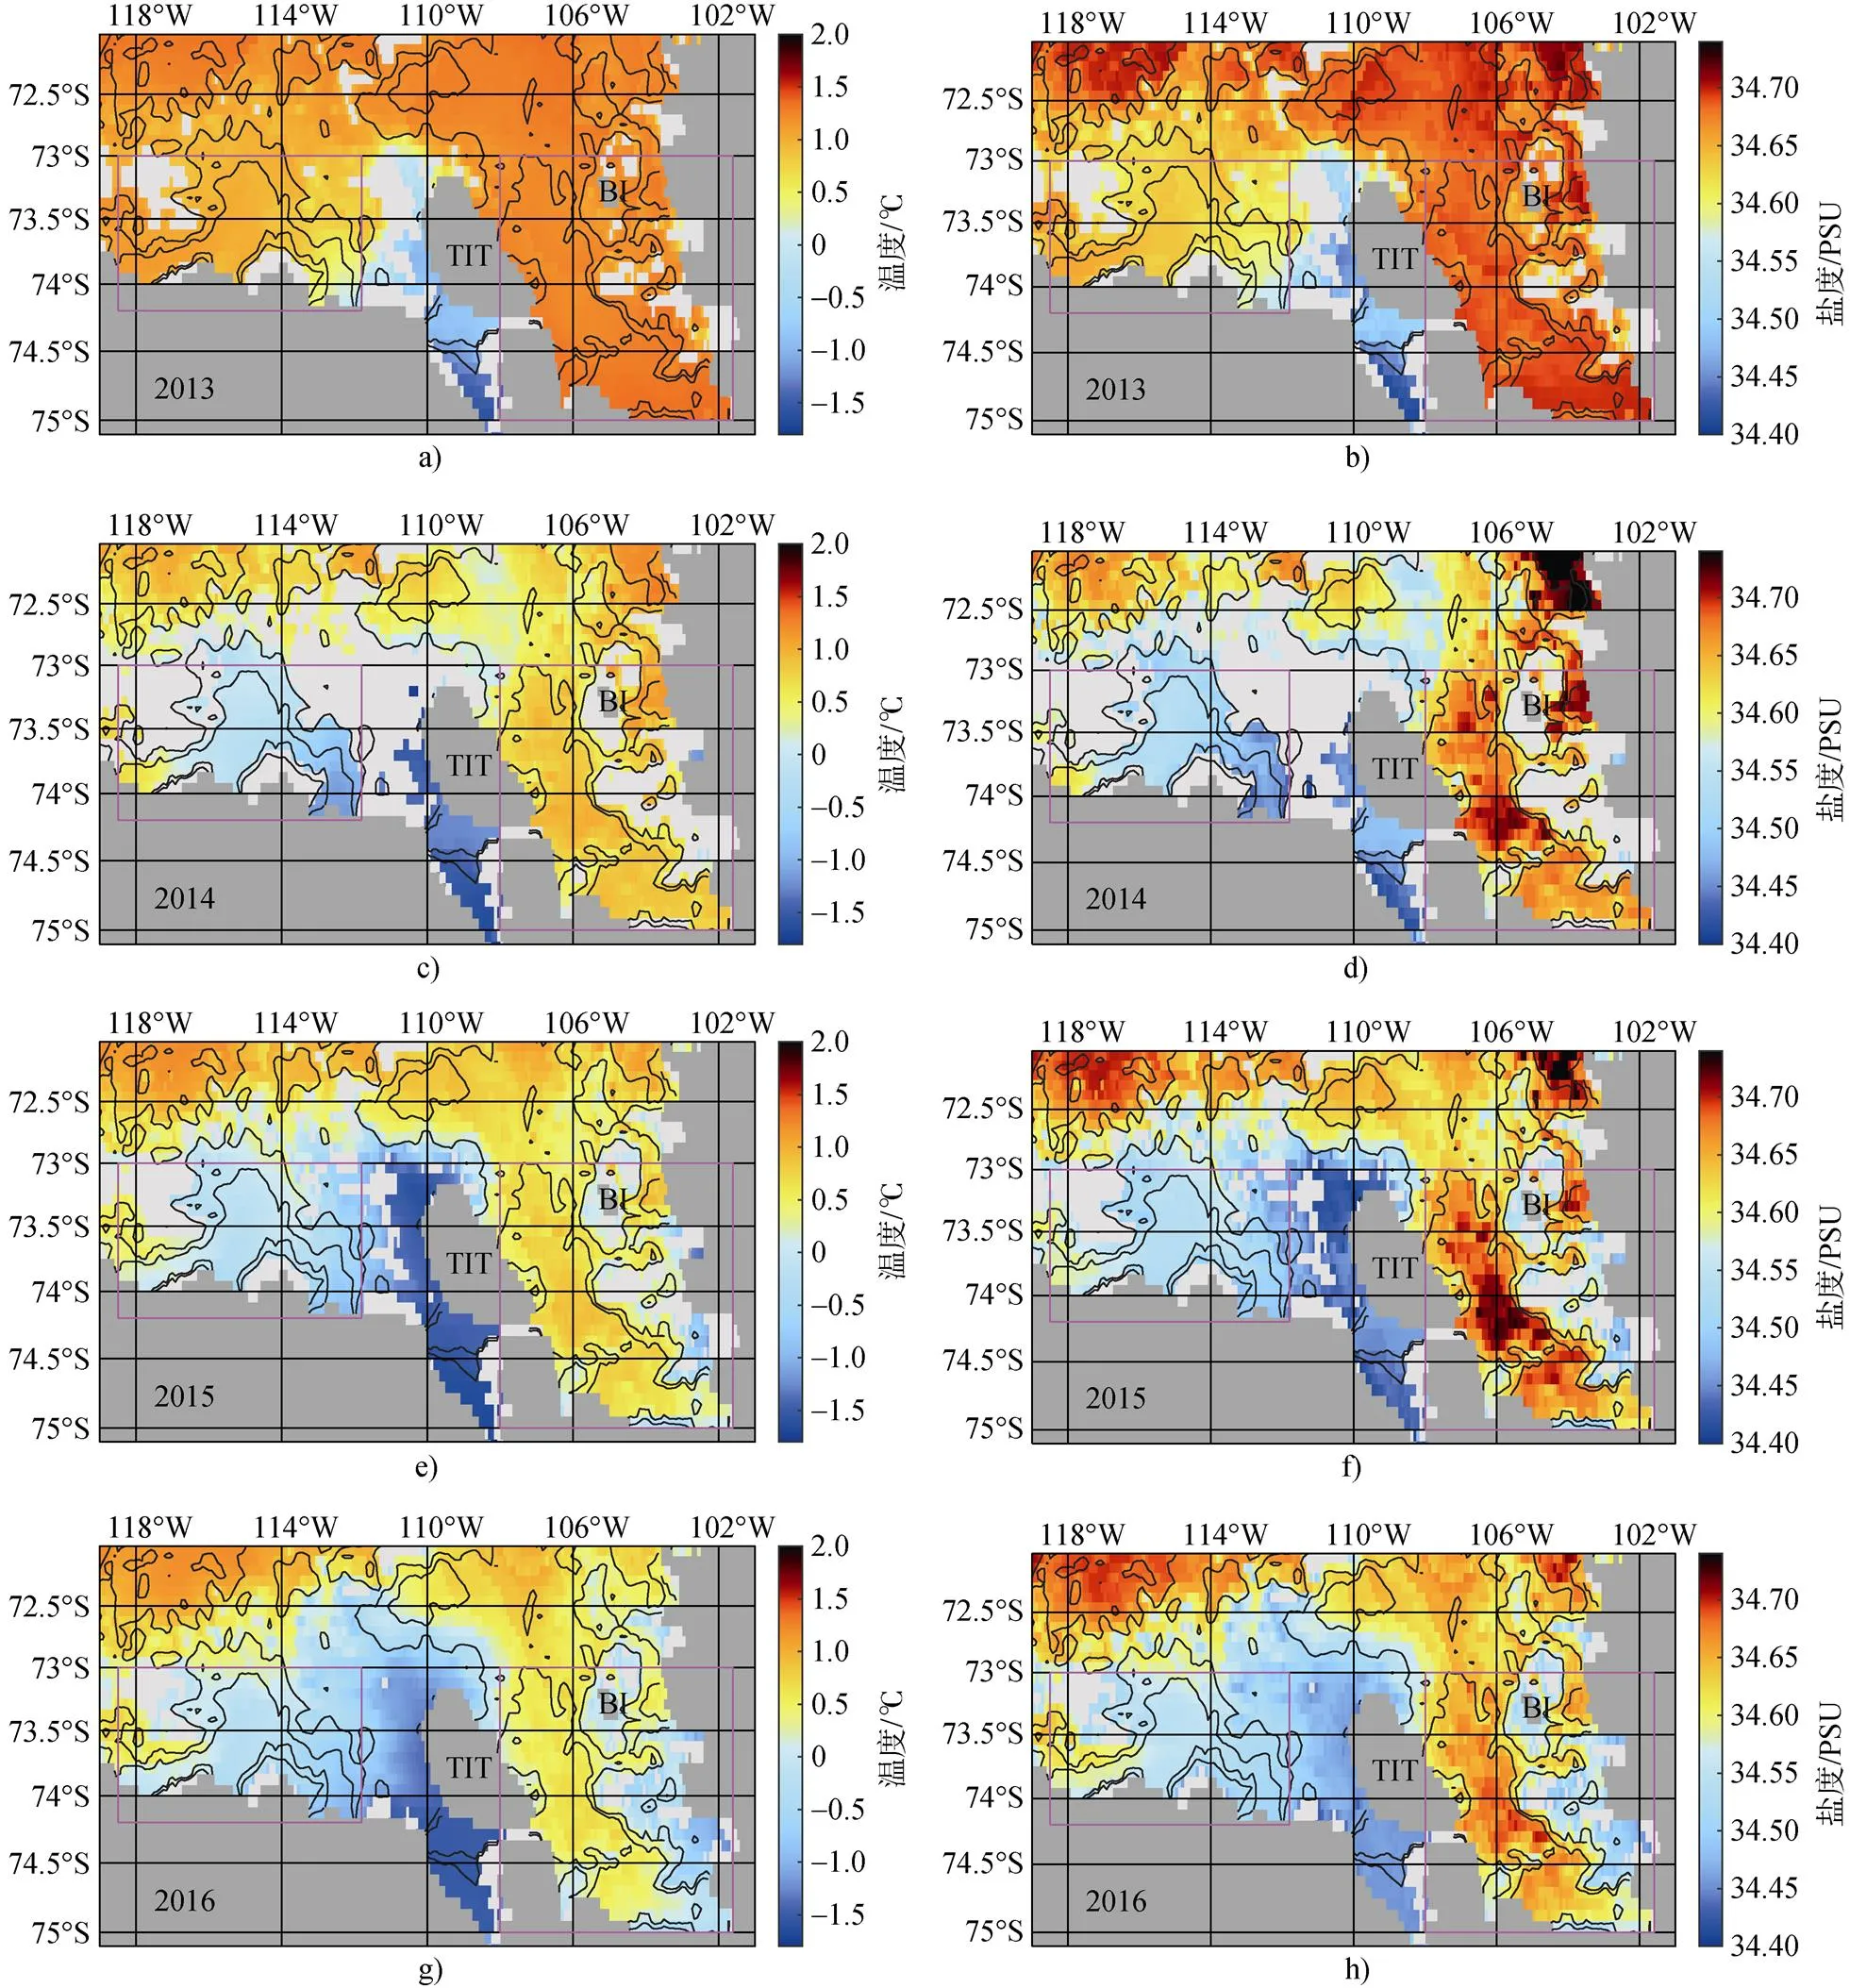
图10 2013—2016年CDW的温度、盐度分布(对CDW层内的温盐进行深度平均).a) 2013年温度分布; b) 2013年盐度分布; c) 2014年温度分布; d) 2014年盐度分布; e) 2015年温度分布; f) 2015年盐度分布; g) 2016年温度分布; h) 2016年盐度分布
Fig.10.Temperature and salinity distribution of CDW from 2013 to 2016 (depth-averaged of the temperature and salinity within the CDW layer).a) temperature distribution in 2013; b) salinity distribution in 2013; c) temperature distribution in 2014; d) salinity distribution in 2014; e) temperature distribution in 2015; f) salinity distribution in 2015; g) temperature distribution in 2016; h) salinity distribution in 2016
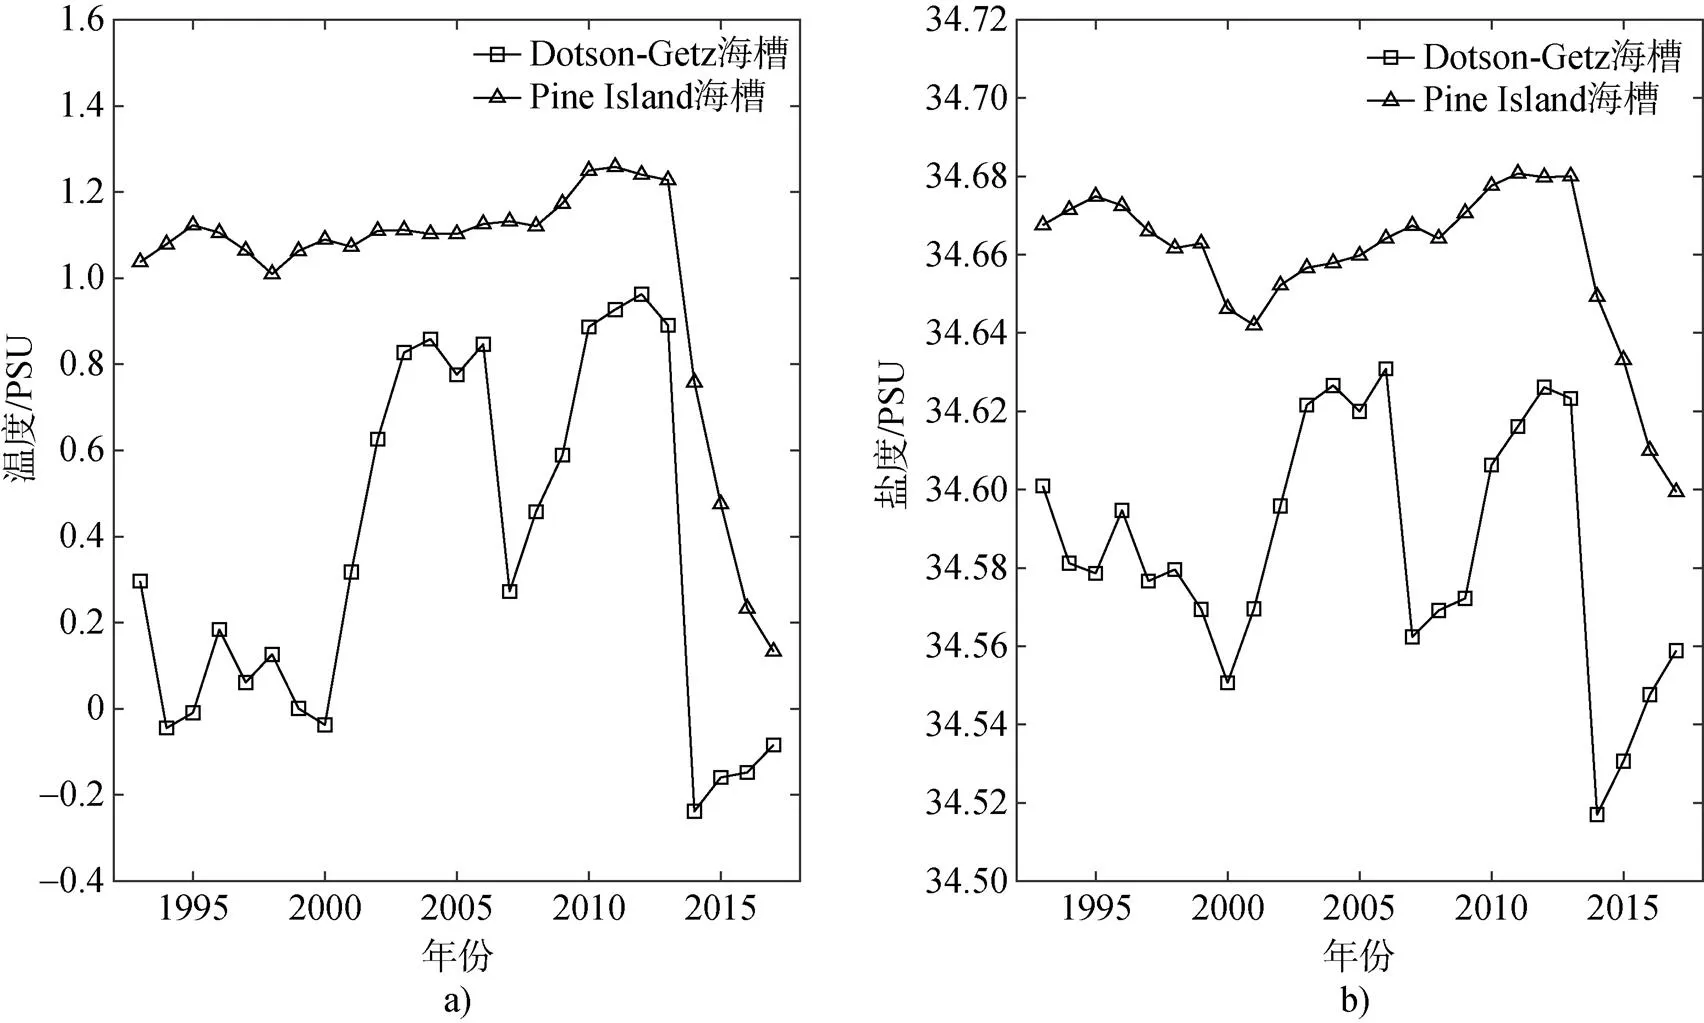
图11 Dotson-Getz海槽和Pine Island海槽内CDW的温度和盐度变化.a) 温度分布; b) 盐度分布
Fig.11.Variations in temperature and salinity of CDW in the Dotson-Getz Trough and Pine Island Trough.a) temperature distribution; b) salinity distribution
不断混合。综上所述, CDW沿着输运路径最终进入海槽时的温度主要受两方面影响, 一方面与入侵陆架时的温度有关, 一方面又被后续的混合过程所控制[38]。
4 结论
本文基于GLORYS12V1数据, 根据阿蒙森海陆架上流场结构给出CDW入侵路径, 计算了西侧、中央和东侧3个通道断面处的体积输运及热输运, 并讨论了陆架上CDW温度和盐度的性质变化与流场之间的关系。
在1993至2017年期间, CDW主要通过西侧、中央和东侧3个通道入侵阿蒙森海陆架, 并且入侵陆架时的温度存在一定的差异, 由东侧通道入侵的CDW温度最高, 西侧入侵的CDW温度最低。CDW主要通过西侧通道向Dotson-Getz海槽输运, 通过中央通道和东侧通道向Pine Island海槽输运。CDW通过西侧通道入侵陆架的体积输运和热输运在年际变化上呈现微弱的上升趋势, 使CDW向Dotson-Getz海槽的体积输运和热输运不断增加。CDW通过中央通道向Pine Island海槽的输运量约是东侧通道的2倍。
在阿蒙森海陆架范围内CDW的平均厚度空间分布与水深分布较为接近, 在Dotson-Getz海槽与Pine Island海槽厚度较大。CDW温度的空间分布与盐度基本一致, Pine Island海槽内的温度和盐度明显高于Dotson-Getz海槽, 且整个陆架上温度和盐度的最低值均出现在TIT和TIS西侧。CDW进入海槽时的温度主要受两方面影响, 一方面与入侵陆架时的温度有关, 一方面又被后续的混合过程所控制。
1 王亚凤, 温家洪, 刘吉英.南极冰盖与冰川的快速变化[J].极地研究, 2006, 18(1): 63-74.
2 WILLIAMS S D P, MOORE P, KING M A, et al.Revisiting GRACE Antarctic ice mass trends and accelerations considering autocorrelation[J].Earth and Planetary Science Letters, 2014, 385: 12-21.
3 RIGNOT E, JACOBS S, MOUGINOT J, et al.Ice-shelf melting around Antarctica[J].Science, 2013, 341(6143): 266-270.
4 RIGNOT E, VELICOGNA I, VAN DEN BROEKE M R, et al.Acceleration of the contribution of the Greenland and Antarctic ice sheets to sea level rise[J].Geophysical Research Letters, 2011, 38(5): L05503.
5 RITZ C, EDWARDS T L, DURAND G, et al.Potential sea-level rise from Antarctic ice-sheet instability constrained by observations[J].Nature, 2015, 528(7580): 115-118.
6 VAUGHAN D G.West Antarctic Ice Sheet collapse—The fall and rise of a paradigm[J].Climatic Change, 2008, 91(1-2): 65-79.
7 WOODROFFE C D, MURRAY-WALLACE C V.Sea-level rise and coastal change: The past as a guide to the future[J].Quaternary Science Reviews, 2012, 54: 4-11.
8 FEAGIN R A, SHERMAN D J, GRANT W E.Coastal erosion, global sea-level rise, and the loss of sand dune plant habitats[J].Frontiers in Ecology and the Environment, 2005, 3(7): 359-364.
9 BRONSELAER B, WINTON M, GRIFFIES S M, et al.Change in future climate due to Antarctic meltwater[J].Nature, 2018, 564(7734): 53-58.
10 JACOBS S S, HELLMER H H, JENKINS A.Antarctic Ice Sheet melting in the southeast Pacific[J].Geophysical Research Letters, 1996, 23(9): 957-960.
11 钱懿德, 周春霞, 陈一鸣, 等.1947—2020年西南极派恩岛冰川前缘变化特征分析[J].极地研究, 2020, 32(4): 435-451.
12 ORSI A H, WHITWORTH T III, NOWLIN W D Jr.On the meridional extent and fronts of the Antarctic Circumpolar Current[J].Deep Sea Research Part I: Oceanographic Research Papers, 1995, 42(5): 641-673.
13 WALKER D P, BRANDON M A, JENKINS A, et al.Oceanic heat transport onto the Amundsen Sea shelf through a submarine glacial trough[J].Geophysical Research Letters, 2007, 34(2): L02602.
14 WALKER D P, JENKINS A, ASSMANN K M, et al.Oceanographic observations at the shelf break of the Amundsen Sea, Antarctica[J].Journal of Geophysical Research: Oceans, 2013, 118(6): 2906-2918.
15 NAKAYAMA Y, MENEMENLIS D, ZHANG H, et al.Origin of Circumpolar Deep Water intruding onto the Amundsen and Bellingshausen Sea continental shelves[J].Nature Communications, 2018, 9(1): 3403.
16 NAKAYAMA Y, SCHRÖDER M, HELLMER H H.From circumpolar deep water to the glacial meltwater plume on the eastern Amundsen Shelf[J].Deep Sea Research Part I: Oceanographic Research Papers, 2013, 77: 50-62.
17 THOMA M, JENKINS A, HOLLAND D, et al.Modelling Circumpolar Deep Water intrusions on the Amundsen Sea continental shelf, Antarctica[J].Geophysical Research Letters, 2008, 35(18): L18602.
18 WÅHLIN A K, MUENCH R D, ARNEBORG L, et al.Some implications of Ekman layer dynamics for cross-shelf exchange in the Amundsen Sea[J].Journal of Physical Oceanography, 2012, 42(9): 1461-1474.
19 史久新.南极冰架-海洋相互作用研究综述[J].极地研究, 2018, 30(3): 287-302.
20 MALLETT H K W, BOEHME L, FEDAK M, et al.Variation in the distribution and properties of Circumpolar Deep Water in the eastern Amundsen Sea, on seasonal timescales, using seal-borne tags[J].Geophysical Research Letters, 2018, 45(10): 4982-4990.
21 KIM T W, HA H K, WÅHLIN A K, et al.Is Ekman pumping responsible for the seasonal variation of warm circumpolar deep water in the Amundsen Sea?[J].Continental Shelf Research, 2017, 132: 38-48.
22 JOUGHIN I, ALLEY R B, HOLLAND D M.Ice-sheet response to oceanic forcing[J].Science, 2012, 338(6111): 1172-1176.
23 MEREDITH M P, DUCKLOW H W, SCHOFIELD O, et al.The interdisciplinary marine system of the Amundsen Sea, Southern Ocean: Recent advances and the need for sustained observations[J].Deep Sea Research Part II: Topical Studies in Oceanography, 2016, 123: 1-6.
24 NITSCHE F O, JACOBS S S, LARTER R D, et al.Bathymetry of the Amundsen Sea continental shelf: Implications for geology, oceanography, and glaciology[J].Geochemistry, Geophysics, Geosystems, 2007, 8(10): Q10009.
25 WÅHLIN A K, YUAN X, BJÖRK G, et al.Inflow of warm Circumpolar Deep Water in the central Amundsen Shelf[J].Journal of Physical Oceanography, 2010, 40(6): 1427-1434.
26 JACKSON L C, DUBOIS C, FORGET G, et al.The mean state and variability of the north Atlantic circulation: A perspective from ocean reanalyses[J].Journal of Geophysical Research: Oceans, 2019, 124(12): 9141-9170.
27 BUONGIORNO NARDELLI B.A multi-year time series of observation-based 3D horizontal and vertical quasi-geostrophic global ocean currents[J].Earth System Science Data, 2020, 12(3): 1711-1723.
28 JACKETT D R, MCDOUGALL T J.A neutral density variable for the world's oceans[J].Journal of Physical Oceanography, 1997, 27(2): 237-263.
29 WHITWORTH T III, ORSI A H, KIM S J, et al.Water masses and mixing near the Antarctic slope front[M]//Ocean, Ice, and Atmosphere: Interactions at the Antarctic Continental Margin.Washington, D.C.: American Geophysical Union, 1985: 1-27.
30 GOHL K.The expedition of the research vessel “Polarstern” to the Amundsen Sea, Antarctica, in 2010 (ANT-XXVI/3) [J].Berichte zur Polar- und Meeresforschung (Reports on Polar and Marine Research), 2010, 617.
31 FANG L, LEE S, LEE S A, et al.Removal of refractory dissolved organic carbon in the Amundsen Sea, Antarctica[J].Scientific Reports, 2020, 10: 1213.
32 ST-LAURENT P, KLINCK J M, DINNIMAN M S.On the role of coastal troughs in the circulation of warm Circumpolar Deep Water on Antarctic shelves[J].Journal of Physical Oceanography, 2013, 43(1): 51-64.
33 THOMPSON A F, HEYWOOD K J, SCHMIDTKO S, et al.Eddy transport as a key component of the Antarctic overturning circulation[J].Nature Geoscience, 2014, 7(12): 879-884.
34 KLINCK J M, DINNIMAN M S.Exchange across the shelf break at high southern latitudes[J].Ocean Science, 2010, 6(2): 513-524.
35 LIU C Y, WANG Z M, CHENG C, et al.On the modified circumpolar deep water upwelling over the Four Ladies Bank in Prydz Bay, East Antarctica[J].Journal of Geophysical Research: Oceans, 2018, 123(11): 7819-7838.
36 LIU C Y, WANG Z M, CHENG C, et al.Modeling modified Circumpolar Deep Water intrusions onto the Prydz Bay continental shelf, East Antarctica[J].Journal of Geophysical Research: Oceans, 2017, 122(7): 5198-5217.
37 KIMURA S, JENKINS A, REGAN H, et al.Oceanographic controls on the variability of ice-shelf basal melting and circulation of glacial meltwater in the Amundsen Sea Embayment, Antarctica[J].Journal of Geophysical Research: Oceans, 2017, 122(12): 10131-10155.
38 ASSMANN K M, JENKINS A, SHOOSMITH D R, et al.Variability of Circumpolar Deep Water transport onto the Amundsen Sea continental shelf through a shelf break trough[J].Journal of Geophysical Research: Oceans, 2013, 118(12): 6603-6620.
Pathways and properties of Circumpolar Deep Water intrusion on the Amundsen Sea shelf
Bai Yu1, Zhao Liang1, Li Lei2
(1College of Marine and Environmental Sciences, Tianjin University of Science and Technology, Tianjin 300457, China;2College of Oceanic and Atmospheric Sciences, Ocean University of China, Qingdao 266100, China)
The relatively warm Circumpolar Deep Water (CDW) has been intruding on the Amundsen Sea continental shelf in recent decades and melting the ice shelves from below, resulting in a continuous ice mass loss in the Amundsen Sea sector of the West Antarctic Ice Shelf.Analysis of the pathways and variations of the CDW intrusion onto the shelf is of great importance to understanding the phenomena of rapid ice shelf thinning and grounding line retreat in this sector.Based on GLORYS12V1 [Global Ocean (1/12)° Physical Reanalysis] data, we calculated the volume and heat transport in the western, central, and eastern channels.We analyzed the relationship between the variations in temperature and salinity of the CDW on the shelf and its flow field.Results showed that the CDW invaded the Dotson–Getz Trough from the western channel, while it invaded the Pine Island Trough from the central and eastern channels.The volume and heat transport of the CDW intruding on the shelf through the western channel showed a weak upward trend over time.The volume and heat transport of the CDW to the Pine Island Trough through the central channel was about twice as much as that through the eastern channel.The temperature of the CDW intrusion into these troughs was controlled by the temperature of the CDW, when it invaded the shelf, and by subsequent processes on the continental shelf.
Circumpolar Deep Water, Amundsen Sea shelf, flow field structure, volume transport, heat transport
2021年1月收到来稿, 2021年3月收到修改稿
国家海洋局极地考察办公室项目(RFSOCC2020-2022-No.18)资助
白雨, 男, 1996年生。硕士研究生, 主要从事物理海洋学研究。E-mail: baiyu@mail.tust.edu.cn
赵亮, E-mail: zhaoliang@tust.edu.cn
10.13679/j.jdyj.20210004
猜你喜欢
海洋通报(2022年2期)2022-06-30
石油地球物理勘探(2022年3期)2022-06-11
儿童故事画报·自然探秘(2019年10期)2019-01-14
中外文摘(2017年18期)2017-11-14
广东海洋大学学报(2015年3期)2015-12-22
华南农业大学学报(2015年5期)2015-12-04
中国洗涤用品工业(2015年5期)2015-02-28
应用海洋学学报(2014年1期)2014-11-22
中国海洋大学学报(自然科学版)(2014年6期)2014-02-28