
Study on the shear bearing capacity of RC shear walls using artificial neural networks
2021-03-06 02:45,
土木与环境工程学报 2021年1期
,
School of Civil and Transportation Engineering; Civil Engineering Technology Research Center of Hebei Province, Hebei University of Technology, Tianjin 300401, P. R. China)
Abstract: In various areas of civil engineering, the artificial neural network (ANN) model is used to solve complex problems. In this study, ANN models were used to predict the shear bearing capacity of RC shear walls. Based on the results of 160 experiments, a database was constructed that included the performance of RC shear walls under cyclic loading. One hundred and forty samples were chosen to train the ANN models, and 20 were used for validation. There were fourteen inputs parameters: concrete compressive strength, aspect ratio, axial compression ratio, vertical bar yield strength, horizontal bar yield strength, web vertical reinforcement ratio, web horizontal reinforcement ratio, boundary region vertical reinforcement ratio, boundary region horizontal reinforcement ratio, sectional area ratio, sectional height thickness ratio, total section area, wall height, and section shape. ANN1 and ANN2 were normalized in intervals of [0, 1] and [0.1, 0.9], respectively. The shear force of the RC shear walls was the output data for both models. The predictions by the ANN models and the code methods from GB 50011 and ACI 318 were compared. The results reveal that the developed models exhibit better prediction and generalization capacity for RC shear walls than the code methods.
Keywords:artificial neural network; shear wall; reinforced concrete; model prediction; shear bearing capacity
1 Introduction
Reinforced concrete (RC)shear walls are often used in building structures due to their capacity to resist lateral loads under seismic action[1]. The concrete strength, aspect ratio, axial compression ratio, vertical or horizontal web reinforcement ratio, and vertical or horizontal boundary region reinforcement ratio are critical design parameters that govern the lateral load resistance capacity of RC shear walls[2-3]. The formula used in domestic and foreign codes to calculate the shear bearing capacity is an empirical formula determined by statistical analysis, that reflects the main physical and geometric parameters and considers the factors that influence the reliability. Differences in the calculation model and calculation method are incorporated in current codes, such as GB 50011, ACI 318, and EC2. Furthermore, the strength of the concrete used in the formula for calculating the shear bearing capacity is also different. Generally, most existing methods of calculating the shear bearing capacity of RC shear walls are based on models with limited experimental data, such as shear walls using high-strength steel bars. Therefore, further research on more reliable and effcient structural assessement is needed.
ANNs have been used for simulating engineering problems[4-6]. To predict the axial bearing capacity, Du et al.[7]suggested two ANN models of rectangular concrete-filled steel tubular columns. Kotsovou et al.[8]established an ANN model to predict the load bearing capacity of beam-column joints. However, the ANN models and experimental data are limited. In this study, shear bearing capacity predictions of RC shear walls were developed using artificial neural networks. The developed ANN model provides a reference for prefabricated concrete shear walls, the seismic performance of which are equivalent to cast-in-place RC walls[9-12].
2 Data collection
As shown in Fig.1,test results for 160 RC shear walls with rectangular or barbell sections was found in the literature [2-3, 13-29]. The test information included all parameters that may have an impact on the behavior of the RC shear walls. The test samples exhibited good deformation ability. The parameters for all samples were consistent.
The size parameters of the wall (b,h, andH), the yield strength of the horizontal reinforcementsfy, the concrete compressive strengthfc, the aspect ratio λ, the axial compression ratioμ, and the shear forceVare included to train and test the ANN models. Finally, 160 test samples were obtained and are summarized in Table 1.

Fig.1 Typical test setup under cyclic loading and section for RC shear
3 Artificial neural networks
3.1 Background information
ANN is an operational model that mimics the neural network of the human brain from the perspective of information processing. ANN is an artificial intelligence technology that can solve complex problems based on input parameters. The effects of these parameters are not explicitly illustrated or quantified. ANNs have the ability to learn, summarize, classify, and predict, and it have been achieved remarkable results in many practical applications over the past years. In this study, ANNs are used to predict the shear bearing capacity of RC shear walls.

Table 1 Test data of RC shear walls
This study uses a back-propagation (BP) algorithm, as shown in Fig.2. A typical artificial neuron is shown in Fig.3. Three layers are included in the ANNs: input layer, hidden layer, and output layer. Each layer compriseskneurons, three neurons, and two neurons, respectively.


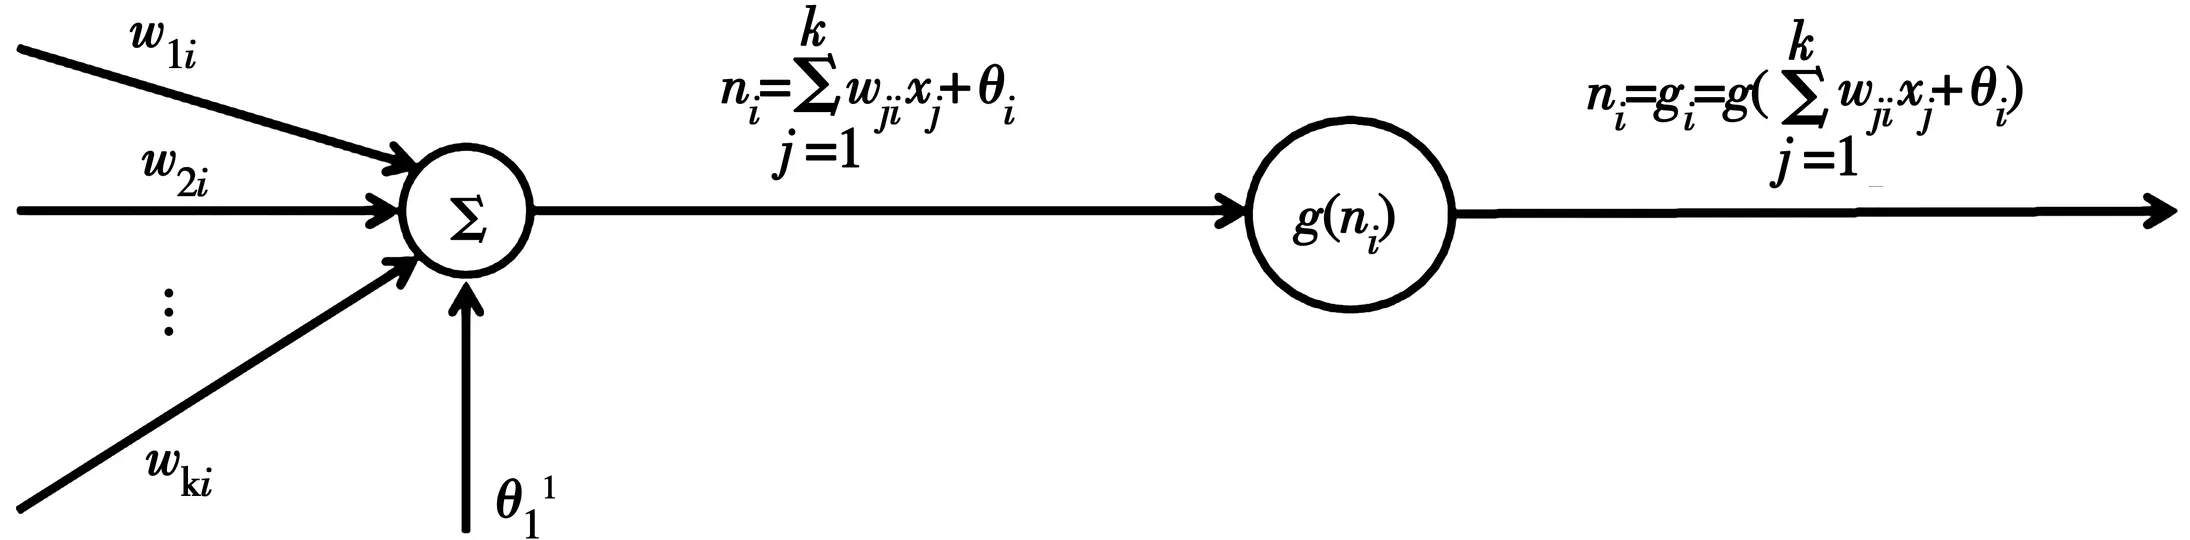
Fig.3 A typical artificial
The connections between interrelated neurons with a set specific weight are multiplied by the input data produced by the neuron. The values obtained in a particular layer are passed through the link and summed up with the bias (refer to Fig.2)[8]A predefined activation is used to represent the relationship between the inputs and the outputs, as shown in the following
(1)
whereyiis the output of the ANN,wijis the weight coefficients of thejthneuron,xjis the input data,θiis the bias of the neuron, andg(·) is the activation function. In this study, input and hidden layers used sigmoid activation functions, and the output layer used the tan-sigmoid activation function.
3.2 Input and output data
The input parameters were selected based on the dominant effect of the parameters on the behavior of the RC shear wall, and included the concrete compressive strength (fc), the aspect ratio (λ), the axial compression ratio (μ), the vertical reinforcement yield strength (fy,vw), the horizontal reinforcement yield strength (fh,vw), the vertical reinforcement web ratio (ρvw), the horizontal reinforcement web ratio (ρhw), the vertical reinforcement boundary region ratio (ρvc), the horizontal reinforcement boundary region ratio (ρhc), the sectional area ratio of the boundary region to the total cross-section area (Ab/Ag), the sectional height thickness ratio (lw/tw), the total section area (Ag), the wall height (H), and the section shape (the rectangular section is “0” and the barbell section is “1”).
Since the performance of the RC shear walls specified in the code is determined by the limit of the shear load capacity, we take the maximum shear (Vmax) as the target parameter. The maximum and minimum values of the input and output data are listed in Table 2. Table 3 shows the correlation between the input parameters used for the prediction of the shear bearing capacity of the RC shear walls. Some parameters are weakly correlated while others are strongly correlated. For example, the correlation coefficient between thelw/twandAb/Agwas -0.763, which indicates a strong negative relationship. The correlation coefficient between theHandλwas 0.449, which indicates a weak positive relationship. The sequence of the correlation for the input parameters from strong to weak wereAg,ρvc,ρhc,fc,Ab/Ag, section shape,fy,vw,fh,vw,H,ρhw,λ,ρvw,μ, andlw/tw.

Table 2 Maximum and minimum values of the input and output data

Table 3 Correlation matrix for input parameters
To minimize the deviation of the ANN and low convergence rates, the values of the input and output data are normalized using Eq.(2).
(2)
3.3 Training and testing of the ANNs
In this study, the network was built using the ANN toolbox in MATLAB. The BP network with 15 hidden layers was used to build the model of RC shear walls. The 160 experimental samples were randomly divided into two groups, 140 samples for training, and 20 samples for testing. In order to verify the effect of normalization equation on the ANNs prediction, the two control groups ANN1 and ANN2 were normalized in the range [0, 1] and [0.1, 0.9].
The training process of the neural network involves adjusting the network’s weights and deviations (initially randomly assigned) to optimize the network’s performance in the iterative process. The error performance index of the forward network is MSE, which is the mean square error between the network output and the target. The neural network would modify the network node weight, according to MSE. At the same time, in order to reduce the error in each iteration, ANN used the back-error propagation algorithm. After the error was calculated, the weights and bias were readjusted.
The calibration procedure of the ANN model is shown in Fig.4. This was repeated until one of the following conditions was met: 1) After 500 training sessions, the algorithm will stop the training process. 2) The error-index reaches 10-5. 3) The validation check occurs 10 times.
The ANN values (ANN-output) and test values (targets) are illustrated in Fig.5. The ANNs predicted values were close to the experimental values with good deformation ability, indicating that the ANN1 and ANN2 models successfully learned the relationship between input and output data. In addition, the predicted values and test values that were closer to each other in different normalized ranges were in the range [0, 1] rather than the range [0.1, 0.9].
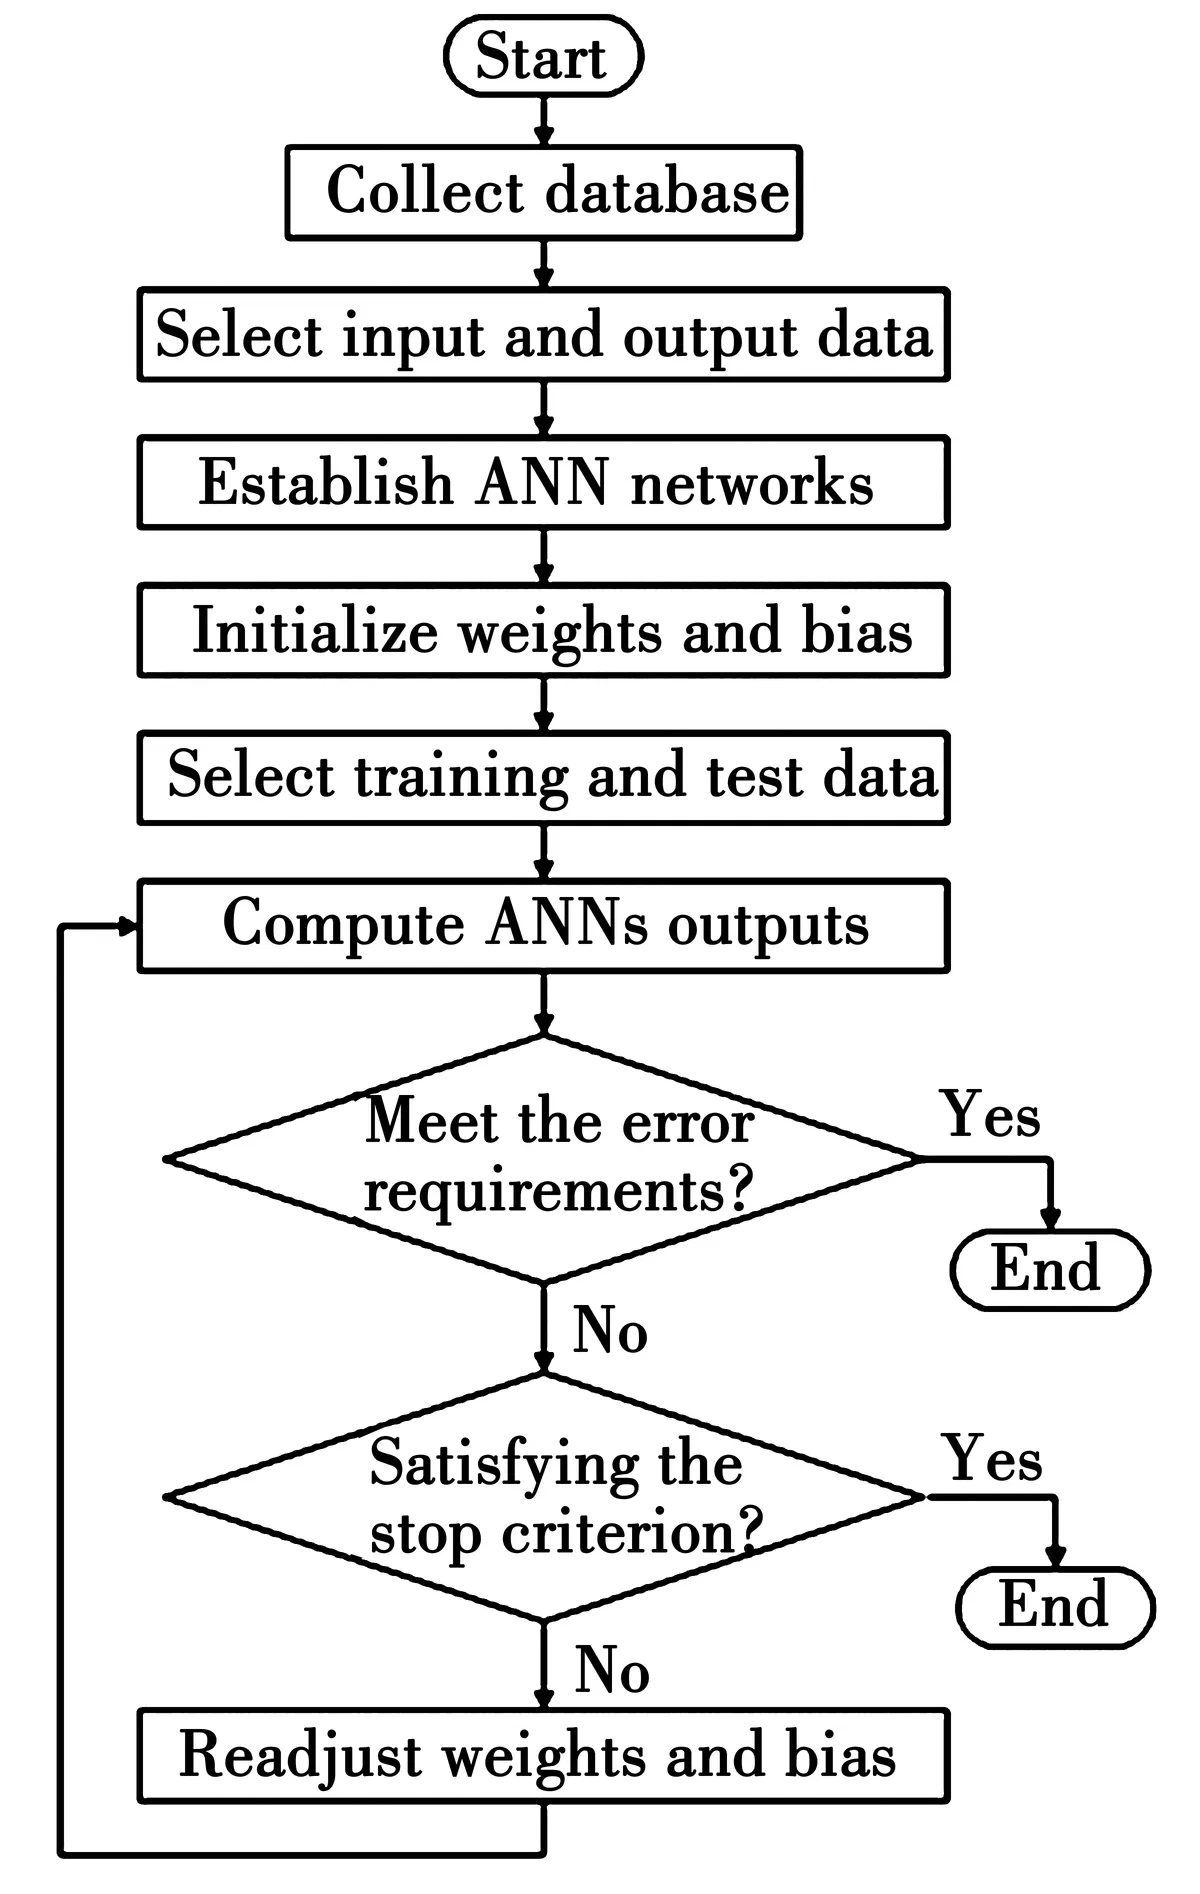
Fig.4 Calibration procedure of the ANN
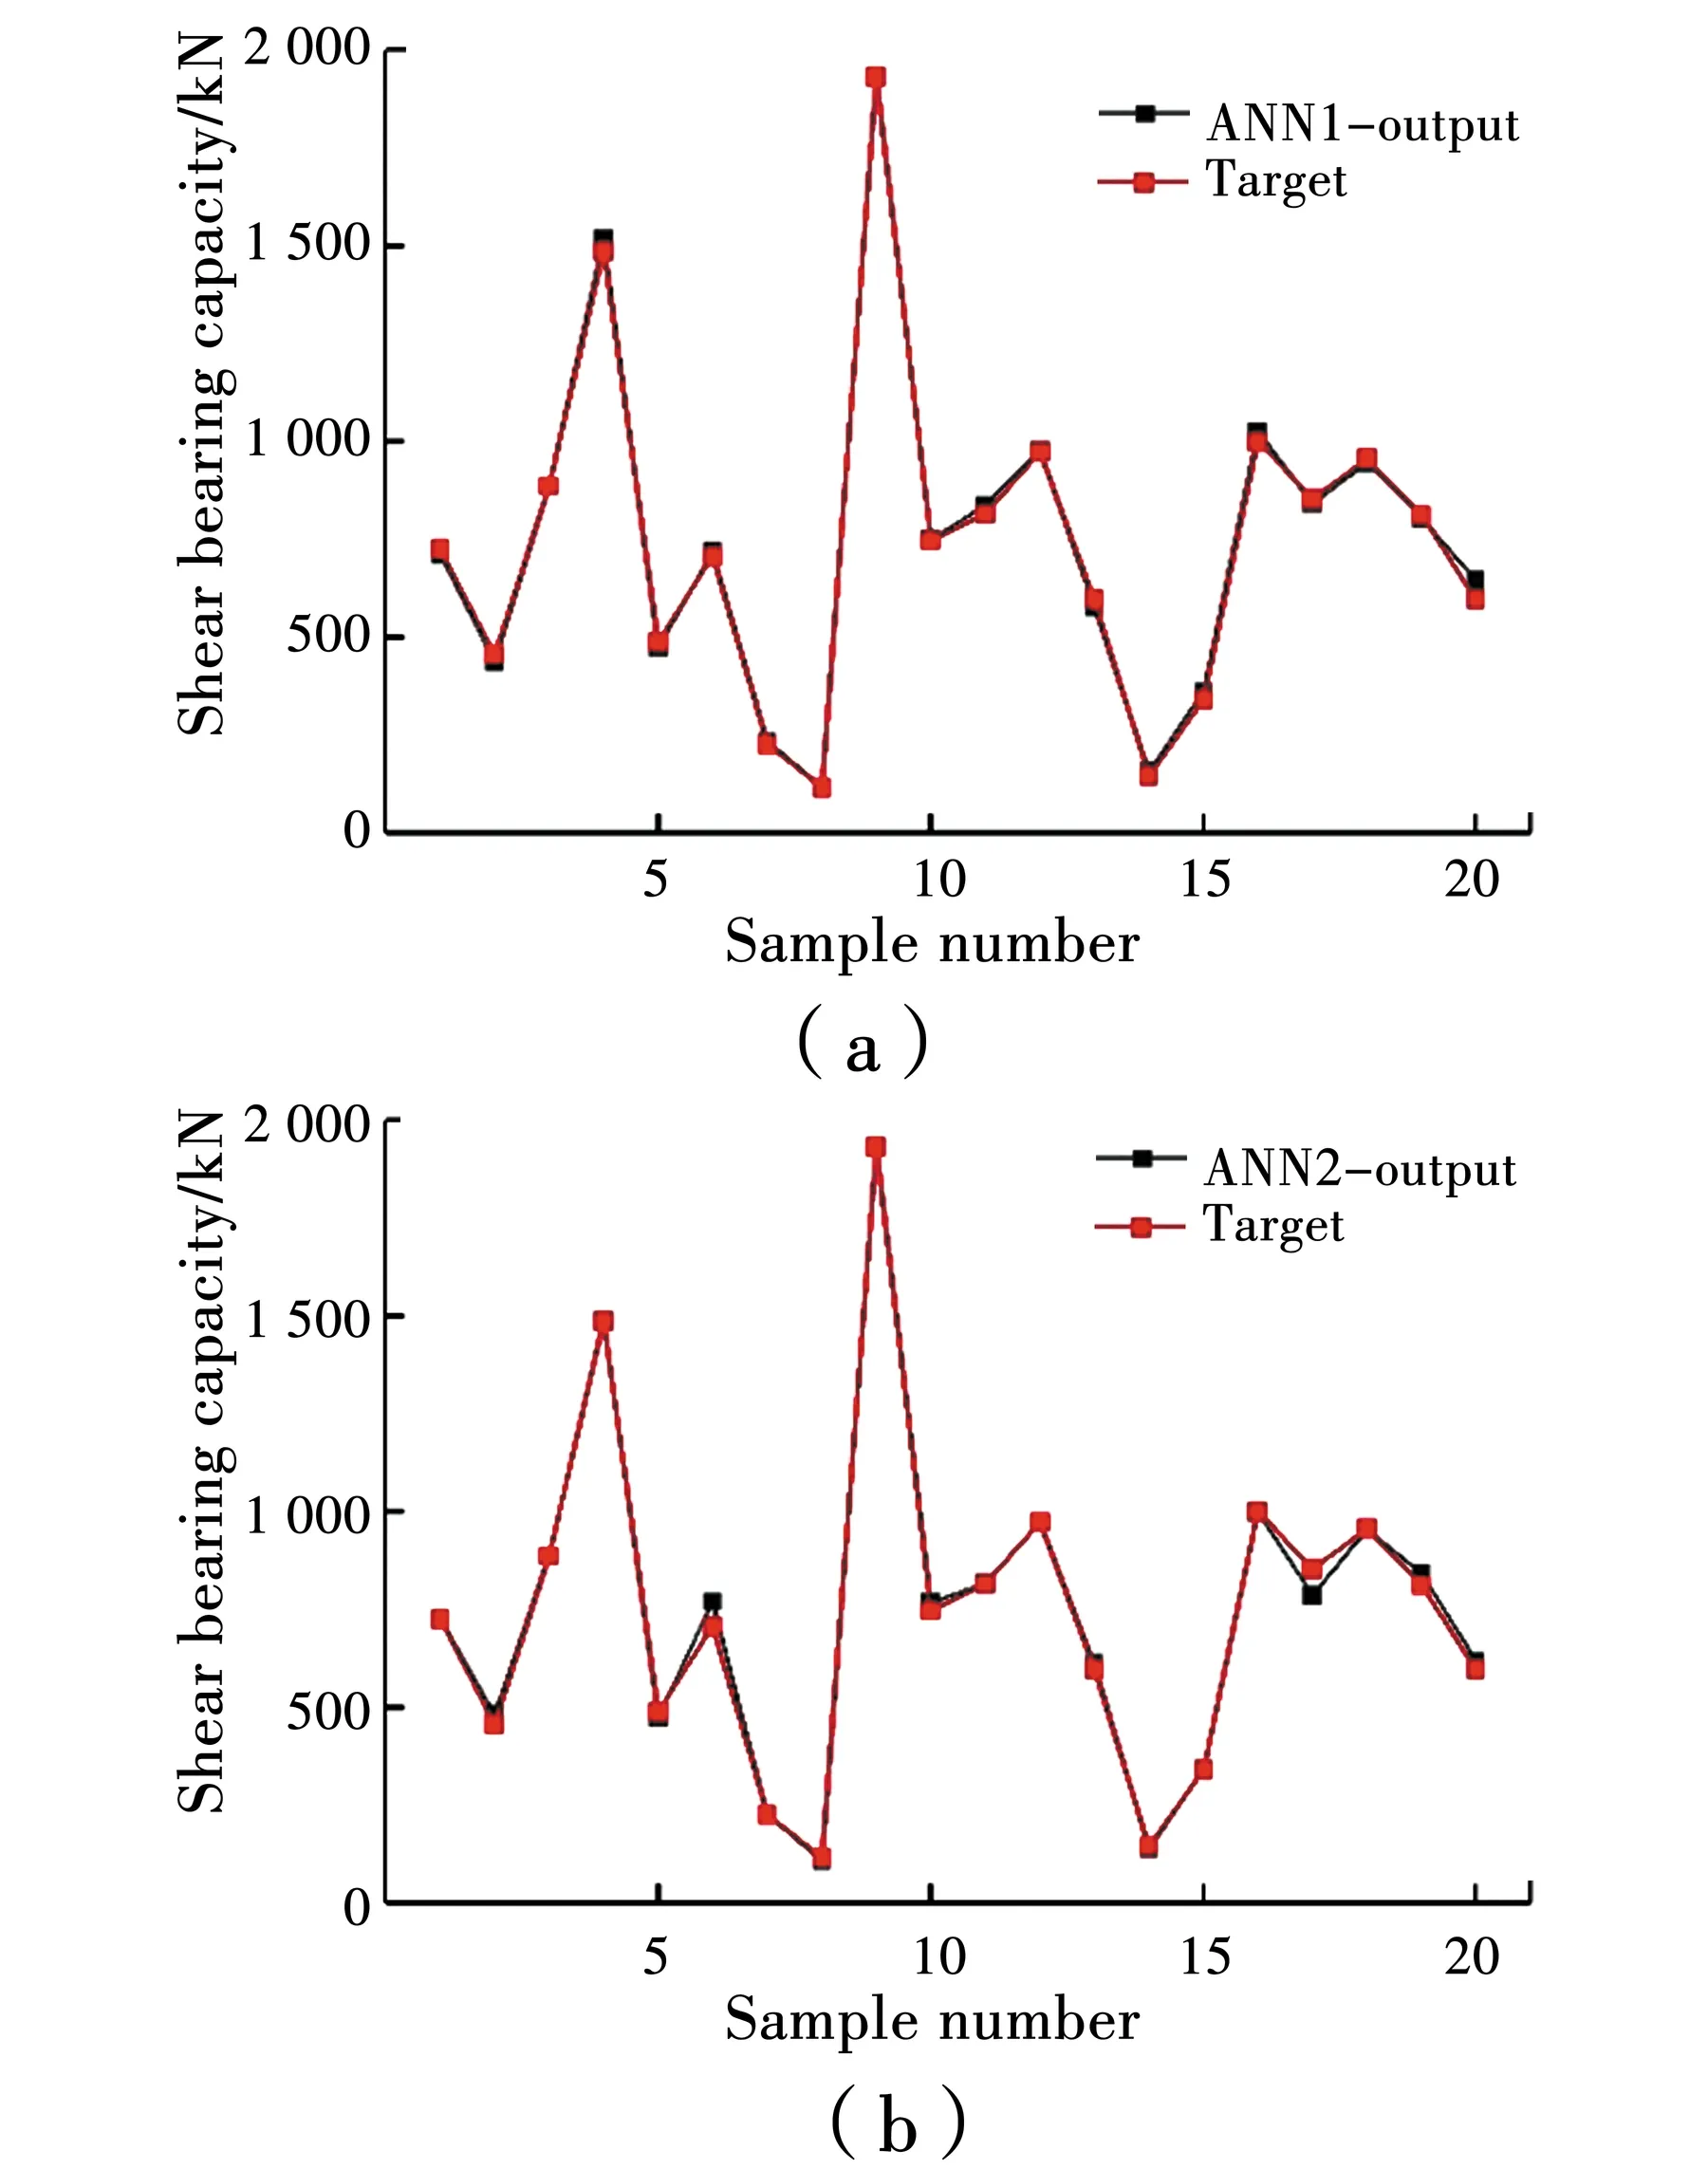
Fig.5 ANN predicted values and test
The ratio of output to target OTR, mean valueMV, and standard deviationSDare used to evaluate the behavior of the model.
OTRi=Oi/Ti
(3)
(4)
(5)
WhereOiandTiare the prediction values of the ANN models and the maximum shear of the experimental samples, respectively.nis the total sample number.
Curves of OTR and sample number for ANN1, ANN2, GB 50011, and ACI 318 are presented in Fig.6. Two predicted values in the ANN1 model exhibited the errors of 8.1% and 8.7%, which were overestimated. Two predicted values in the ANN2 model exceeded the error of 8.0%. One was underestimated and the other was overestimated. TheSDwas 0.036 1 in ANN1 and 0.041 2 in ANN2 (refer to Table 4). Therefore, the ANN1 model was superior to the ANN2 model in calculating the shear bearing capacity of RC shear walls.

Fig.6 OTRs-sample numbers curves for ANN1, ANN2,

Table 4 MVs and SDs with testing data
4 Comparative studies of ANN models and design codes
The methods proposed by GB 50011 and ACI 318 are presented as follows
(6)
Vu=φ(Vc+Vs)
(7)
(8)
(9)
The outputs of the RC shear walls are the results calculated by the formulas Eqs.(6) to (9).
Fig.6 shows the OTRs calculated by ANN1, ANN2, GB 50011, and ACI 318. Table 4 listsMVs andSDs using the testing data for ANN1, ANN2, GB 50011, and ACI 318.
Results predicted by the ANN1 and ANN2 models matched those calculated by GB 50011 and ACI 318 very well.
The results predicted by the ANN1 and ANN2 models matched those calculated by GB 50011 and ACI 318 very well. There were two outputs with an error of over 8% for both ANN1 and ANN2, but they did not exceed 10%. Two out of twenty in ANN1 were overestimated. One was overestimated in ANN2, and the other was underestimated. These results show that the ANN model exhibited a significant improvement compared to the standard GB 50011 and ACI 318. Compared with the experimental data, fourteen results predicted by GB 50011 exceed 10% difference based on theOTRs. There were sixteen predicted results with errors exceeding 10% in ACI 318. TheSDs of ANN1 and ANN2 were 0.036 1 and 0.041 2, much lower than those of GB 50011 and ACI 318 (refer to Table 3). Compared with GB 50011 and ACI 318, the ANNs exhibited better performance on predicting the shear bearing capacity of RC shear walls.
There were thirteen results with errors exceeding 10% in GB 50011 and three in ACI 318 were underestimated. TheMVs of the results predicted by GB 50011 and ACI 318 were 0.954 4 and 0.825 6, respectively. ANN models exhibited higherMVs than GB 50011 and ACI 318, indicating that the formulas were conservative in GB 50011 and ACI 318 due to the usage of high strength materials. TheSDof GB 50011 and ACI 318 reached 0.189 7 and 0.223 6, which were larger than the ANN models.
The ANN1 and ANN2 models had the two largestMVs, while ANN1 and ANN2 exhibited smallerSDs. Thus, ANN models can accurately predict the shear bearing capacity of RC shear walls. Compared with the design codes, ANN models may be safer.
5 Conclusions
Two ANN models with fourteen input parameters were developed, based on experimental data. An efficient learning model based on ANNs was proposed to evaluate the load bearing capacity of RC shear walls. The prediction results show that ANN models predict the load bearing capacity favorably using parameters such as the aspect ratio, the axial compression ratio, the concrete and reinforcement strength, the boundary region and web reinforcement ratio, and the sectional ratio and size, thus accurate predictions can be provided.
The ANN1 and ANN2 models exhibit a better correlation with the experimental results than the codes GB 50011 and ACI 318. The ANN models exhibit better accuracy in prediction and generalization capacity. The BP algorithm can be effectively adopted in the shear strength prediction of RC shear walls.
Application of developed ANNs can be extended by further experimental tests including other shaped sections as input data. More studies on RC shear walls including high strength concrete and high strength reinforcements are valuable for the structures adopting RC shear walls.
Acknowledgements
The authors would like to acknowledge the financial support from the Natural Science Foundation of Hebei Province (No. E2018202290).

- 土木与环境工程学报的其它文章
- Landslide displacement prediction based on the Genetic Simulated Annealing algorithm
- Numerical analysis of rockfall and slope stability along the Karakorum Highway in Jijal-Pattan
- Large deformation finite element analysis of cone penetration tests in calcareous sands
- Stress state and strain rate dependent ductile fracture behavior of Q690 steel
- Cyclic loading test on the performance of SRC column-RC beam frame after exposure to fire
- Numerical modeling of flanged RC shear walls considering shear deformation and coupled flexural-shear effects