
Evaluation of Baishao(Paeoniae Radix Alba)and Chishao(Paeoniae Radix Rubra)from different origins based on characteristic spectra of amino acids
2021-07-23 10:08LIShshZHANGYipingDENGYunhuiWANGQinXIEZhiruIbrrEstrdEmmnuelXIAOXue
Digital Chinese Medicine 2021年3期
LI Shsh,ZHANG Yiping,DENG Yunhui,WANG Qin,b,XIE Zhiru,b,Ibrr-Estrd Emmnuel,XIAO Xue
a.The Second Clinical Collage,Guangzhou University of Chinese Medicine,Guangzhou,Guangdong 510006,China
b.Chinese Medicine Research Institute,Guangdong Pharmaceutical University,Guangzhou,Guangdong 510006,China
c.Mexican Seed Association,A.C.,Mexico City 01030,Mexico
ABSTRACT Objective To evaluate the difference between Baishao(Paeoniae Radix Alba,PRA)and Chishao(Paeoniae Radix Rubra,PRR)from different regions based on the characteristic spectra of amino acids(AAs).Methods Fingerprints of the 21 standard AAs were established using O-phthalaldehyde-9-fluorenylmethyl chloroformate(OPAFMOC)pre-column derivation method.The AA components in PRA and PRR were characterized qualitatively and quantitatively,and different AAs were screened using pattern recognition technology.Results Twelve AAs were identified in both PRA and PRR.Meanwhile,aspartic acid,glutamic acid,arginine,alanine,and gamma-aminobutyric acid were screened as characteristic components,and their concentrations could effectively distinguish PRA from PRR.Conclusion The established characterization method,which is based on the characteristic spectra of AAs,is accurate,efficient,and sensitive and can effectively distinguish between PRA and PRR from different producing areas,thus providing a reference for the overall characterization and evaluation of Chinese medicinal materials.
Keywords O-phthalaldehyde-9-fluorenylmethyl chloroformate(OPA-FMOC)pre-column derivatization method Amino acids characteristic spectra Baishao(Paeoniae Radix Alba,PRA)Chishao(Paeoniae Radix Rubra,PRR)Pattern recognition
1 Introduction
Chinese herbaceous peony is an economically important plant with ornamental,edible,and medicinal values.The root ofPaeonia lactifloraPall.can be used as a health food or medicine.Before the Northern and Southern Dynasties(4th-6th century AD),Baishao(Paeoniae Radix Alba,PRA)and Chishao(Paeoniae Radix Rubra,PRR)were regarded as the same medicinal materials in practical applications,as both are derived from the dried roots ofPaeonia lactifloraPall..However,the differences between the two decoction pieces in terms of the growth,distribution,harvesting,and processing technology led to the disparity in their efficacy[1].PRA,which is mainly cultivated in the Anhui and Zhejiang provinces,is dried after removing the cortex with boiling water[2].It is mostly used for the treatment of blood deficiency,dizziness,irregular menstruation,and hidroschesis due to its nourishing effect on the blood and liver.PRR is the main raw material produced in the Inner Mongolia Autonomous region,Liaoning province,and Sichuan province[3].It has the potential to eliminate liver heat,activate blood circulation to dissipate blood stasis,and relieve coagulation symptoms.Mono-phenolic glycosides and polyphenols are the most targeted components of these two herbs,and the differences in their efficacy are mainly associated with paeoniflorin and albiflorin[4,5].However,there have been few studies on the basic constituents of these two decoction pieces,i.e.,amino acids(AAs).
AAs,as the primary metabolites of plants,are essential for the synthesis of proteins that are involved in many physiological activities.Multiple bioactive components produced by AAs play an important role in the prevention and treatment of diseases through secondary metabolism[6,7].Traditional Chinese medicine(TCM)materials with dissimilar properties are associated with different primary and secondary metabolic processes and hence may exhibit considerable differences in the types and concentrations of AAs.Thus,establishing a characterization method,based on AAs,for TCM materials would provide a novel technique for distinguishing between PRA and PRR.
The aim of this study was to explore an efficacious method for the evaluation ofPaeonia lactifloraPall.based on the AA profile and to provide some insight and reference for quality control of other TCM materials.Therefore,O-phthalaldehyde-9-fluorenylmethyl chloroformate(OPA-FMOC)pre-column derivatization method was developed to establish the AA fingerprints of 21 batches of PRA and PRR samples from various markets in China.Qualitative and quantitative analyses of AAs in the two herbs were carried out.Furthermore,the characteristic AAs of the two herbs were screened out by using a pattern recognition technique.
2 Materials and methods
2.1 Apparatus
The main equipment used in this study included the 1260 high-performance liquid chromatography(HPLC)system equipped with a gradient pump G1311C,an automatic sampler G1329B,a thermostat column compartment G1316A,and a DAD detector G1315D(Agilent Technologies,USA)connected to an Agilent Chem Station(version 04.03.054.);Milli-Q SP Reagent Water System(Millipore,Bedford,MA,USA);and 1/100 000 electronic balance and 1/10 000 electronic balance(Mettler Toledo,Switzerland).
2.2 Reference compounds and reagents
Aspartic acid(Asp,wkq17010305),glutamic acid(Glu,wkq17010904),asparagine(Asn,wkq17010305),serine(Ser,wkq16090603),threonine(Thr,wkq1609-0801),glycine(Gly,wkq16110106),arginine(Arg,wkq16090702),alanine(Ala,wkq17011305),γ-aminobutyric acid(GABA,wkq17011602),phenylalanine(Phe,wkq16090605),lysine(Lys,wkq16090804),glutamine(Gln,wkq17010905),histidine(His,wkq170-11003),tyrosine(Tyr,wkq16090304),α-aminobutyric acid(AABA,wkq17021001),methionine(Met,wkq16090704),valine(Val,wkq16082004),cysteine(Cys,wkq16101204),isoleucine(Ile,wkq16092108),ornithine(Orn,wkq17020103),and leucine(Leu,wkq16090402)(purity>98%)were purchased from Sichuan Weikeqi Biological Technology Co.,Ltd.(Chengdu,China).
Carbinol and acetonitrile were purchased from Merck &Co.,Inc..OPA and FMOC were purchased from Sigma-Aldrich(St.Louis,MO,USA).HPLCgrade acetonitrile and methanol were purchased from Merck(Darmstadt,Germany).Sodium hydroxide,sodium dihydrogen phosphate,tetrahydrofuran,and boric acid were purchased from Tianjin Zhiyuan Chemical Reagent Co.,Ltd.(Tianjin,China),and 3-mercaptopropionic acid was obtained from Shanghai Macklin Biochemical Technology Co.,Ltd.(Shanghai,China).All other chemicals were of analytical grade.Ultrapure water was prepared in the laboratory.
2.3 Plant materials
Twenty-one batches of PRA and PRR samples were purchased from different standard pharmacies and pharmaceutical companies(Table 1).All samples were identified as dried roots ofPaeonia lactifloraPall.by DENG Yuanhui,a chief pharmacist of the TCM Hospital of Guangdong Province.
2.4 Methods
2.4.1 Sample preparationEach of the samples(PRA and PRR)was weighed(15 g)and placed in a container,followed by the addition of pure water(100 mL).The mixture was heated at a high temperature until boiling,after which the temperature was reduced(maintaining a slightly boiling state).Next,the mixture was refluxed and extracted for 1.5 h.After the mixture was cooled to room temperature and filtered,pure water was added to make up for the initial volume.The supernatant was collected as the final solution,which was further filtered through a 0.22 μm membrane.
The standard mother liquor was prepared at a concentration of 1.0 mg/mL for each standard by accurately weighing the required amount and dissolving in 1% hydrochloric acid solution.Next,the mixed standard solution was diluted with 1% hydrochloric acid solution to the appropriate concentration ranges for qualitative and quantitative analyses.
2.4.2 Derivatization reagent and mobile phase preparationBorate buffer(0.4 mol/L,pH 10.4):Boric acid(2.473 g)was weighed and dissolved in 80 mL ultrapure water,and 40% sodium hydroxide solution was added to adjust the pH to 10.4.The solution was then diluted with ultrapure water to a final volume of 100 mL.
OPA derivatization reagent:OPA(80 mg)was weighed and dissolved in 7.0 mL borate buffer(0.4 mol/L,pH 10.4).Next,1.0 mL acetonitrile and 125 μL 3-mercaptopropionic acid were added to the solution,followed by proper mixing[8].
FMOC derivatization reagent:FMOC(40 mg)was weighed and dissolved in 8 mL acetonitrile,and the solution was properly mixed.
Mobile phase A:NaH2PO4∶tetrahydrofuran,995∶5,v/v,pH 7.2.
Mobile phase B:NaH2PO4∶methanol∶acetonitrile,50∶35∶15,v/v/v,pH 7.2.
The column used was an Alltima C18column(4.6 mm × 250 mm,5 μm).The flow velocity and the column temperature were 0.8 mL/min and 25 °C,respectively.The detection wavelengths were 338 nm(primary amino acids)and 262 nm(secondary amino acids).After the programmed injection of 20 μL of sample,the gradient was eluted.
Programmed injection:(1)5 μL of borate buffer was aspirated,and the needle was washed in water once;(2)1 μL of OPA solution was aspirated,and the needle was washed in water once;(3)5 μL of sample was aspirated,and the needle was washed in water once;(4)the solution was mixed 15 times in air;(5)1 μL of FMOC solution was pipetted,and the needle was washed in water once;(6)the solution was mixed 15 times in air;(7)28 μL of water was pipetted;(8)20 μL of the solution was mixed in air twice at maximum speed;(9)the sample was injected.
Gradient elution:0-8 min,95%-81% A;8-20 min,81%-65% A;20-34 min,65%-40% A;34-40 min,40%-30% A;40-50 min,30%-0% A;50-80 min,0% A.
2.5 Data analysis
2.5.1 Principal component analysis(PCA)PCA is an unsupervised learning method.PCA was performed to obtain low-dimensional data(principal components),which are ultimately simplified to represent the whole sample by reducing the dimensionality of the original data through coordinate graphs.Thus,in this study,the AAs present in the two herbs were screened out as variables,and the batches of medicinal materials in different producing areas of PRA and PRR were subjected to PCA analysis.PCA was performed using the SIMCA-P 13.0 software(Umetrics AB,Umea,Sweden,Demo).
2.5.2 Hierarchical clustering analysis(HCA)HCA is a multivariate analysis technique used to sort samples into groups,and hence,it was used in this study to evaluate the similarities and differences in the AA composition of PRA and PRR from different origins.Thus,the contents of 12 AAs in PRA and PRR,along with their origins,were determined by using HCA.The results are shown in the form of a heat map.
2.5.3 Partial least square-discriminant analysis(PLSDA)To identify AAs with significant concentrations,PLS-DA was subsequently conducted using the SIMCA-P 13.0 software package(Umetrics AB,Umea,Sweden,Demo).The values of Q2Y and R2Y were used to estimate the accuracy of the model,and a typical 7-fold cross-validation was used to validate the model against overfitting.
2.5.4 Statistical analysesStatistical analyses were performed using SPSS software(Version 18.0,USA).The assumptions of normality and homogeneity of variance were checked.The independent samplesttest was used to analyze the differences among groups for continuous measures.Differences were considered statistically significant atP<0.05 andP<0.01.All probability values were two-sided.
3 Result
3.1 Qualitative detection of AAs
The extracts of PRA and PRR were prepared according to the method described above,and 10 μL of each of the 21 standard mother liquor samples were mixed for qualitative analysis.The samples were then injected for detection according to the chromatographic conditions described earlier.The chromatograms of the 21 standard AA samples are shown in Figure 1A.The chromatograms of PRA and PRR are shown in Figure 1B and 1C,respectively.The results of the qualitative analysis indicated that both PRA and PRR contained 12 AAs:Asp,Glu,Asn,Ser,Gln,Gly,Thr,Arg,Ala,GABA,Phe,and Lys.
3.2 Standard curves
The mixed standard solutions were diluted with 0.1%hydrochloric acid solution,and a series of concentrations of the standard compounds were obtained in the appropriate concentration ranges for the calibration curves.Linear regression was carried out with the standard substance concentration as the abscissa and peak area as the ordinate.Regression equations,linear range,andr2of the 12 different AAs present in both PRA and PRR are shown in Table 2.
3.3 Verification of HPLC method
3.3.1 PrecisionThe precision of the apparatus was evaluated using the same batch of PRR samples and six repetitive injections of the same sample solution processed with the aforementioned sample preparation method.The relative standard deviation(RSD)values for the retention time(RT)and the content of the 12 different AAs were calculated as the appraisal index[Table 3,Precision/RSD(%)].
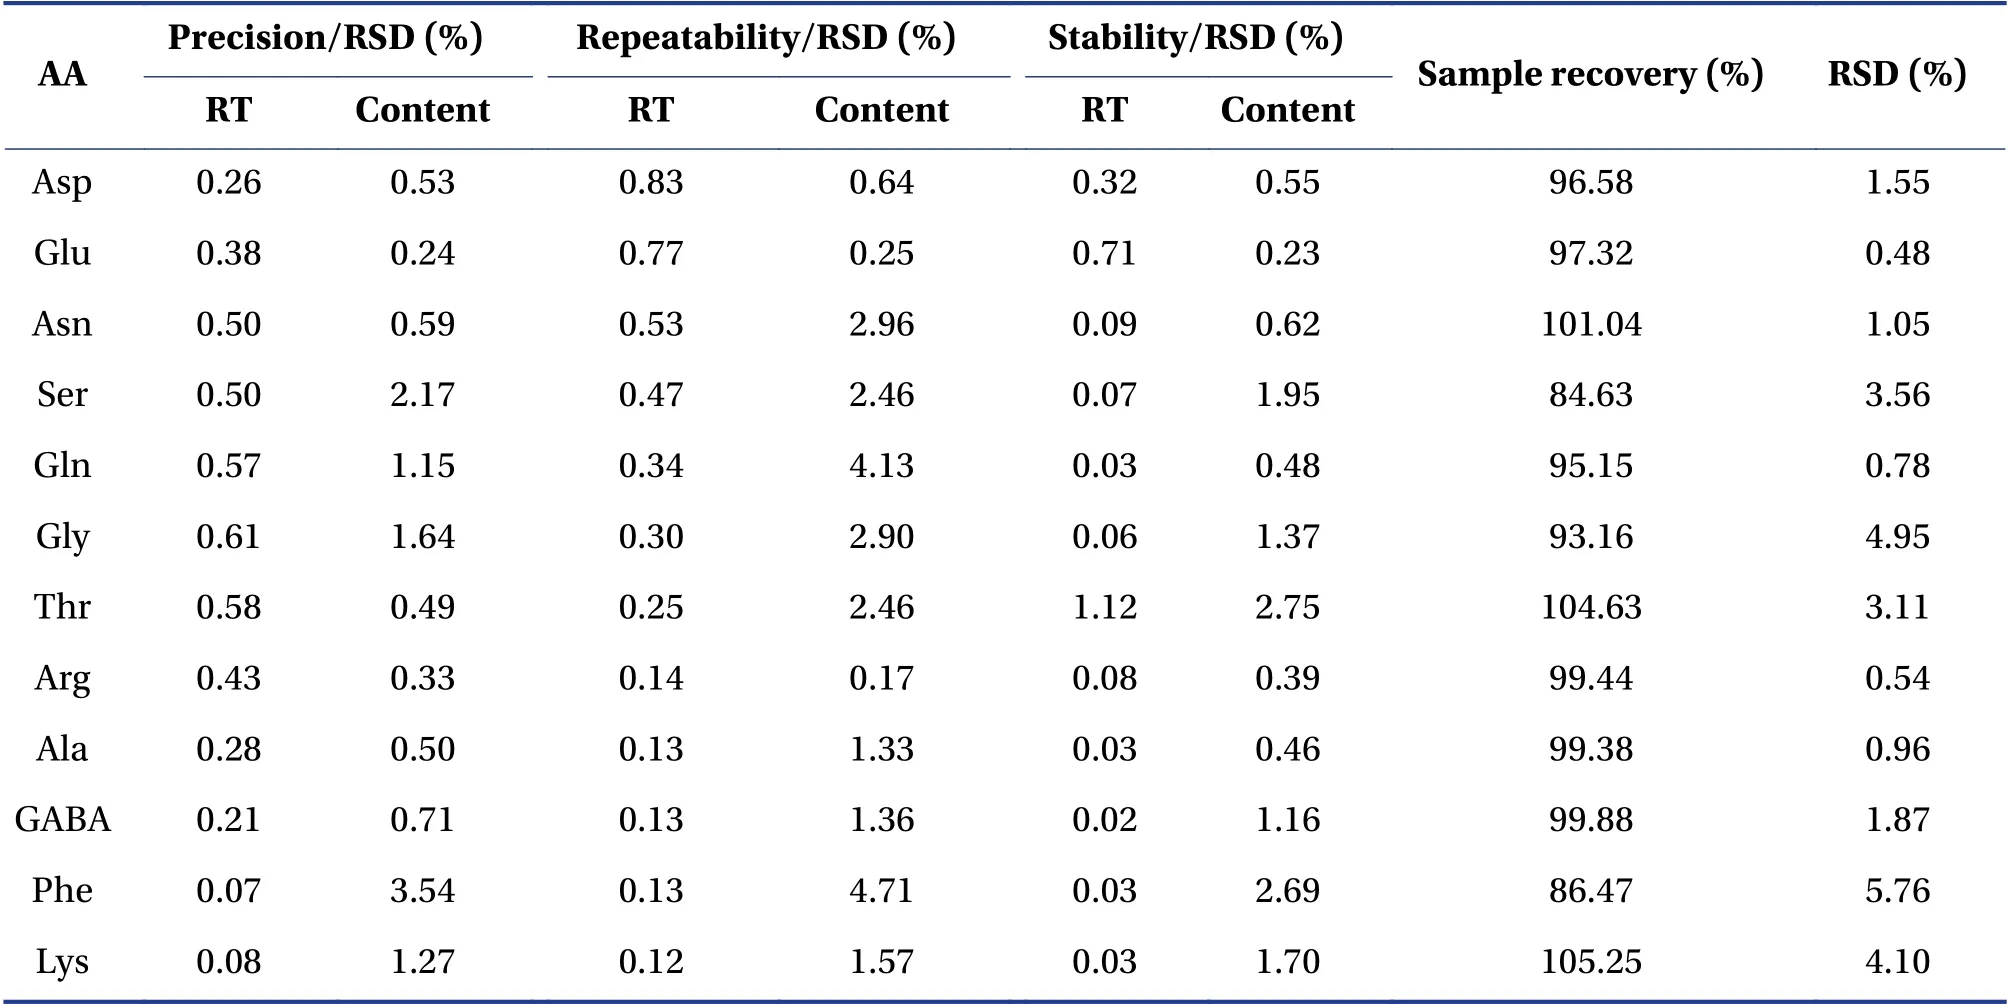
Table 3 The methodological results of precision,repeatability,stability,and sample recovery
3.3.2 RepeatabilityThe reproducibility of the method was evaluated by running six independent samples using a uniform sample preparation method.The RSD values(%)for the RT and the concentrations of the 12 different AAs were calculated as the appraisal index[Table 3,Repeatability/RSD(%)].
3.3.3 StabilitySample stability was investigated by injecting the same sample at 0,2,4,8,12,and 24 h.The RSD values(%)for the RT and the concentrations of the 12 different AAs were calculated as the appraise index[Table 3,Stability/RSD(%)].
3.3.4 Sample recoveryRecovery tests were performed on samples with known AA concentrations.The concentration of the AA standards was approximately 100% for the samples,with six replicates for each sample.Recovery(%)was calculated using the equation[(amountdetermined-amountoriginal)/ amountreference× 100%].The results are shown in Table 3.
3.4 Determination of AAs contents in PRA and PRR
The AAs contents of 21 batches of PRA and PRR were determined using the aforementioned methods.As shown in Table 4(PRA)and Table 5(PRR),the total AAs content in PRA was higher than that in PRR.The average AAs content in 21 batches of PRA was 8.106 9 mg/g,while that in 21 batches of PRR was 4.364 4 mg/g.There was a significant difference between the AAs contents of the two herbs(P<0.01).
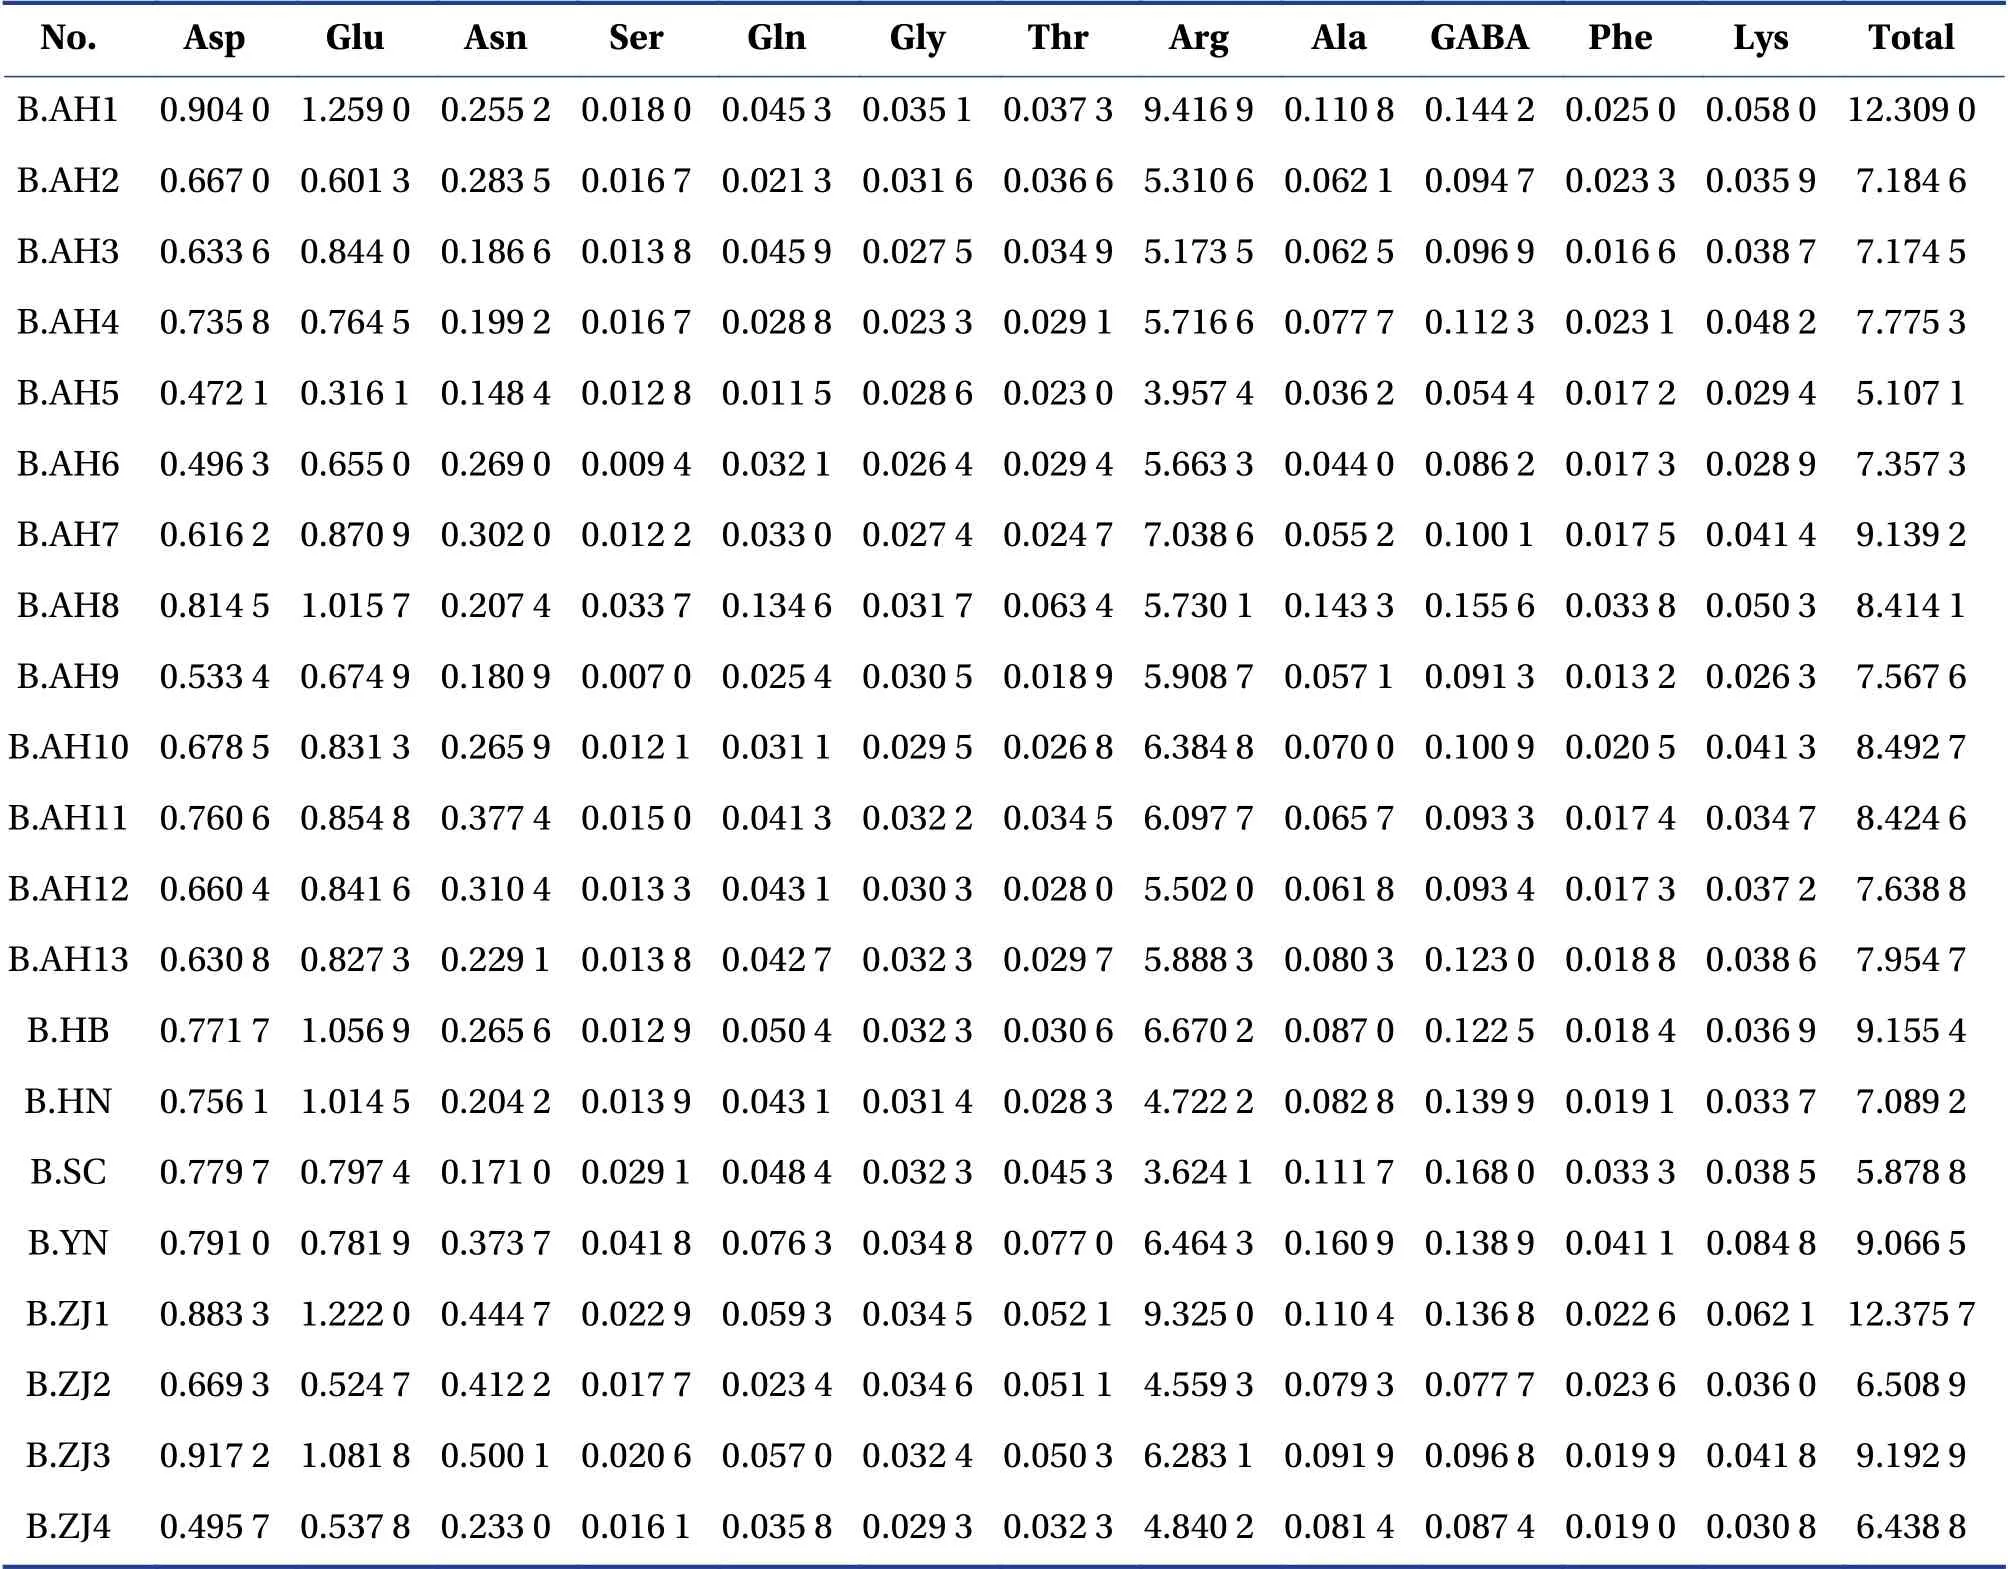
Table 4 Determination of contents of AAs from PRA(mg/g)

Table 5 Determination of contents of AAs from PRR(mg/g)
3.5 Pattern recognition
PCA was first conducted as an unsupervised method for the determination of the concentration of the 12 AAs in the existing batches of PRA and PRR to provide a comprehensive view.
To observe the clustering of the two groups more intuitively,a PCA 3D score plot was prepared(Figure 2A).As shown in the figure,the samples were clearly clustered into two groups,PRA and PRR,indicating that the AA contents could be used to effectively characterize PRA and PRR.To observe the clustering of each sample intuitively,HCA analysis of the 12 AAs was performed.The results,displayed in the form of heat maps(Figure 2B),show that the concentrations of Arg,Glu,and Asp in most batches of PRA are evidently higher than those in PRR,and the concentrations of GABA and Ala in PRR are significantly higher than those in PRA.PLS-DA was subsequently carried out to screen the main AAs present at significant levels in samples from various groups(Figure 2C).The R2Y and Q2Y values calculated using the SIMCA-P package were 0.948 and 0.897,respectively,suggesting an acceptable fitting degree and good prediction ability of the proposed PLS-DA model.According to the value of variable importance in projection(VIP)in PLS-DA,five AAs(Asp,Glu,Ala,GABA,and Arg)with significant differential expression in various groups were selected(VIP>1.0).The concentrations of the five AAs are presented in Figure 3,and the independent samples t-test showed significant differences between PRA and PRR with regard to the five AAs(P<0.01).

Figure 2 Pattern recognition analysis of AA contents of PRA and PRR

Figure 3 Average contents of the five characteristic AAs in PRA and PRR
To verify if the concentration of characteristic AAs can effectively distinguish PRA and PRR,an unsupervised PCA was carried out with the concentrations of Asp,Glu,Ala,GABA,and Arg as variables(Figure 4).The results of the analysis showed that PRA and PRR were clustered into two groups.
Furthermore,PCA was conducted to analyze the AA contents ofPaeonia lactifloraPall.from different origins.The results showed no clustering of PRA(Figure 5A and 5B)or PRR(Figure 5C and 5D)from the same origin,indicating that there is no obvious correlation between the origin of the herbs and the AA content.

Figure 4 Sore plot of principal component analysis conducted with the concentrations of Asp,Glu,Ala,GABA,and Arg as variables

Figure 5 The 3D score plots of PCA conducted with the concentrations of AAs in PRA and PRR from different regions
4 Discussion
Since most of the published studies focused on monoterpene glycosides and phenolic acids as differential evaluation indicators between PRA and PRR,paeoniflorin was the only chemical constituent for the evaluation of PRA and PRR in each edition of theChinese Pharmacopeia of the People's Republic of China(2020 edition).YU et al.[9]pointed out that the paeoniflorin contents in many batches of PRA were greater than those in PRR,on the basis of HPLC analysis of 32 batches of samples,which was inconsistent with the quality evaluation in the pharmacopeia standard(PRA>1.2%;PRR>1.8%).Moreover,it was inappropriate that only paeoniflorin content was used as the index of evaluation for the two herbs.Considering the concentration of additional key compounds,such as AAs,it is possible to improve the evaluation method forPaeonia lactifloraPall..
AAs are the primary metabolites of plants,and their biosynthesis and metabolism are closely related to the surrounding environment and different ecological factors,such as climate,soil,temperature,and humidity,which cause differences in their AA contents.Therefore,we attempted to characterize PRA and PRR based on the AA characteristic spectrum.In this study,it is worth noting that the types of AAs in PRA were similar to those in PRR,but there were significant differences in the content of AAs,especially Arg,Glu,Asp,GABA,and Ala,which could be used to distinguish PRA and PRR(P<0.01).
The results of AA content determination and cluster analysis suggested that PRR samples not only from different origins but also from the same origin,including in the Inner Mongolia Autonomous Region,showed significant differences in AA content.Nevertheless,the AA contents of PRA obtained from different regions were relatively similar.This result may be attributed to the different sources of the materials,as PRA was mainly artificially cultivated,whereas PRR was wild.Compared with artificial cultivation resources,wild products are rich in genetic structure and diversity,which facilitate variation and the interaction of genes with the environment[10].In addition,we used regions as indicators to perform cluster analysis.The results did not show obvious clustering,indicating that the differences in AAs of PRA and PRR were mainly caused by the different processing methods.
5 Conclusion
In this study,the OPA-FMOC pre-column derivation method was used to establish 21 common AA fingerprints.Furthermore,qualitative and quantitative analyses of AAs in PRA and PRR from different origins were carried out.The results showed that the method was simple,sensitive,and reliable,and it could be used for the evaluation and analysis of AAs in medicinal materials.In addition,five significantly different AAs in the two herbs were identified using pattern recognition technology.The findings of this study not only improve the distinction between PRA and PRR but can also be used to develop a new method based on the characteristics of AAs for the evaluation ofPaeonia lactifloraPall.and other TCM materials.
Acknowledgements
We thank for the funding support from the Guangdong Provincial Key Laboratory of Chinese Medicine for Prevention and Treatment of Refractory Chronic Diseases(No.2018B030322012).
Competing interests
The authors declare no conflict of interest.
 Digital Chinese Medicine2021年3期
- Digital Chinese Medicine的其它文章
- Quality 4.0 technologies to enhance traditional Chinese medicine for overcoming healthcare challenges during COVID-19
- Analysis of the hotspots and trends in traditional Chinese medicine immunomodulation research based on bibliometrics
- Novel pyrimidine-benzimidazole hybrids with antibacterial and antifungal properties and potential inhibition of SARS-CoV-2 main protease and spike glycoprotein
- Network pharmacology research and experimental verification of Huangqi(Astragalus Radix)and Jinyingzi(Rosae Laevigatae Fructus)in treating benign prostatic hyperplasia
- Comparison of mechanisms and efficacies of five formulas for improving blood circulation and removing blood stasis
- Research on classification diagnosis model of psoriasis based on deep residual network