
Micro-pinch formation and extreme ultraviolet emission of laser-induced discharge plasma∗
2021-09-28 02:18JunWuWang王均武XinBingWang王新兵DuLuoZuo左都罗andVassilyZakharov
Chinese Physics B 2021年9期
关键词:新兵
Jun-Wu Wang(王均武),Xin-Bing Wang(王新兵),†,Du-Luo Zuo(左都罗),and Vassily S.Zakharov
1Wuhan National Research Center for Optoelectronics,Huazhong University of Science and Technology,Wuhan 430074,China
2Keldysh Institute of Applied Mathematics,Russian Academy of Sciences,Moscow,Russia
Keywords:laser-induced discharge plasma,micro-pinch,electron temperature and density,extreme ultraviolet spectra
1.Introduction
In extreme ultraviolet lithography(EUVL),extreme ultraviolet(EUV)source is used not only in exposure source,[1]but also in actinic metrology.[2]There are three kinds of mask inspections:actinic mass blank inspection(ABI),actinic patterned mask inspection(APMI),and aerial image metrology system(AIMS),[3]each of which has a different demand for brightness,[4]which increases the complexity.[5]The source for mask inspection requires a high brightness output,rather than a high power output.[6]To meet these demands,the EUV light sources produced respectively from three kinds of plasma discharges have been proposed in recent years:Xe gas discharge produced plasma(Xe-GDPP),[7]Sn laser-produced plasma(Sn-LPP),[8]and Sn laser-assisted discharge plasma(Sn-LDP).[9]
In 2006,Jonkers compared EUV output power emitted from the LPP,Z-pinch plasma,and vacuum arc plasma in a tin vapour.[10]In 2011,Banine et al.compared the EUVemitting plasma characteristics such as spectra,formation of the plasma,and associated debris production in LDP source and LPP source.[11]In 2012,Schriever et al.illustrated that LDP was a simpler concept than LPP,indicating its advantages in the key technologies,such as power delivery and target material delivery.[12]Generally speaking,the conversion efficiency(CE)of Xe-GDPP needs to be improved and the cost of LPP is too high,but the Sn-LDP has the features of low cost,simple structure,reliable stability,high wallplug efficiency,and high target utilization efficiency.In 2015,Ushio[13]used liquid-tin-covered disc target LDP to obtain a peak irradiance of 145 W/mm2/sr.In 2017,a peak irradiance of 225 W/mm2/sr(an average irradiance of 145 W/mm2/sr)at a highest discharge frequency of 9.5 kHz was obtained.[13]Ushio has conducted the research and evaluation service by using the high brightness laser-assisted discharge-produced plasma EUV source in the EUV exposure and has analyzed the facility of the Netherlands Organization for Applied Scientific Research since 2017.
Laser triggered vacuum discharge is a mature technical means widely used as x-ray source,nanolithography,material engineering,nuclear physics,high energy ion source,highvoltage vacuum switch,and other fields.Laser ablation of cathode allows us to use any material as a fuel,it also improves the stability of discharge.For traditional LDP source,Z-pinch is the main mechanism,it requires strict discharge conditions.In this paper,micro-pinch is used as a new mechanism to simplify the discharge conditions and to create a smaller hot plasma zone.In designing such a source,knowing the process of micro-pinch formation is an important task especially in its application to EUV source.How the parameters and emissivity of micro-pinch plasma depend on the initial conditions and on the characteristics of the discharge is still unclear.By optimizing these parameters,it is hopeful to improve the emission in 2% bandwidth(±0.135 nm)centered at the wavelength of 13.5 nm,spectral purity and energy efficiency.
In this study,an LDP device triggered by a pulsed Nd:YAG laser is set up to investigate the discharge characteristics and the dynamic features of micro-pinch formation.Optical emission spectrometry(OES)is an effective and simple way to obtain the plasma parameters.Visible light spectrometer is built to investigate the evolution of electron temperature and density,which can be used as a reference for the best environment for EUV radiation.In the Sn plasma,it is found that efficient emission is obtained from 4d–4f and 4p–4d transitions of charged ions Sn8+~13+when the electron temperature is about 10 eV~30 eV and density is about 1018cm−3.Differences among the EUV spectra obtained with different laser energies,voltages,gap distances,and anode shapes are investigated by a flat-field grazing incidence EUV spectrometer.
2.Experimental setup
The experimental setup of LDP is shown in Fig.1,the pressure in the vacuum chamber was 1.0×10⁻³Pa.The cathode was a tin plate,the diameter and thickness were 6 cm and 4 mm,respectively.A Q-switched Nd:YAG laser(InnoLas,SpitLight compact 200)with a wavelength of 1064 nm and pulse width of 6 ns was focused on the surface of tin target at 45°with respect to the normal to the cathode surface.The diameter of laser spot was 80µm.The temporal signal of laser pulse was recorded by a photodiode detector(THORLABS,DET36A/M).
The anode was made of a stainless-steel hemisphere(radius R=5 mm or 10 mm)or a cone(cone angleΦ=60°),it was movable away from the cathode in a range of 2 mm~10 mm.The discharge current was sustained with a 36-nF capacitor charged up to 17 kV.The voltages and currents were measured by a high voltage probe(Tektronix P6015A)and a current monitor(Pearson 4997).
Optical emission spectroscopy(OES)was used by a spectrometer(Acton,SpectraPro-2750).The spectrometer was composed of a focus lens,an incident fiber,a grating and an intensified charge couple device(ICCD)camera(Princeton Instrument,PI-MAX-1300).The gate of ICCD was set to be 20 ns,groove density of the grating could be selected as 300 lines/mm or 2400 lines/mm.
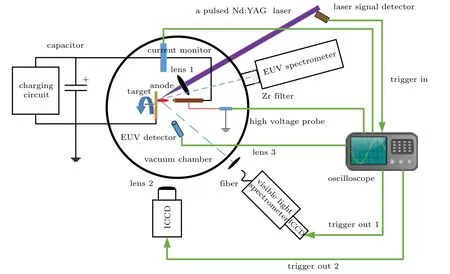
Fig.1.Experimental setup of laser-induced discharge plasma.
Another ICCD camera(Stanford 4 Quik-E)mounted with a zoom lens(sigma Marco)was used to visualize the image of a plasma plume in the discharge gap.Its minimum gate was 1.2 ns and sensitive band was 350 nm–920 nm.a planar mirror,a slit,a variable pitch concave grating,and a thermoelectrically cooled back-illumination x-ray charge coupled device(CCD)camera(Princeton Instrucments-SX:400).
An EUV detector was composed of an x-ray photodiode(AXUVHS5),a zirconium(Zr)film,and a bias circuit.The 500-nm-thick Zr film allows a spectral band of incoming radiation to shrink into a wavelength range between 6 nm and 18 nm.
An EUV spectrometer recorded the time-integrated EUV spectra.It was composed of a Zr film,a spherical reflector,
3.Experimental results
3.1.Discharge characteristics
When laser energy ILis 120 mJ,the voltage U is 7.5 kV,gap distance d is 5 mm,and the anode is hemispheric(R=10 mm),the voltage–current characteristic is shown in Fig.2.
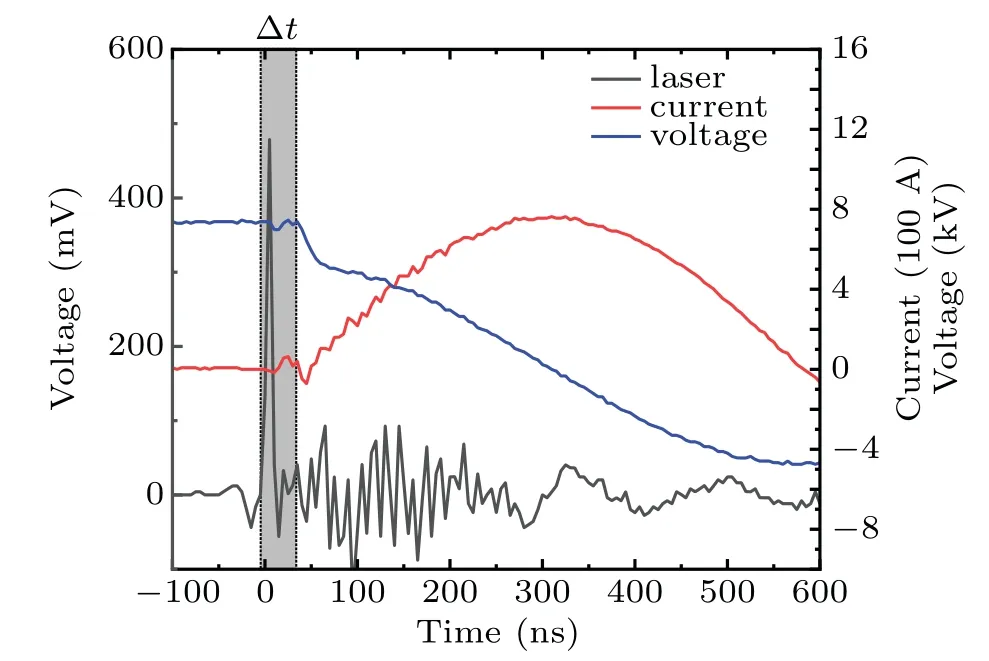
Fig.2.Laser,current,and voltage signals of laser-induced discharge plasma at 7.5 kV.
The starting process of laser triggered vacuum discharge can be divided into two stages.The first stage is that the laser pulse reaches the target surface at 0 ns,the laser plasma is produced and expanded to the anode,the current gradually increases and attains a peak of about 80 A at 20 ns after laser irradiation.High energy electrons are accelerated in the anode sheath between the expanding plasma front and the anode.
In the second stage of discharge,the voltage begins to decrease slowly at 30 ns,the current is determined by the Child–Langmuir’s“three-halves”law due to the gap reduction and expansion of the cathode plasma.In this stage,the velocity of voltage dropping increases due to the accumulation of ions in the gap and the formation of the region with the potential exceeding the applied voltage(“hump of potential”).The current rises at 50 ns,and reaches a top value of about 800 A at the maximum at 300 ns.The period of oscillation lasts about 1000 ns,then the gap is restored to its insulation state.
Discharge delay T is defined as the time interval between the moment when laser arrives and the moment when voltage is dropped.The delay is the time for the laser plasma to travel across the gap.As shown in Fig.2,there is a time interval(Δt)between the rising edge of laser and the falling edge of the voltage.Actually the delay caused by the detecting instrument should also be considered.Response time for the high voltage probe and laser signal detector are t1(4 ns)and t2(14 ns)separately.The signal delay associated with transmission in coaxial cable is evaluated by the delay characteristic(5 ns/m).The cable length between the high voltage probe and oscilloscope is 3 m,resulting in a delay t3(15 ns).The cable length between the laser detector and oscilloscope is 2 m,leading to a delay t4(10 ns).The detector is 1.5 m away from the target,and the time interval between the moment when the laser arrives and the moment when the laser is detected is t0(5 ns).T=Δt+t2−t1+t4−t3−t0=Δt(ns).As shown in Fig.3,under different discharge conditions,five shots are measured and averaged.It is found that higher laser energy,higher voltage,and shorter gap distance conduce to the reduction of the delay.
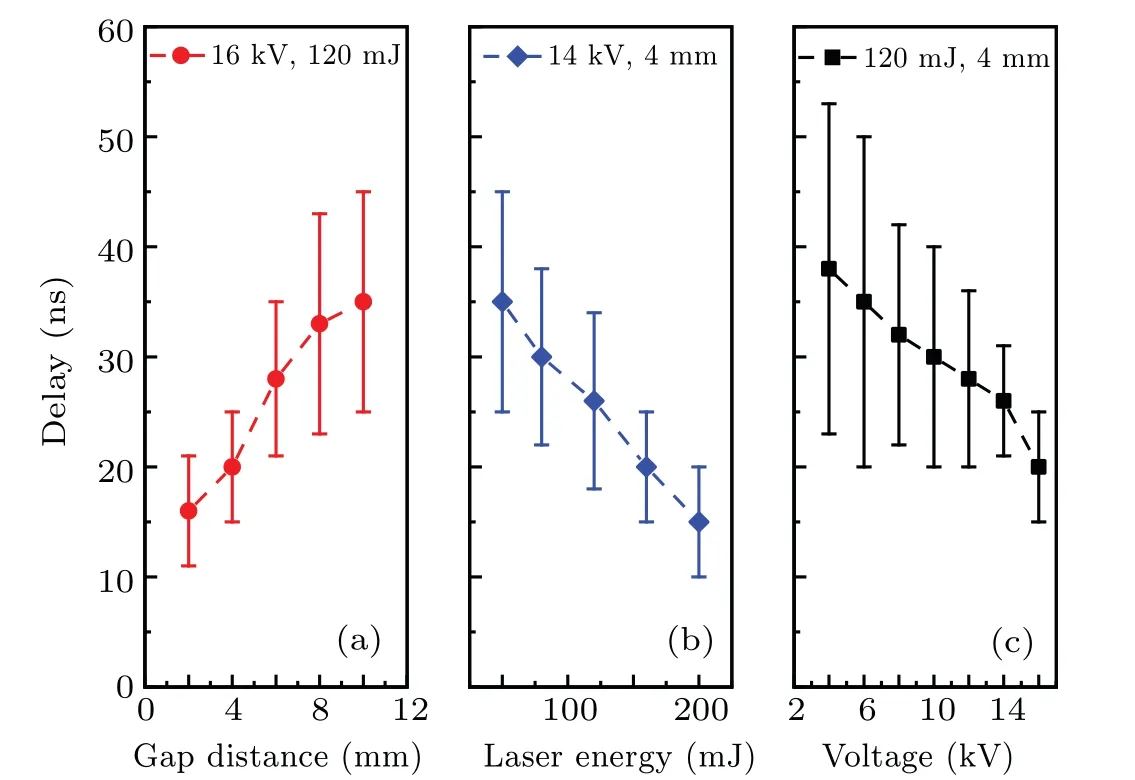
Fig.3.Discharge delay versus(a)gap distance at U=16 kV and I=120 mJ,(b)laser energy at U=14 kV and d=4 mm,and(c)voltage at I=120 mJ and d=4 mm.
Discharge current I(t)is described by a simple underdamped RLC circuit[14]as expressed in Eq.(1),the plasma produced between electrodes is represented equivalently by a resistance R and an inductance L,
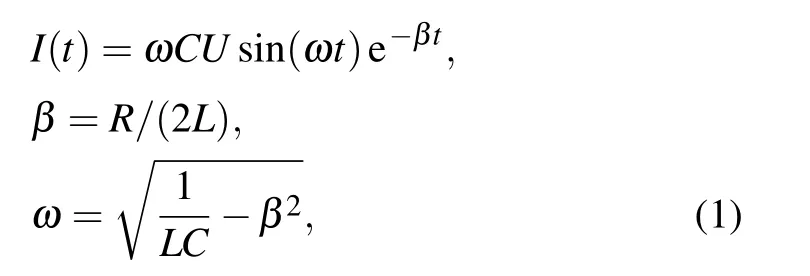
where C is the capacitance,U is the initial voltage,βis the damping coefficient,andωis the resonant frequency.The equivalent resistance and inductance are calculated to be 0.7Ω and 2.65µH.
With the discharge voltage increasing to 14.5 kV,the current rises and reaches a maximum value of 1.4 kA,and an EUV signal can be detected during the current rising as shown in Fig.4.A sharp current spike appears at about 150 ns,which is caused by the formation of micro-pinch.The first EUV peak occurs at about 20 ns,it is the product of laser plasma and lasts about 2 ns.The second EUV peak appears at about 200 ns after the laser triggering.It is found that the EUV radiation in LDP comes mainly from the discharge plasma rather than the laser plasma.
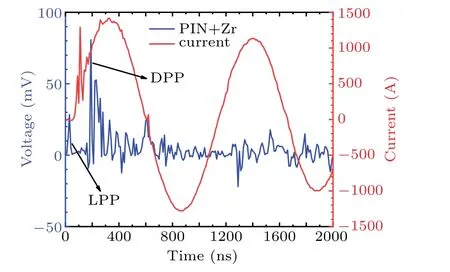
Fig.4.Time-dependent current and EUV signal of laser-induced discharge plasma at 14.5 kV.
3.2.Micro-pinch formation
3.2.1.Principle of micro-pinch
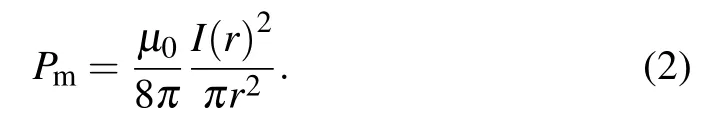
Micro-pinch can form in a relative low current and conduce to the emission of EUV.[15]Micro-pinch develops when the radial compressive pressure of annular magnetic field Pm[16]exceeds the thermal pressure Pt.[17]The magnetic pressure is related to the radius of plasma column r and the current distribution I(r)as shown below:[18]
Assuming that the quasi-neutral plasma is in local thermodynamic equilibrium(LTE),the thermal pressure is related to the electron density Ne,electron temperature Te,and averaged charge state Z as shown in the following equation:[19]

Hereµ0is permeability of vacuum and k is the Boltzmann constant.
For laser energy of 120 mJ,the laser power intensity on the cathode is~1011W/cm2,the initial electron temperature and density of plasma near the cathode are calculated to be about 30 eV and 1021cm−3,respectively,by a onedimensional code-MULTI.As the plasma expands,temperature and density fall rapidly,the plasma expansion velocity,which is given by Cs=(γkTe/Mi)1/2,whereγis the ratio of specific heat and Miis the ion mass,is calculated to be 6.8×10³m/s.The front of cathode plasma is about 2 mm away from the cathode at about 300 ns.The temperature and density in the front of cathode plasma at this time are 2 eV–4 eV and 1016cm−3–1017cm−3,Ptis calculated to be about 4 kPa–70 kPa at this place.At a voltage of 14.5 kV,the current can reach 1000 A at 300 ns.Assuming the radius of plasma column in the front of cathode plasma is 0.5 mm,Pmis calculated to be about 64 kPa.The magnet pressure can overwhelm the thermal pressure in the front of cathode plasma,thus micro-pinch occurs in the middle of the gap at about 300 ns.This is further supported by the ICCD images below.
Higher current and a more concentrated current distribution are beneficial to the formation of micro-pinch.[20]A hot point zone,also called‘neck’,forms during a micro-pinch.[21]
3.2.2.Evolution of plume
At the voltage over 10 kV and laser energy of 10 mJ,the micro-pinch can be observed from the time-resolved ICCD imaging,where the gate is exposed for 5 ns.
At a voltage of 10.0 kV and laser energy of 120 mJ,the variation of plasma plume is photographed by the ICCD as shown in Fig.5.At 50 ns,the electric field makes the expanding cathode plasma more concentrated on the discharge axis,and the front of cathode plasma is about 1.9 mm away from the cathode.At 150 ns,the front of cathode plasma reaches a position about 2.7 mm away from the cathode,meanwhile a‘neck’forms at a position about 1.5 mm away from the cathode,and the electron density and temperature increase greatly at this point.At 250 ns,the front of cathode plasma is about 3.6 mm away from the cathode,and the radius of the‘neck’expands and then a stable arc forms.The front of cathode plasma keeps on approaching to the anode with an average velocity of about 8.5×10³m/s.The result is very close to the Cscalculated in Subsubsection 3.2.1.
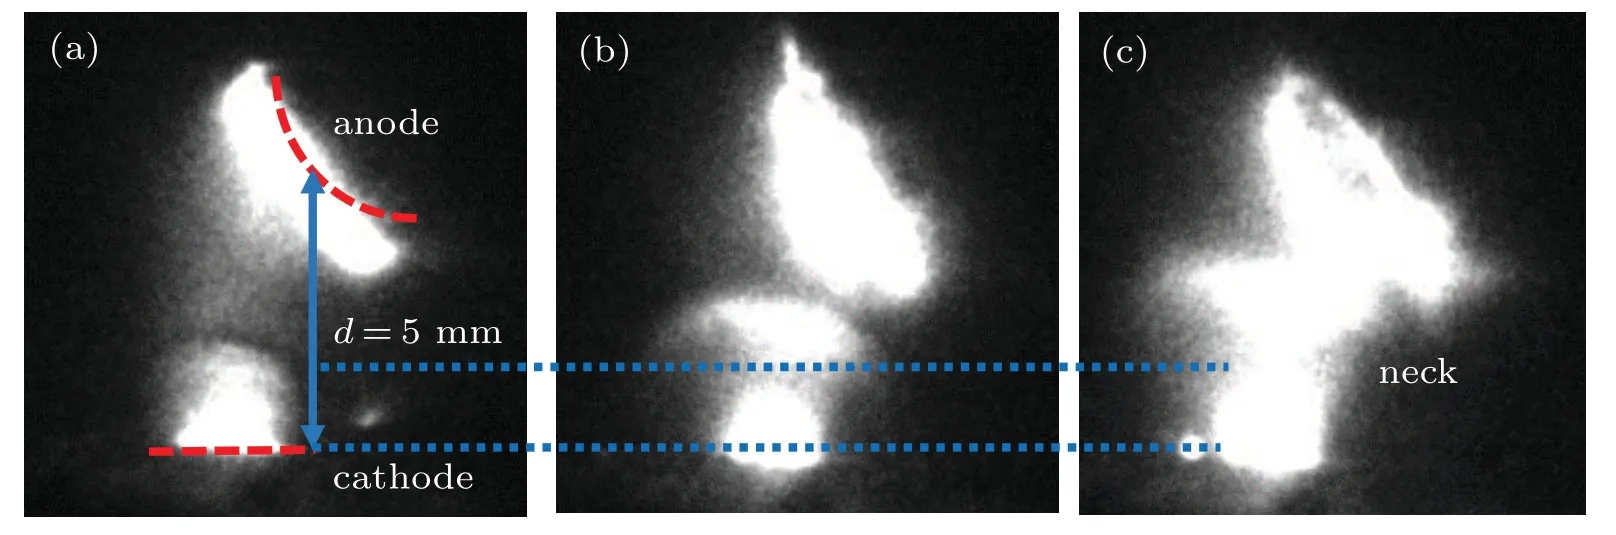
Fig.5.Formation of‘neck’near the expansion front of cathode plasma photographed by ICCD at t=50 ns(a),150 ns(b),and 250 ns(c).
3.2.3.Influence of discharge conditions
The shape of anode has an influence on the formation of micro-pinch,two hemispheric anodes with different radii are compared at a voltage of 12 kV and laser energy of 120 mJ,images of plasma at 250 ns are shown in Fig.6.An anode with a smaller anode creates a more intensive electric field near the discharge axis.The radius of plasma,especially the part near the position of‘neck’,is smaller.
The laser energy also has an influence on the formation of micro-pinch,images of plasma at 350 ns with different laser energies of 120 mJ and 50 mJ at 14.5 kV are shown in Fig.7.A larger laser energy improves the light emission during the micro-pinch formation,and the high temperature zone is closer to the cathode with a low laser energy.
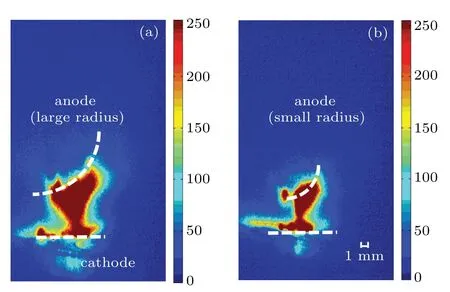
Fig.6.Formation of‘neck’photographed by ICCD with(a)large radius(10 mm)and(b)small radius(5 mm)hemispheric anode.
A lower energy laser conduces to the reduction of initial plasma temperature and density,a stronger electric field can improve the current density,[22]so the micro-pinch can occur at an earlier time and a place closer to cathode.However,considering the EUV-emitting mechanism,a later time that micro-pinch occurs is preferred because the plasma can be compressed into a high-temperature and high-density state.[23]

Fig.7.Formation of micro-pinch photographed by ICCD with laser energy of(a)120 mJ and(b)50 mJ.
3.3.Optical emission spectra
3.3.1.Tin emission spectra
The spectra of Sn I and Sn II in 500 nm–600 nm in LDP at 200 ns are recorded as shown in Fig.8.Here the intensities of Sn II 556.19 nm,558.89 nm,and 579.92 nm are much stronger than that of Sn I 563.17 nm,the most of tin vapor is ionized.The spectra in five conditions are compared.A higher voltage,higher laser energy,shorter gap distance,and sharper anode improve the line intensities and widen the line widths.
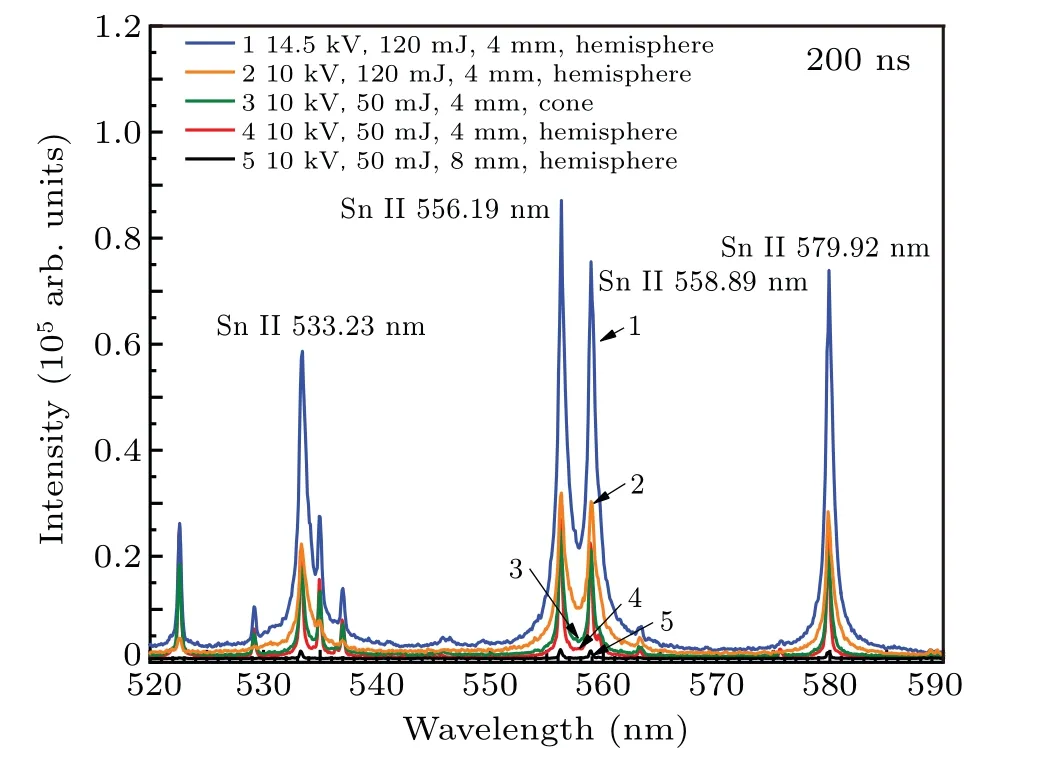
Fig.8.Tin spectra in LDP in different conditions at 20 ns.
3.3.2.Electron temperature and density
The plasma temperature represents the ability of the source to excite the electrons in the outer layer,and the electron density is an important parameter of the ionization degree.Assume that the plasma is in the local thermal equilibrium(LTE),that the energy level population of atoms or ions satisfies the Boltzmann distribution,that the ionization state is determined by the Saha equation,and that the plasma radiation energy density satisfies the Planck radiation law,then the ratio of two lines will be given as follows:[24]
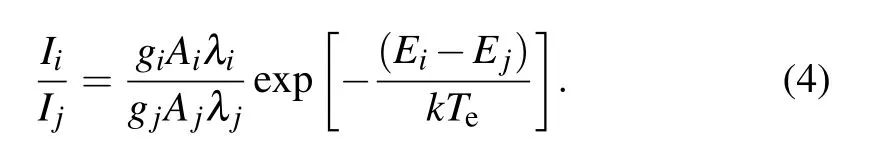
Here,I is the line intensity,g is the degeneracy,A is the spontaneous probability,E is the energy of the upper state,and k is the Boltzmann constant.
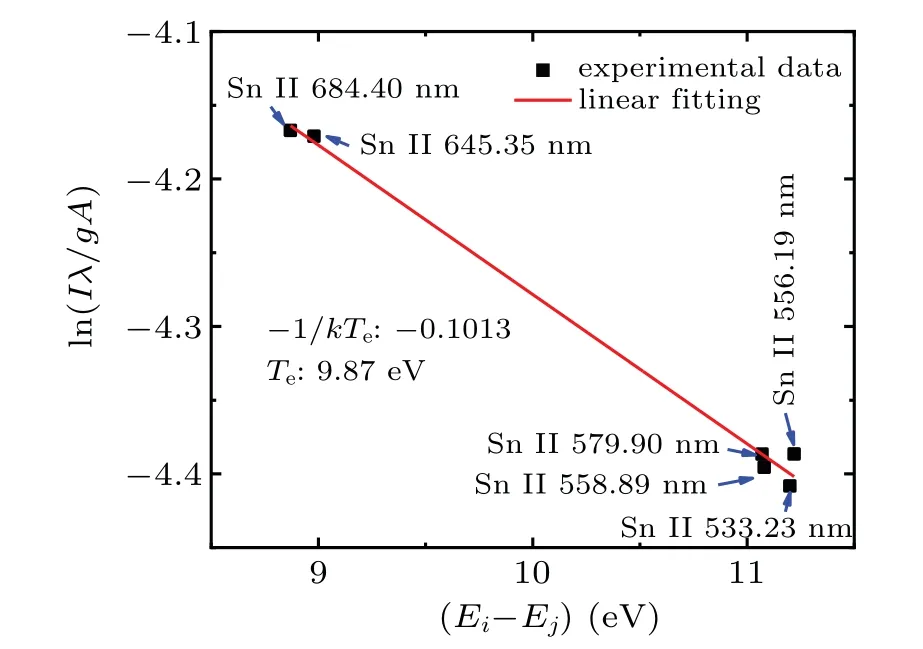
Fig.9.Boltzmann plot for electron temperature calculating.
For the same charge state,the relative intensity of the emission line can be used to calculate the electron temperature of the plasma.Electron temperature can be derived from Boltzmann plot.Six lines of SnII:684.4 nm(6p2P1/2→6s2S1/2),645.4 nm(6p2P3/2→6s2S1/2),579.9 nm(52D5/2–42F7/2),558.9 nm(4f2F2/5→5d2D3/2),556.2 nm(6d2D5/2→6p2P3/2),and 533.2 nm(6d2D3/2→6p2P1/2)are chosen.A plot of the natural logarithm of(I/gAλ)versus the energy of each upper state for a series of lines yields a slope of 1/kTe.For example,the Boltzmann plot at 500 ns in condition1is shown in Fig.9,the slope is−0.1013 and the temperature is 9.87 eV.
The width of a spectral line is affected by the natural broadening,instrumental broadening,Doppler broadening and Stark broadening.The natural broadening is negligible,then the profile of the measured line is accurately fit by a convolution of Gaussian(including instrumental broadening and Doppler broadening)and Lorentzian(Stark broadening)line profiles,which is a Voigt profile.The instrumental broadening decreases to about 0.015 nm by applying a grating with a groove density of 2400 lines/mm and reducing the incident slit width of the spectrometer to 18µm.The profile of Doppler broadeningΔλdis caused mainly by high-speed flight of plasma expansion,which isλd=λVz/c.The line Sn II 579.92 nm is chosen to calculate the electron density,the experimental results show that the flight velocity of tin particles Vzis on the order of 106cm/s,and that Doppler broadening is about 0.02 nm.The Stark broadening depends on the local field of both electrons and ions,here contribution of ions is negligible.The Stark broadening is de-convoluted from the Voigt fit.Electron density neis derived from the FWHM of a Stark-broadened lineΔλas shown below,[25]where w is the electron-impact parameter for a quoted density n=1016cm−3.
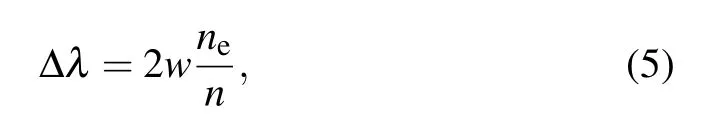
where w is the electron-impact parameter for a quoted density n=1016cm−3.The evolution of electron temperature and density in different conditions are compared as shown in Fig.10.At each time point,5 shots are measured and averaged.The electron temperature and density increase promptly with the increase of current,and reach their maximum values at 500 ns right after the current peak,then dropped slowly.It is found that the first current peak has the most significant heating effect on plasma.With a high voltage,a high laser energy and a shape anode and a small gap distance,the time of peak is put off due to a longer heating process,and the highest electron temperature can reach 9.9 eV,and the highest electron density can arrive at a value of 1.4×1019cm−3.
For the system to be considered as being in LTE,the transitions must also be dominated by collisional rate rather than radiative rate,the minimum electron density is referred to as the McWhirter criterion as shown below.

Considering that the maximum energy level interval is E=2.3 eV and the maximum temperature of plasma is T=10.0 eV,the minimum electron density is calculated to be ne>5.4×1015cm−3,so,the LTE is suitable for our case.

Fig.10.Electron temperature and density evolution in LDP under different conditions.
3.3.3.Estimation of conductivity
When electron temperature and density are known,the conductivity can be estimated from a modified Zollweg &Libermann expression[26]as given below.
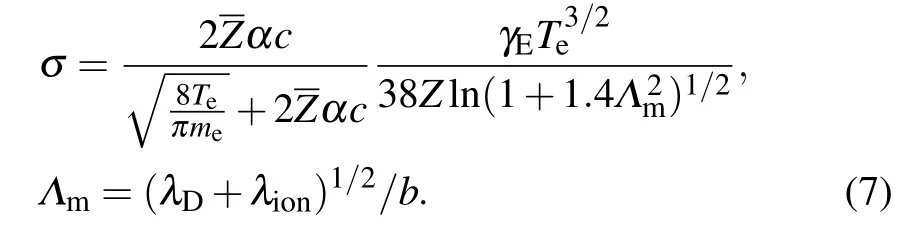
Here,αis the fine structure constant,c is the light speed in vacuum,γEis the electron impact correction factor,λDand λionare the Debye radius and average ion radius.The average ionization state¯Z is calculated by the Colombant&Tonon model,[27]which is a simple collisional radiative equilibrium(CRE)model.
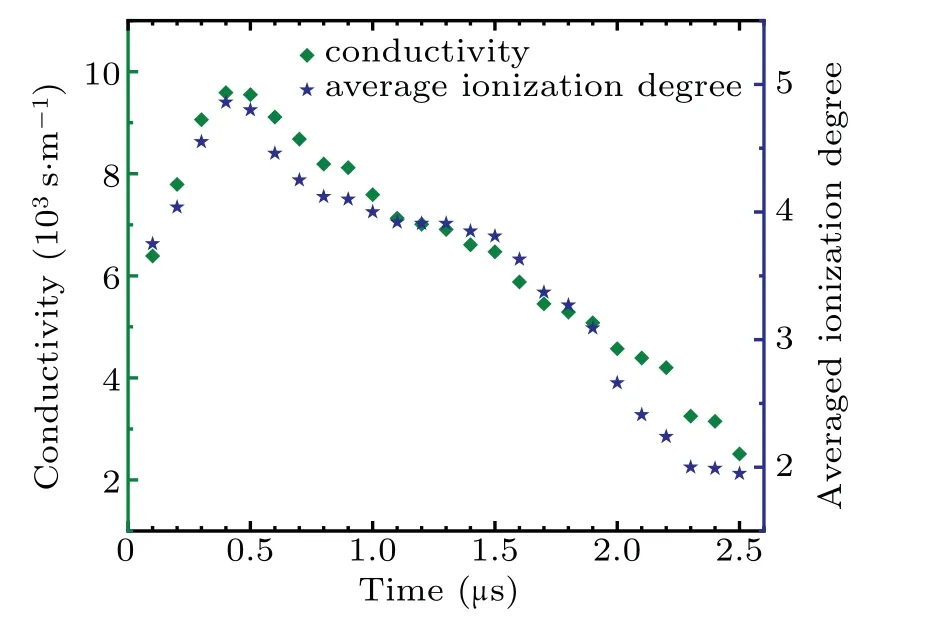
Fig.11.Conductivity and average ionization degree varying with time in LDP.
As shown in Fig.11,the change of conductivity and average ionization degree with time are basically consistent with temperature.The average ionization degree is about 4 in the current rising phase,and the conductivity is about(2~10)×103S/m.The resistance of plasma column is expressed as R=d/(σπr2),where r is the average radius of plasma column;assuming that the averaged r is equal to about 1 mm from the ICCD image,the resistance varies from a few tenths of an ohm to a few ohms.The result verifies the correctness of the RLC model mentioned above in Subsection 3.1.
3.4.EUV spectra
In an EUV-emitting plasma,the in-band radiation is due to the generation of 4p64dn–4p54dn+1+4dn−14f transitions of Sn8+–Sn13+ions.It forms an unresolved transition array(UTA)near 13.5 nm.[28]The radiation of 14 nm–18 nm comes from the ions with lower charge states.To discuss the influence of discharge conditions on EUV emission,five different conditions are adopted as shown in Table 1.
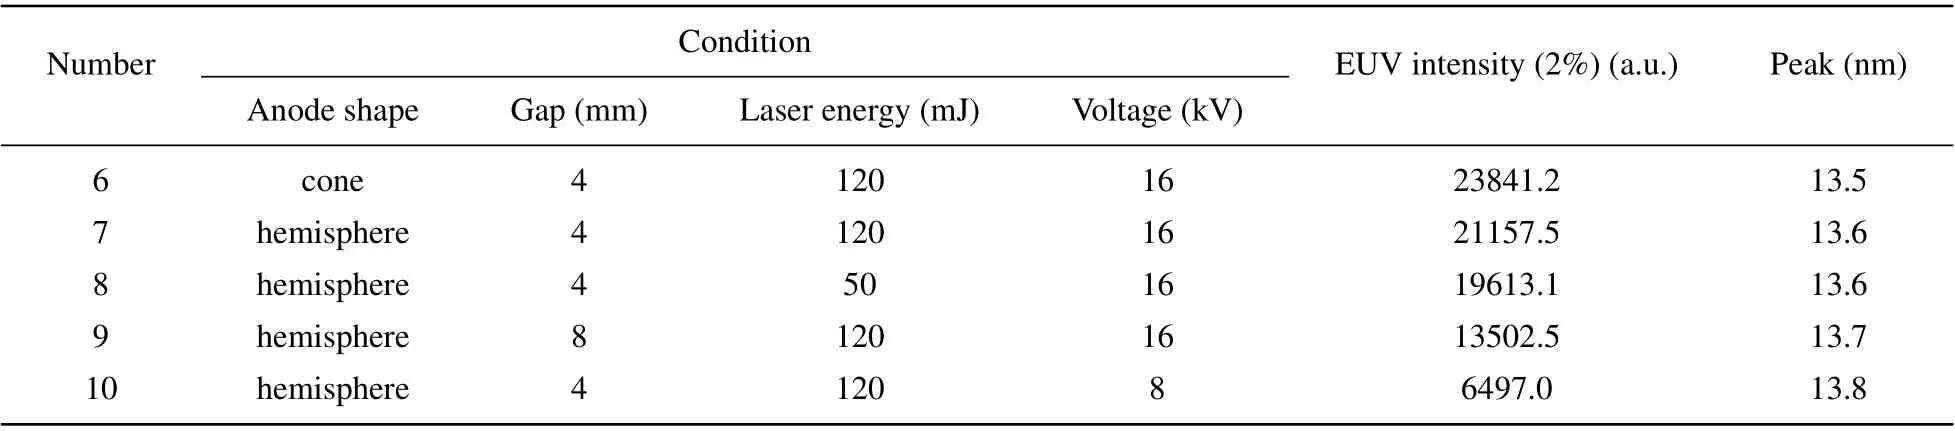
Table 1.EUV spectral intensities under different laser and discharge conditions.
The spectra are measured as shown in Fig.12.Using the integration of EUV spectrum intensity(13.5 nm,2% bandwidth)to represent the relative EUV emission intensity,the in-band EUV emissions are discussed under different conditions.It is found that a shorter gap distance,a sharper anode,a higher energy laser,and a higher voltage conduce to the improvement of the EUV emission;the wavelength peak also moves closer to 13.5 nm.
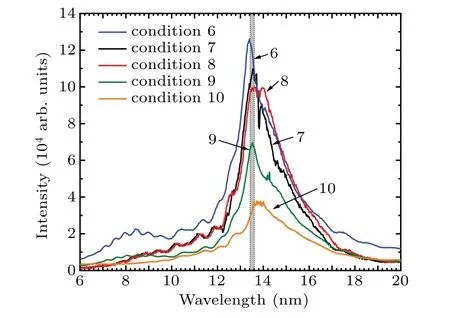
Fig.12.Sn-EUV spectra in LDP under different conditions.
4.Discussion
In the LDP source,Z-pinch and micro-pinch are always discovered in the building process of current individually or together,[29]due to the competition between magnetic pressure and thermal pressure.Despite the similar mechanisms,they are different in some aspects.
Micro-pinch usually occurs near the front of cathode plasma jet in the first few hundreds of nanoseconds.[30]At this moment,a large part of plasma in the gap comes from the laser ablation,a small part comes from the current ablation,the plasma is mainly concentrated near the cathode,the current is relatively low,only a small part of the plasma can satisfy the relationship:Pm>Pt,therefore only a‘neck’or a‘point’zone of high temperature forms.
The Z-pinch usually appears during the current peak when a plasma column forms.[32]At this moment,the plasma in the gap comes comes from the current ablation of cathode,the temperature and density of plasma are both relatively high,the distribution of plasma is more uniform and the radius of plasma column is larger,thus the formation of pinch requires higher current(about 10 kA).A larger plasma zone can satisfy the relationship:Pm>Pt,a‘needle’zone forms.[33]
It is found that both Z-pinch and micro-pinch require not only high current peak but also high current rising rate,otherwise the long time expansion of plasma makes it hard to compress the plasma.[34]Although the Z-pinch plasma can reach a higher temperature,which is beneficial to the EUV production,micro-pinch plasma has its advantages,i.e.,a relatively low energy injection and a more concentrated emission zone.[35]The small plasma size can reduce the optical depth and selfabsorption,so it is easier for EUV collection.[36]

Fig.13.Delay between micro-pinch formation and laser arrival(black line)and in-band EUV emission(red line)with different laser energies.
The formation of micro-pinch has more requirements for the parameters of laser.The energy of laser cannot be too low or too high,the plasma with initial temperature too low cannot reach an ideal temperature even after the compression process,and the plasma with initial temperature too high is hard to confine.At a voltage of 16 kV,delay between micropinch formation and laser arrival and the in-band emissions of different laser energies are shown in Fig.13.The delay increases with laser energy increasing,which means that higher current is needed in micro-pinch.When the laser energy is lower than 10 mJ,the EUV signal cannot be detected.When the laser energy is higher than 170 mJ,the in-band EUV emission decreases,which means the micro-pinch is not formed effectively.
Assuming that the radiation is described by the Planck radiation formula and the form of the radiation opacity function is determined by the optical depth,the intensity of the extreme ultraviolet radiation within 2% bandwidth of the wavelength of 13.5 nm can be expressed as

Here x=hν/kT,x1=90.9309(eV)/kT,x2=92.7679(eV)/kT,f(τEUV)≈2τEUVis the radiation opacity function for a plasma column,andτEUVis the optical depth which is determined by the plasma size.It is found that plasma temperature and radius of plasma column at the‘neck’are the key factors in EUV radiation when micro-pinch occurs.
For a shorter gap,the current rises after a shorter delay,and the initial plasma temperature and density do not decrease too much.For a higher energy laser,initial plasma temperature and density are relatively high,and current rises after a shorter delay.In these two cases,the formation of micro-pinch requires higher current,which brings more effective joule energy injection.According to the results of Romanov et al.,[23]the distance between‘neck’positions is related to the laser energy.For the laser of higher energy,the position of‘neck’is closer to the middle position of the gap,which is beneficial to the radial EUV radiation.
For a sharper anode,the distribution of electric field intensity and current density are more concentrated around the discharge axis.The expansion of cathode plasma is more concentrated in the axial direction,the radius is relatively small when micro-pinch occurs,which is verified as indicated in Fig.6.
For a higher voltage,current is relatively high,it is easier to meet the requirement for micro-pinch formation.Once micro-pinch occurs,the reduction of plasma radius and rise of plasma temperature and density require a higher current to maintain the compression process.Otherwise the plasma at the‘neck’position expands radially again.A higher voltage can extend the duration of micro-pinch by improving current rise rate.
5.Conclusions
In this paper,an LDP EUV source is set up and the EUV time domain signals are investigated.It is found that the emission of LDP-EUV occurs during the current rise due to the formation of micro-pinch.And the formation of a micro-pinch in LDP conduces to the improvement of the EUV output effectively when the current reaches the threshold of 1 kA.
The electron temperature,density and EUV spectra under different conditions are compared.It is found that a shorter gap distance,a sharper anode,a higher energy laser,and a higher discharge voltage are effective in improving plasma temperature,density,and EUV emission in LDP.
A higher current with a shorter rising time is the key to the improvement of the electric energy utilization,spectral purity,and EUV CE in our future work.
猜你喜欢
政工学刊(2021年6期)2021-06-08
少儿画王(3-6岁)(2020年10期)2020-09-13
科技传播(2019年24期)2019-06-15
学生天地(2016年23期)2016-05-17
西南军医(2016年6期)2016-02-19
军事体育学报(2014年3期)2014-02-27
军事体育学报(2014年3期)2014-02-27
中国火炬(2011年4期)2011-08-15
21世纪中学生作文·中考适用(2008年3期)2008-08-27
- Chinese Physics B的其它文章
- Multiple solutions and hysteresis in the flows driven by surface with antisymmetric velocity profile∗
- Magnetization relaxation of uniaxial anisotropic ferromagnetic particles with linear reaction dynamics driven by DC/AC magnetic field∗
- Influences of spin–orbit interaction on quantum speed limit and entanglement of spin qubits in coupled quantum dots
- Quantum multicast schemes of different quantum states via non-maximally entangled channels with multiparty involvement∗
- Magnetic and electronic properties of two-dimensional metal-organic frameworks TM3(C2NH)12*
- Preparation of a two-state mixture of ultracold fermionic atoms with balanced population subject to the unstable magnetic field∗