
Stability of liquid crystal systems doped withγ-Fe2O3 nanoparticles∗
2021-09-28 02:18XuZhang张旭NingningLiu刘宁宁ZongyuanTang唐宗元YingningMiao缪应宁XiangshenMeng孟祥申ZhenghongHe何正红JianLi李建MingleiCai蔡明雷TongzhouZhao赵桐州ChangyongYang杨长勇HongyuXing邢红玉andWenjiangYe叶文江
Chinese Physics B 2021年9期
关键词:宁宁
Xu Zhang(张旭),Ningning Liu(刘宁宁),Zongyuan Tang(唐宗元),Yingning Miao(缪应宁),Xiangshen Meng(孟祥申),Zhenghong He(何正红),Jian Li(李建),Minglei Cai(蔡明雷),Tongzhou Zhao(赵桐州),Changyong Yang(杨长勇),Hongyu Xing(邢红玉),and Wenjiang Ye(叶文江),†
1School of Sciences,Hebei University of Technology,Tianjin 300401,China
2School of Physical Science and Technology,Southwest University,Chongqing 400715,China
3Hebei Jiya Electronics Co.Ltd.,Shijiazhuang 050071,China
4Hebei Provincial Research Center of FPD Engineering Technology,Shijiazhuang 050071,China
Keywords:γ-Fe2O3 nanoparticles,stability of liquid crystal system,clearing point,dielectric properties,electro-optical properties
1.Introduction
Liquid crystal display(LCD)devices have been widely used in display fields due to their advantages such as lightweight,portability,low power consumption,fast refresh frequency,low driving voltage and low radiation.[1,2]With the improvement of people’s living standards and the rapid development of the display industry,researchers gradually put forward higher requirements for the performance of LCD devices.For example,in terms of fast response,LCD devices are restricted due to limitations of materials and display methods.During the high-speed dynamic display process,a series of phenomena such as image sticking and smearing often appear in LCD devices,which greatly affects the display effect and viewing experience.Therefore,response time is an important research topic for development of LCD devices.[3,4]Only by developing fast-respond devices can LCD devices show stronger competitiveness.
With the deepening of research on nanoparticles,doping nanomaterials has gradually developed into the most efficient method to improve the performance of LC.[5]Inspired by ferroelectric phase LCD devices,[6,7]people focus on LC doped with ferromagnetic nanoparticles.[8]Theγ-Fe2O3nanoparticles are one of the representative particles.The LC doped withγ-Fe2O3nanoparticles has the advantages of extremely fast response speed(compared with pure LC,the response speed of doped LC can be increased by 3 times),low driving voltage and so on.[9]It is a material that can significantly improve the characteristics of LCD.However,the stability of LC systems is a necessary factor to determine whether the LC can be widely used in the display field.If there is no good stability,it will be like ferroelectric phase LCD devices that are still restricted in display applications even with nearly perfect characteristics.[10]Therefore,it is of great significance to study the stability of LC systems doped withγ-Fe2O3nanoparticles.
This paper focuses on the stability of an LC system doped withγ-Fe2O3nanoparticles.The physical properties(clearing point,dielectric properties)and electro-optical properties of the system were measured at different times.According to the experimental results,the stability of the system was analyzed from the macro level.Finally,the stability of the impurity ions in the system was evaluated by comparing the residual direct current voltage(RDCV)values of the system at different times,which further explains the stability of the system at the microscopic level.The experimental results prove that the LC system can still maintain good stability after dopingγ-Fe2O3nanoparticles into the pure LC.
2.Experimental materials
2.1.Fabrication ofγ-Fe2O3 nanoparticles
Theγ-Fe2O3nanoparticles were fabricated by chemically induced transition on the basis of a precursor(FeOOH/Mg(OH)2)obtained by the chemical co-precipitation method.[11–13]For preparation of the precursor,FeCl3,Mg(NO)3and NaOH aqueous solutions were fully mixed to obtain a mixture of solution.The obtained mixed solution was heated until boiling.At the same time,in order to make a full reaction,the mixture should be stirred continuously during the heating process.After boiling for 5 min,let it cool down to get the precursor.Afterwards,γ-Fe2O3nanoparticles were prepared by chemically induced transition.Used water bath to heat the FeCl2solution to 70°C,and kept this temperature during the fabrication process.Added the prepared FeOOH/Mg(OH)2to the above solution,then added a small amount of oleic acid after 30 min,continued to keep the temperature at 70°C,and stopped heating after 40 min.The precipitation ofγ-Fe2O3nanoparticles appeared after cooling,and a sample ofγ-Fe2O3nanoparticles could be obtained after a series of physical treatments.
2.2.Morphology characterization ofγ-Fe2O3 nanoparticles
Theγ-Fe2O3nanoparticles coated with oleic acid were prepared by the surface modulation technology.A transmission electron microscope(TEM)was used to analyze and characterize the microscopic shape,particle size and distribution state of theγ-Fe2O3nanoparticles prepared.[14]
Figure 1 shows the TEM micrograph with a magnification of 29000 times.It can be seen that theγ-Fe2O3nanoparticles coated with oleic acid appear to be approximately spherical.

Fig.1.TEM micrograph ofγ-Fe2O3 nanoparticles.
2.3.Fabrication of the LC material doped withγ-Fe2O3 nanoparticles
The pure LC material used in this experiment is an LC with negative dielectric anisotropy whose model is FFS1.In order to prepare the doped LC material,firstly took a certain amount ofγ-Fe2O3nanoparticles coated with oleic acid,added them to the n-hexane solution and uniformly mixed through ultrasonic treatment to obtain the n-hexane-based magnetic liquid with a certain volume fraction.Afterwards,took out a small amount of n-hexane-based magnetic liquid(the volume fraction is known),added it to 2–5 times volume of the n-hexane solution for dilution,and mixed the diluted magnetic liquid with pure LC.Then used shaker to mix them uniformly,while heating to volatilize n-hexane,and finally obtained the uniformly mixed LC material doped withγ-Fe2O3nanoparticles.
3.Experimental measurement
3.1.Clearing point
The clearing point is one of the important physical properties of LC materials.By measuring the clearing point temperature of the doped LC material at different times,the temperature stability of the doped LC material can be analyzed,which is of great significance for studying the stability of the doped LC system.
In the experiment,the temperature of the LC cell was controlled by the precision hot stage,so that the temperature rose gradually until the doped LC presented a clear state.This phase change process could be observed by the polarized optical microscope(POM).Since it was a reversible phase change,the reorientation process of LC molecules could be observed after cooling treatment.In order to obtain a more accurate clearing point temperature,it was necessary to use a precision hot stage to reduce the temperature of the LC cell at a speed of 0.1°C/min during the cooling process,and to observe as well as to record the clearing point temperature of doped LC.
The POM micrographs of LC state,liquid state and mixed state of LC materials with different doping concentrations are shown in Fig.2,in which P represents the polarizer,A represents the analyzer,and n represents the rubbing direction of the polyimide alignment layer.
The LC cell was heated until the LC orientation disappeared and became liquid state.As shown in Figs.2(a)–2(e),the LC materials with different doping concentrations were in liquid state.When the temperature dropped to a certain temperature,as shown in Figs.2(f)–2(j),the doped LC material would show a mixed state.When the temperature continued to decrease until it was below the clearing point,the material was in the LC state,as shown in Figs.2(k)–2(o).The temperatures recorded in Figs.2(f)–2(j)are the clearing point temperature of the doped LC material.
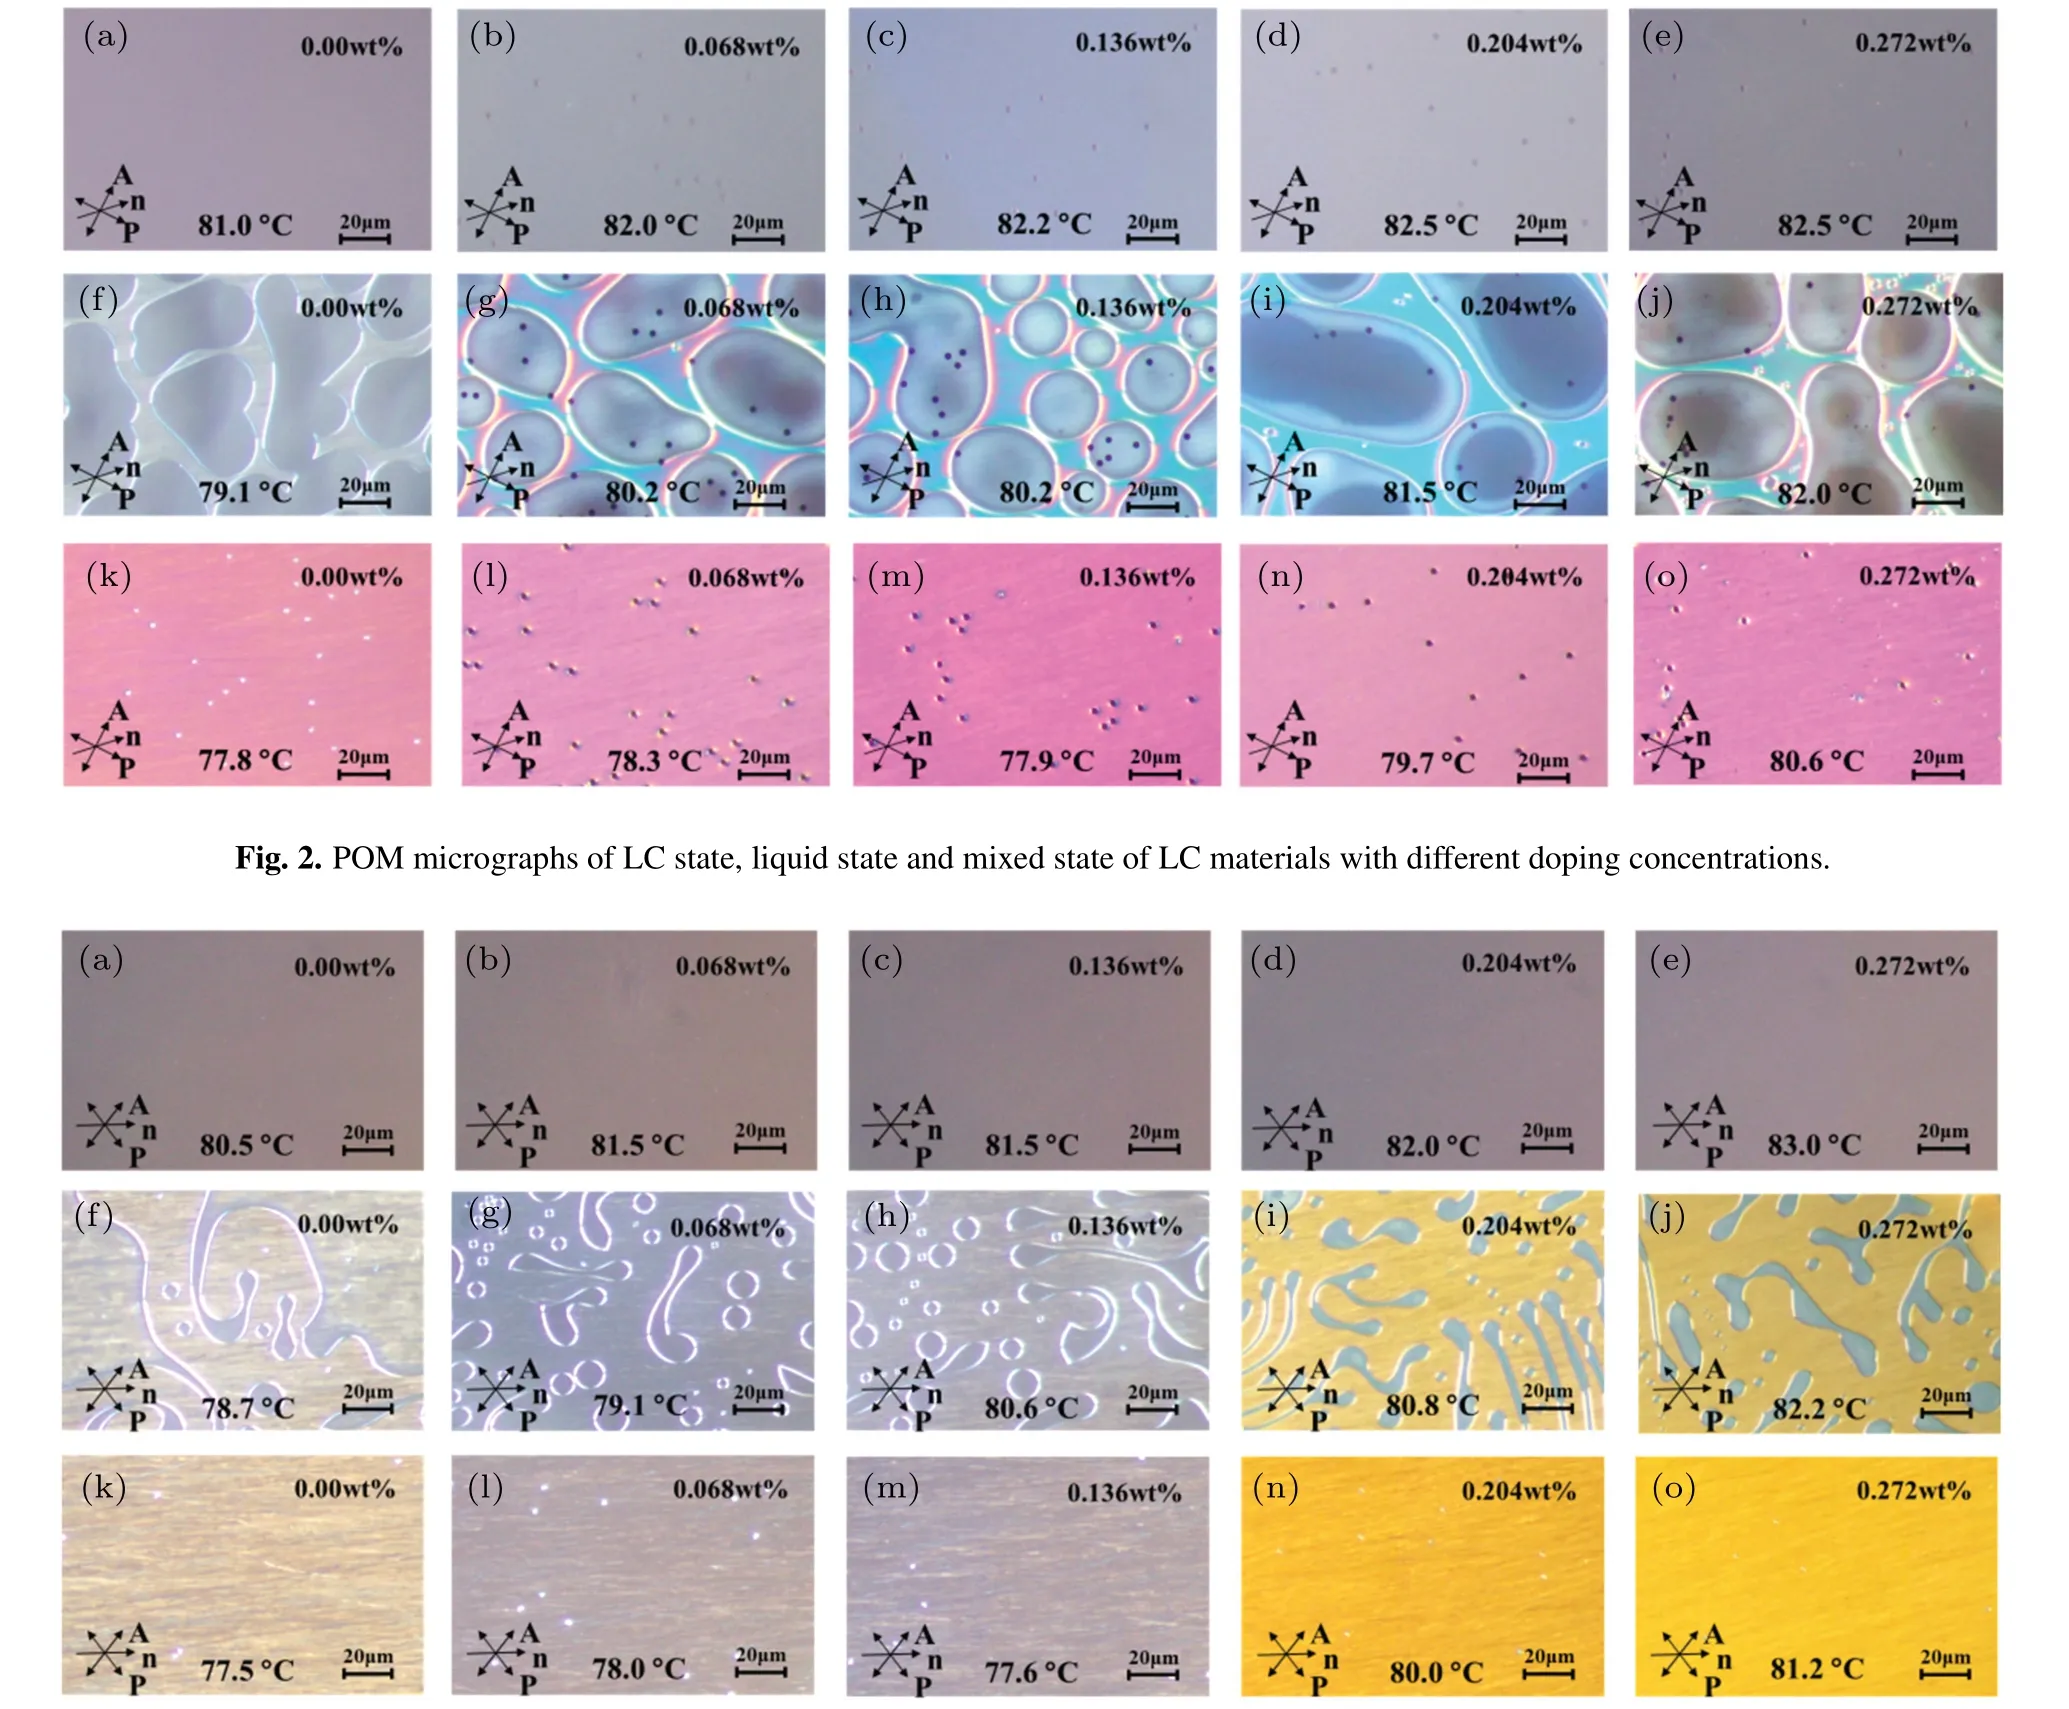
Fig.3.POM micrographs of LC state,liquid state and mixed state of the doped LC materials with different doping concentrations(5 months later).

Table 1.Clearing point temperature of the doped LC.
Five months later,the clearing point of the same batch of LC cells was measured under the same conditions,as shown in Fig.3.The image sequence in Fig.3 was the same as that in Fig.2.In order to distinguish them,the corresponding lowercase letters were used to label the various phases of the LC systems with different doping concentrations.
For the same batch of LC cells,the clearing point temperatures of the LC materials with different doping concentrations measured at different times are listed in Table 1.The data shows that theγ-Fe2O3nanoparticles doped in pure LC do not have great influence on the clearing point of the doped LC material,and after five months,the clearing point of the doped LC is basically unchanged(change rate is between 0.24%–1.37%),indicating that the doped LC system has good temperature stability.
3.2.Dielectric properties
Dielectric anisotropy is the most basic electrical parameter of LC materials and a key parameter to determine whether LC materials can be widely used in electro-optical display devices.[15]Therefore,the study on stability of doped LC systems must explore the changes of dielectric anisotropy at different times.
In the experiment,the dual-cell capacitance method[16–18]was used to obtain the dielectric constant of the doped LC materials.A precision LCR meter was used to measure the capacitance of the LC cell at different voltages,as shown Fig.4.Firstly,the LC cell was connected to the precision hot stage.The precision LCR meter was used to apply 0.1 V voltage to the LC cell,and the positive value of capacitance showed that the circuit was connected normally.Then,the circuit was disconnected,and the short circuit was opened and calibrated.Finally,the voltage applied on the LC cell was changed with the precision LCR meter to obtain the corresponding capacitance.As the capacitance of LC cell was greatly affected by temperature,the temperature of LC cell was controlled at 27°C during experimental measurement.

Fig.4.Capacitance measurement diagram of the LC cell.
The doped LC material was injected into a parallel aligned nematic(PAN)cell.The capacitance curve of the PAN cell versus applied voltage(i.e.,the C–U curve)was measured using the precision LCR meter.The LC layer capacitance was obtained by

where C is the capacitance of the PAN cell,CLCis the capacitance of LC layer,C1is the capacitance of the upper alignment layer,and C2is the capacitance of the lower alignment layer.
Then,capacitance of the vertical aligned nematic(VAN)cell needed to be measured,and capacitance of the LC layer in the VAN cell could be obtained according to Eq.(1).The relative parallel dielectric constantε‖and relative vertical dielectric constantε⊥of doped LC were obtained from the following equation using the LC layer capacitance of the VAN cell under a larger working voltage and the LC layer capacitance of the PAN cell under a voltage lower than the threshold voltage:

where s is the electrode area of LC cell,ε0is the vacuum dielectric constant,θPANandθVANare the pretilt angles of the PAN and VAN cells,respectively,and LLCis the thickness of the LC layer.
Two kinds of LC cells were used in this experiment.One was the PAN cell with the PI layer thickness of 38.98 nm,cell thickness of 3.80µm,and pretilt angle of 1°.The other was the VAN cell with the PI layer thickness of 120.40 nm,cell thickness of 3.80µm,and pretilt angle of 89°.
According to the above-mentioned LC cell parameters and the C–U curves measured by experiment,the dielectric constants of the doped LC were obtained from Eq.(2),then the dielectric anisotropies were also given,as listed in Table 2.

Table 2.Dielectric constant of the doped LC.
It can be seen from Table 2 that dopingγ-Fe2O3nanoparticles into pure LC can effectively improve the dielectric anisotropy,and the LC materials with different doping concentrations also show good stability.Five months later,the dielectric properties of the same batch of the doped LC systems was re-measured.The difference between the dielectric anisotropy of doped LC materials and the data 5 months ago is in the range of 0.035–0.2,showing that the doped LC system has good dielectric stability.
3.3.Electro-optical property
The electro-optical property is one of the standards to characterize the display performance of the LCD devices.Therefore,the electro-optical stability of the doped LC system was also investigated in this paper.

Fig.5.Optical path of testing the electro-optical property.
When testing the electro-optical property of the doped LC system,the optical path shown in Fig.5 was needed.The initial state of the instrument was first checked so that the light from the laser could be emitted to the receiver vertically.Adjusted the direction of the optical axis of the polarizer to be 45°with the orientation direction of the doped LC,and the polarizer was orthogonal to the analyzer,so that the light intensity detected by the receiver was zero without the LC cell.The LC cell was placed in the optical path,the voltage generated by the signal generator was amplified by a high-voltage amplifier and output to the LC cell.The transmission light signal was received by a photoelectric detector,and the data were read by the LC electro-optical effect experiment instrument.Thus,the electro-optical curve of the doped LC system was obtained.Under the same conditions and for different times,the electrooptical properties of the same batch of the doped LC system were measured twice.In experiment,the VAN cell were used and the time interval was five months.The results were shown in Fig.6.
As can be seen from Fig.6,the electro-optical properties of the doped LC system are basically consistent with those of 5 months ago,and both the threshold voltage and the maximum transmittance maintain a good stability.The stable electrooptical properties also explain the stability of the doped LC system from a macroscopic level.
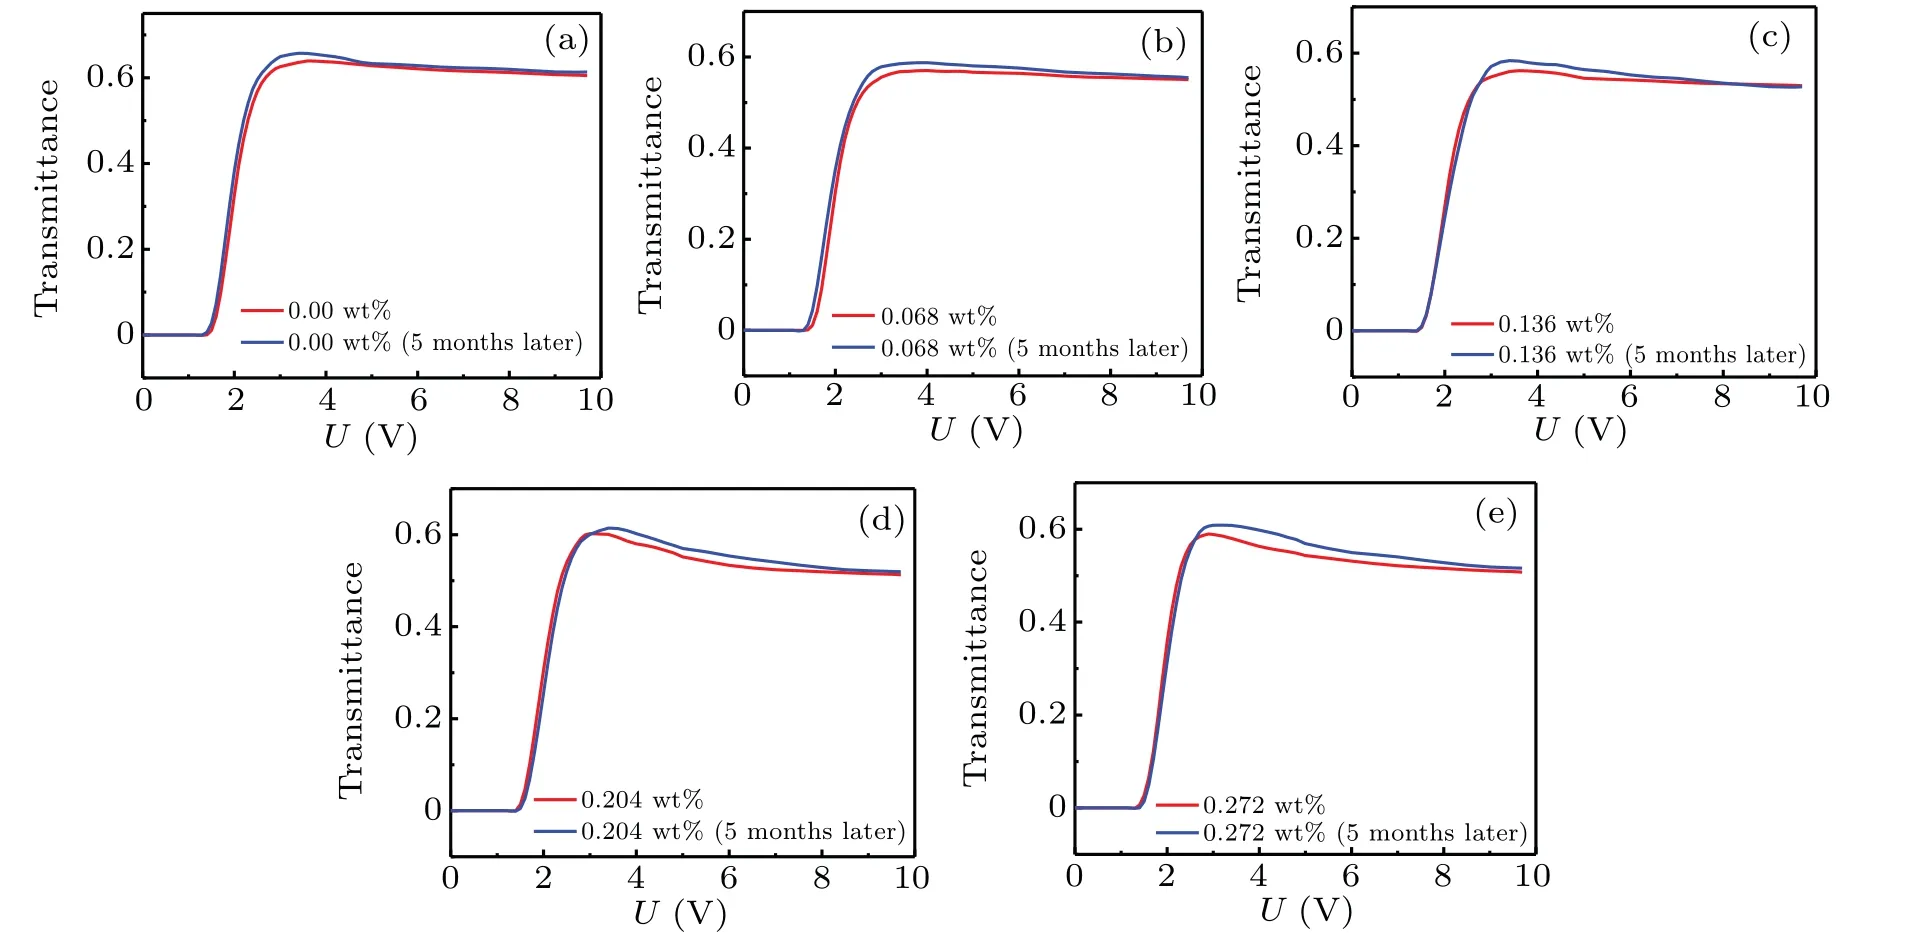
Fig.6.Comparison of transmittance versus voltage for theγ-Fe2O3-nanoparticle-doped LC system with different concentrations.(a)FFS1+0.00 wt%γ-Fe2O3 nanoparticles,(b)FFS1+0.068 wt%γ-Fe2O3 nanoparticles,(c)FFS1+0.136 wt%γ-Fe2O3 nanoparticles,(d)FFS1+0.204 wt%γ-Fe2O3 nanoparticles,(e)FFS1+0.272 wt%γ-Fe2O3 nanoparticles.
4.RDCV evaluation of the LC system doped withγ-Fe2O3 nanoparticles
Due to the existence of direct current bias(DCB)voltage during driving,the image sticking often occurs in LCD.[19]Under the action of DC voltage,the impurity ions in an LCD device gradually move along the direction of DC electric field,leading to the accumulation of a large number of ions at the positive and negative electrodes of LCD,thus forming the RDCV.However,the dopedγ-Fe2O3nanoparticles can adsorb impurity ions in the LC system,[20]thus reducing the RDCV value of LCD.If the doped LC system is unstable enough and produces clusters,the RDCV value will increase significantly.Therefore,we can further explore and evaluate the stability of the LC system by measuring the RDCV value of the doped LC system.
4.1.Evaluation methods and principles
The evaluation method proposed in Ref.[21]was used to investigate the RDCV values of the doped LC system at different times.Since the dielectric anisotropy of pure LC used in experiment was negative,we mainly measured the RDCV value of the VAN cell.
In the experiment,the capacitance values of the doped LC system under different voltages were firstly measured without DCB voltage,and the C–U curve of the VAN cell was obtained,as shown in Fig.7.It can be seen that the slopes of the C–U curve changing with the voltage are determined,and the voltage values corresponding to the maximum capacitance change rate can be obtained.

Fig.7.The C–U curve of the VAN cell filled inγ-Fe2O3-nanoparticledoped LC with different concentrations and the relationship between slope and voltage.
Next,the capacitance of the doped LC system with time was measured after applying DCB voltage.When the VAN cell was applied with both the AC voltage signal corresponding to the maximum slope of C–U curve and DCB voltage signal,the capacitance of the VAN cell would increase rapidly.After increasing to the peak value,the maximum capacitance Cmaxwas recorded and the voltage value Umaxcorresponding to the Cmaxcould be known from the C–U curve of the VAN cell without a DCB voltage.After the capacitance reached the peak value,it would gradually decrease over time until it reached a stable capacitance value Cmin.Similarly,the voltage value Umincorresponding to Cminwas obtained.
The capacitance changing with time was recorded and compared with the C–U curve measured without a DCB voltage.The voltage U corresponding to the capacitance value at each time after DCB voltage signal was applied could be obtained.The difference between Umaxand U was the RDCV of the doped LC system,and the difference between Umaxand Uminwas called the saturated RDCV(SRDCV).
4.2.Evaluation of RDCV in the VAN cell
The VAN cell filled in theγ-Fe2O3-nanoparticle-doped LC with 0.204 wt%concentration was selected as the RDCV evaluation object.First,the VAN cell was placed in a precision hot stage and kept at a constant temperature of 27°C.Then the precision LCR meter was calibrated.After the preparation was in place,the capacitance of the VAN cell applied with DCB could be measured.
It can be seen from Fig.7 that the voltage value corresponding to the maximum change rate of the C–U curve of the VAN cell is 2.1 V.Therefore,we set the AC voltage value in the LCR meter to 2.1 V,and then applied 0.6 V DCB voltage to the VAN cell.When the signal was applied,the capacitance values of the VAN cell were recorded in turn at different times.The change curve of RDCV versus time is shown in Fig.8.
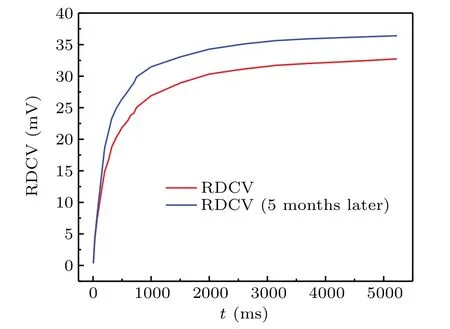
Fig.8.Variation of RDCV with time for the VAN cell after applying 0.6 V DCB voltage.
As can be seen from Fig.8,after five months,the RDCV of the doped LC system with concentration of 0.204 wt%increases slightly.The first measured SRDCV value is 32.72 mV,the second measured SRDCV value is 36.38 mV,so the SRDCV value increases by only 3.66 mV.The change rate of the SRDCV is about 11.2%,which indicates that the impurity ions in the doped LC system are in a relatively stable state,which also further proves the stability of the doped LC system.
5.Conclusion
In summary,the stability of a doped LC system has been explored by measuring the physical properties(clearing point,dielectric properties)and electro-optical properties of LC materials doped withγ-Fe2O3nanoparticles at different times.The results show that the clearing point of the doped LC material remains basically unchanged at the same concentration after 5 months.Compared with the data five months ago,the difference of dielectric anisotropy is in the range of 0.035–0.2,which is not a big difference.In the electro-optical property test,the threshold voltage and the transmittance under working voltage have not changed much.Finally,according to the RDCV of the doped LC system at different times,the stability of the impurity ions in the doped LC system was explored,and the system stability was evaluated.The results show that the RDCV of the doped LC system changes only 3.66 mV after 5 months.The stability of the doped LC system is due to the fact that the doping amount ofγ-Fe2O3nanoparticles is very small and there is no cluster phenomenon.The magnetizedγ-Fe2O3nanoparticles adsorb the impurity ions in the pure LC under the action of external voltage to improve the material properties of LC and weak the influence of impurity ions on the material properties of LC.Therefore,the LC system can still maintain good stability after dopingγ-Fe2O3nanoparticles,which provides experimental proof for the good application ofγ-Fe2O3nanoparticles in LCD devices.
猜你喜欢
延河·绿色文学(2022年4期)2022-05-10
延河(下半月)(2022年4期)2022-05-07
摄影与摄像(2020年10期)2020-09-10
Plasma Science and Technology(2020年4期)2020-05-06
课堂内外(小学版)(2019年12期)2020-01-01
课堂内外(小学版)(2019年10期)2019-12-30
课堂内外(小学版)(2019年9期)2019-12-30
作文评点报·低幼版(2018年25期)2018-09-27
中国卫生(2015年9期)2015-11-10
中学生数理化·七年级数学北师大版(2008年2期)2008-07-23
- Chinese Physics B的其它文章
- Multiple solutions and hysteresis in the flows driven by surface with antisymmetric velocity profile∗
- Magnetization relaxation of uniaxial anisotropic ferromagnetic particles with linear reaction dynamics driven by DC/AC magnetic field∗
- Influences of spin–orbit interaction on quantum speed limit and entanglement of spin qubits in coupled quantum dots
- Quantum multicast schemes of different quantum states via non-maximally entangled channels with multiparty involvement∗
- Magnetic and electronic properties of two-dimensional metal-organic frameworks TM3(C2NH)12*
- Preparation of a two-state mixture of ultracold fermionic atoms with balanced population subject to the unstable magnetic field∗