
Tunable characteristic of phase-locked quantum cascade laser arrays∗
2021-10-28 07:00ZengHuiGu顾增辉JinChuanZhang张锦川HuanWang王欢PengChangYang杨鹏昌NingZhuo卓宁ShenQiangZhai翟慎强JunQiLiu刘俊岐LiJunWang王利军ShuManLiu刘舒曼FengQiLiu刘峰奇andZhanGuoWang王占国
Chinese Physics B 2021年10期
Zeng-Hui Gu(顾增辉) Jin-Chuan Zhang(张锦川) Huan Wang(王欢) Peng-Chang Yang(杨鹏昌)Ning Zhuo(卓宁) Shen-Qiang Zhai(翟慎强) Jun-Qi Liu(刘俊岐) Li-Jun Wang(王利军)Shu-Man Liu(刘舒曼) Feng-Qi Liu(刘峰奇) and Zhan-Guo Wang(王占国)
1Key Laboratory of Semiconductor Materials Science,Institute of Semiconductors,Chinese Academy of Sciences,Beijing Key Laboratory of Low Dimensional Semiconductor Materials and Devices,Beijing 100083,China
2Center of Materials Science and Optoelectronics Engineering,University of Chinese Academy of Sciences,Beijing 100049,China
Keywords: multimode interference(MMI),phase-locked,quantum cascade laser(QCL),external cavity
1. Introduction
As the leading laser source emitting in a range between 3 µm–12 µm, quantum cascade lasers (QCLs)[1]have made great progress since it was first reported in 1994. Continuouswave (CW) output power of 5.1 W has been achieved from a single facet of a QCL emitting in the MWIR band.[2]And CW output power from a single facet in the LWIR has also been reached about 3 W.[3]But the demand for power goes beyond the current achievements,especially in the field of infrared optoelectronic countermeasures. Limited by the complexity and difficulty of energy band engineering of active region design, post-process production becomes a supplementary method for high-power realization. Recently outstanding achievements in on-chip cavity structure design mainly include high-power phase-coherent arrays using multi-mode interference (MMI) regions.[4,5]Compared with other phaselocking array designs,[6–8]the MMI laser array is easy to fabricate and efficient in thermal conduction since the array pitch can be almost arbitrarily increased to reduce the thermal load.There are currently two main methods of processing of MMI laser array, one of which is the dry etching technique.[5]Although this method is superior in obtaining accurate waveguide geometry, the growth of semi-insulating InP cladding in the subsequent process is usually problematical due to the poor interface state after dry etching. The other method is wet etching close to the active layers.[9]Two-step etching-regrowth technique has been used in device fabrication,which complicates the device process. In addition, all of the arrays from the previous researches have very limited wavelength tuning ranges (<3 cm−1).[5]In fact, a much wider tuning range is usually needed for more application scenarios,such as macromolecular gas detection.
In this paper,we carry out a series of experiments to address the above two key issues. An MMI design with a sufficient output channel distance is designed and used to simplify the fabrication process. Conventional photolithography and wet etching process, instead of the complicated two-step etching-regrowth technique or dry etching,are used in the array fabrication. The far-field pattern exhibits a modulated intensity distribution corresponding to the array ideal emitting pattern. This indicates that the modes in the arrays are phased locked. A Littrow external cavity structure is then used to tune the emitting wavelength of the QCL phase-locked arrays. A frequency tuning range of 61.2 cm−1is achieved for the QCL coherent array.
2. MMI QCL arrays design for 8µm
A suitable design of the MMI section is the key to the successful fabrication of the phased arrays. Based on the self-imaging theory of MMI,[10]the length of the multimode waveguide is determined by the position where the single mode is self-imaged at the two output channels. The optimal MMI length can be expressed as[4,11]

withWbeing the geometric width of MMI,ncorebeing the refractive index of the core and equaling 3.3,andncladbeing the refractive index of cladding material in the lateral direction.In the case of buried ridge waveguides,ncladis the refractive index of semi-insulating InP and equals 3.08. In our case of double ridge waveguides as demonstrated here,ncladis the refractive index of SiO2and equals 0.51.
Clearly, the width of the multimode waveguide plays an important role in finalizing the length of MMI.Only an appropriate width is suitable for a simple wet etching process. The sufficient etching depth will result in a relatively large amount of side etching, which sets the lower boundary of the width of MMI.A larger MMI width is ineffective in achieving phase matching between transverse modes,and also leads to a higher heat load. A schematic of multi-mode interference is shown in Fig.1(a). The multimode waveguide ridge width is 36µm after taking into account the edge undercut during wet etching.The ridge widths of all other sections are all 8µm. Substituting the value into the above formula, the initial value of the simulated MMI length can be determined. The MMI transmittance at two-aperture facet under different lengths is calculated using the finite difference time domain method,and the result is shown in Fig.1(c). The highest transmittance is obtained to be close to 99%for the MMI length of 248µm,following the design rule described in Ref.[12]. The optimal taper angleθof 55°is also obtained by the same method, and the result is shown in Fig.1(d).
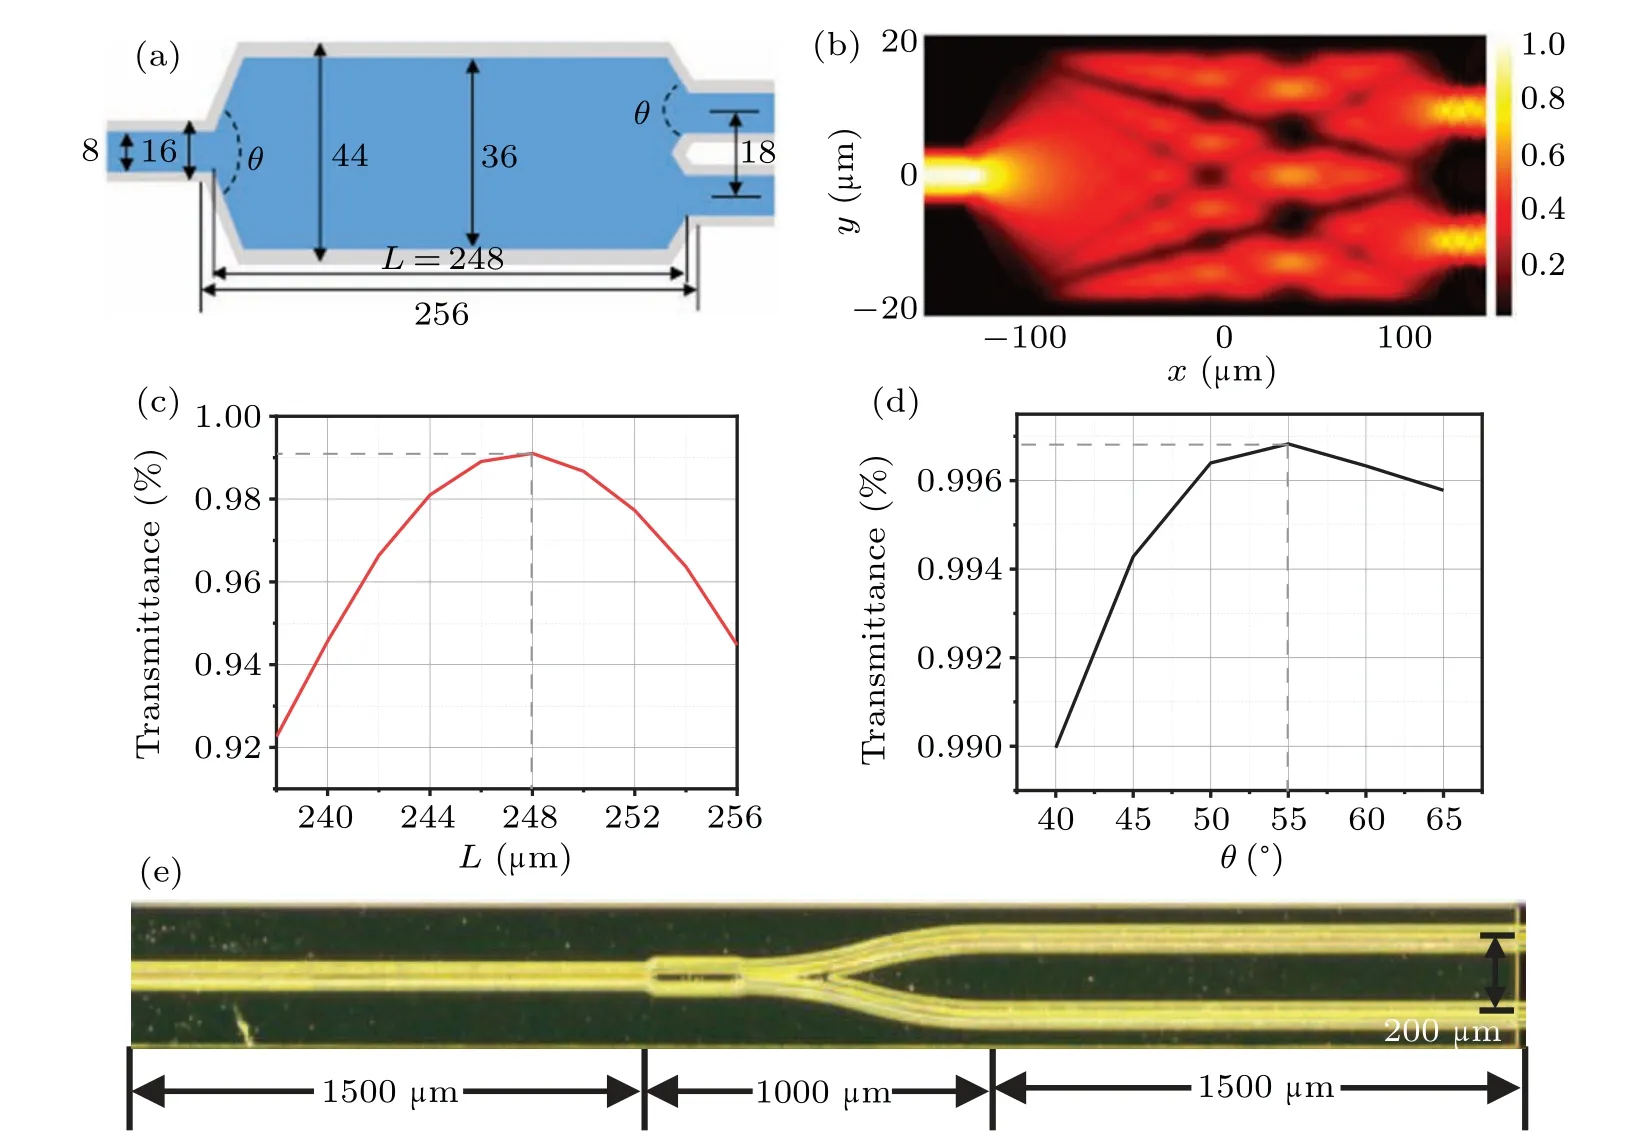
Fig.1.(a)Designed MMI size(blue area),and side undercut of 4µm(gray area)considered.(b)Modal field distribution within MMI section.Simulated transmission characteristics of MMI for fundament mode versus MMI length(c)and taper angle(d). (e)Optical microscope image of the phase-locked quantum cascade laser(QCL)arrays based on 1×2 MMI splitter.
A QCL structure based on single-phonon continuum depopulation is used in this study. The active structure is designed to be robust against layer-thickness fluctuation with high performance.[13]The lower and upper InP cladding layer thickness are both 3.5µm and was Si-doping concentration is 5×1016cm−3. GaInAs waveguide layer is 2×1016cm−3in Si-doping concentration and 0.3 µm in thickness. The heavily Si-doped (5×1018cm−3) InP plasma-confinement layer is 0.85-µm thick. The QCL structures are fabricated as arrays and Fabry–Perot(FP)ridge lasers by using conventional photolithography and wet etching process. After the completion of material growth, the wafer is etched by wet chemical etching to a depth of 7 µm, well beyond the active region to achieve good optical confinement. At this etching depth, the width of the ridge top of the input and output waveguide of the laser arrays are both about 6.5µm,the same as that of the ridge top of the FP laser. Then a 450-nm-thick SiO2acting as insulating layer is deposited with plasma-enhanced chemical vapor deposition (PECVD). Electrical contact is provided by a Ti/Au layer. To improve the heat dissipation, a 5-µm-thick gold layer is electroplated on the Ti/Au layer. After thinning the substrate down to 120 µm, a Ge/Au/Ni/Au metal contact layer is deposited on the backside of the sample. The cavity of the QCL array and FP ridge laser is cleaved to be 4 mm in length and both facets are uncoated.These laser is bonded episide down on copper heat sink. For this experiment,the length of the array section is 2.5 mm and the straight cavity section is 1.5 mm. Based on the beam propagation simulation results,the bending radius of the curved waveguide is 1000 µm. A 200-µm pitch spacing is selected for a better thermal dissipation as shown in Fig.1(e).
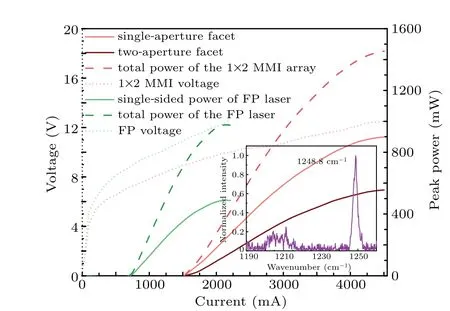
Fig.2. P–I–V curves of 1×2 MMI laser arrays and FP,with inset showing spectrum of the 1×2 MMI laser array near threshold.
Figure 2 shows theP–I–Vcharacteristics of the FP laser with 1×2 MMI laser array. All lasers, each with a pulse width of 2 µs and a repeat frequency of 5 kHz, are tested at room temperature. The output power values at both facets are directly measured by a calibrated thermopile detector(Coherent,EPM1000),whose collecting aperture is large enough for the array facet. The threshold current (current density) is 0.7 A (1.50 kA/cm2) for the FP and 1.52 A (1.86 kA/cm2)for the array. The increase in the threshold current density is attributed to the splitting loss of the MMI structure and the curved waveguide loss.The slope efficiency(maximum output power)is 0.65 W/A(0.98 W)for the FP laser,and is 0.48 W/A(1.45 W)for two-element laser array. The power scaling ratio(the area ratio)of two-element array to FP laser is 1.49(1.75).
The single-aperture output power is higher than the twoaperture power, which is not explicitly mentioned in the Refs.[4,5].Comparing with the previous results,this is mainly due to the different gain lengths and different losses at both sides of the MMI.The ratio of the length between the singleaperture side and the two-aperture side of the MMI is higher,which is consistent with the approach to increasing the length of the multi-aperture side to achieve greater power amplification in Refs. [4,5]. In addition, the two-aperture side of the MMI has a curved waveguide structure compared with the single-aperture side, which brings additional bending waveguide loss and coupling loss between the bent waveguide and the straight waveguide. The combined effect of these factors has brought in the uneven power distribution between the two sides.Based on this phenomenon,the catastrophic optical mirror damage of the single facet can be avoided by designing an appropriate structure on both sides of the MMI.
The far-field distribution pattern is an important reference for characterizing the output phase coherence. The laser array is mounted in the center of the rotation stage placed 60 cm away from the detector (a liquid nitrogen refrigerated mercury cadmium telluride detector,Judson J15D12 Series). The distribution of the array is relatively stable with the change of injection current. Figure 3 shows the far-field distribution measured atI=2 A with a pulse width of 2 µs and a repeat frequency of 20 kHz. Clearly, the far-field distribution has a Gaussian-shaped envelope with modulated peaks,which indicates that the modes from the two array branches are phase-locked. The N-aperture phase-locking distribution can be explained by the N-slit Fraunhofer diffraction theory. As shown in Fig. 3, an excellent match is achieved between the measurement result and simulation in which the microscope measurd ridge width of 10 µm and ridge spacing of 195 µm are used. Specifically, the maxima of side lobes occur when sin(θm−θc)=mλ/d,m=0,±1,±2,...,wheredis the pitch size,θmandθcare the angle of the maximum of side lobe and the center peak,respectively. The measured interference peak interval is 2.35°,which is close to the theoretical prediction of 2.36°by using sin−1(λ/d). This result shows that the beam emitted from the two-aperture facet has high-quality phase coherence. Besides,the beam intensity of central lobe with a full width of 2.35°is~7.33%of the entire beam intensity.
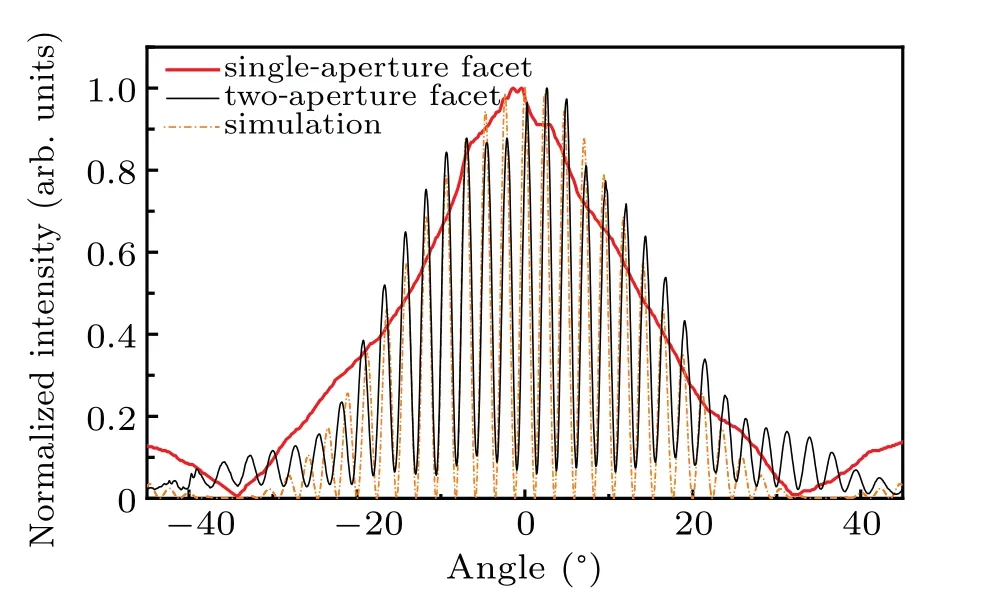
Fig. 3. Measured far-field distribution of laser array and simulated 2-slit Fraunhofer interference pattern(dashed line),with black solid curve and red solid curve showing far-field distribution of single-aperture facet and farfield distribution of two-aperture facet.
3. Frequency tunable phase-locked array based on external cavity
To achieve tunable single mode emission from the phaselocked laser array, an external cavity setup based on Littrow configuration is used as presented in Fig. 4(a). The phased laser array is collimated on the single-aperture facet side with an anti-reflectivity (AR) coated high-aperture collimation lens (CL) (LightPath 390037IR1, NA=0.86,f=1.87 mm). The collimated beam is diffracted on the grating with a grating angle of 41.6°and ablaze wavelength of 7.6µm(165 grooves/mm, diffraction efficiency~80%). In order to obtain the maximum grating diffraction efficiency, the grating grooves are oriented perpendicular to the laser polarization plane. The first-order diffracted beam is fed back to the sideelement side of the laser array for mode selection. The wavelength tuning is achieved by changing the placement angle of the grating. The two-aperture array side is used for characterizing the spectrum and power of the coherent arrays.
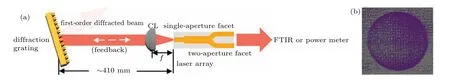
Fig.4. (a)Schematic diagram of Littrow-configuration,where phased laser array is collimated on single-aperture facet side with collimation lens(CL),collimated light is diffracted on grating,first-order diffracted light is fed back to laser array to form an external cavity system. The two-aperture facet side is used to measure spectrum and power. (b)Two-aperture-side two-dimensional(2D)far-field pattern of MMI laser array with external cavity.
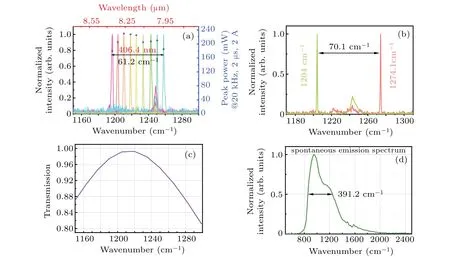
Fig. 5. (a) Tuning spectra of external cavity phased QCL array based on 1×2 MMI, where blue stars represent peak optical power after feedback corresponding to the spectral position. (b)Spectra of FP external cavity at boundaries. (c)Simulated transmission characteristics of MMI for fundament mode as a function of wavelength. (d)Spontaneous emission spectrum.
The spectral measurement is carried out by a Fouriertransform infrared (FTIR) spectrometer with a resolution of 0.25 cm−1(Thermo Fisher Scientific, Nicolet 8700). Figure 5(a)shows the external cavity QCL array working at 2 A with a pulse width of 2µs and a repeat frequency of 20 kHz.A relatively pure spectral line is observed in the entire tuning range. The wavelength tuning range is about 61.2 cm−1(from 1196.9 cm−1to 1258.1 cm−1). The peak optical power after feedback is recorded as also shown in Fig.5(a). The ratio of the highest power (at 1210.6 cm−1) and the lowest power(at 1196.1 cm−1),after the external feedback,to the total output power of the original array at 2 A are 83.8% and 65.6%,respectively.The difference in power ratio is due to the disparity in the combined effect of the external cavity configuration,the transmittance of MMI,and the intrinsic gain properties of the active structure. In addition,the QC lasers are expected to display an intrinsically very narrow linewidth as they lack the linewidth-enhancement factor common to conventional semiconductor lasers. Many measurements have indicated a frequency stability of below 1 MHz.[17]When the semiconductor cavity is extended by a passive free-space external cavity,the linewidth will be further reduced.[15]But this phenomenon cannot be directly measured by our FTIR spectrometer limited by the resolution(0.25 cm−1).Furthermore,based on the good intrinsic phase-locked character of MMI laser array,a clear interference pattern is always observed as shown in Fig. 4(b).This two-dimensional(2D)far-field distribution pattern of the two-aperture side is measured by an infrared-sensitive camera(Pyrocam IV,Spirion)behind a lens.
On the other hand, a frequency tuning range of 70 cm−1is observed for the FP laser based on the same setup,as shown in Fig. 5(b), which is 1.14 times that for the MMI array. We believe that the slightly narrower tuning range of the MMI laser arrays is mainly determined by the filtering characteristics of the multimode interference effect.Different wavelength experiences different transmission in MMI according to formula(1).Under the combined effect of the coupling efficiency of different wavelengths(see Fig.5(c))and gain characteristic of lasers(see Fig.5(d)),a relatively narrow frequency filtering effect is observed for the array. Nevertheless,the tuning range is usually sufficient for macromolecular gas sensing. Further suppressing the inherent longitudinal modes inside the laser cavity by depositing an anti-reflected(AR)coating on the single aperture facet to increase external feedback can then increase the frequency tuning range.[14–16]
4. Conclusions and perspectives
In this work,a QCL phase-locked array with MMI structure is designed and fabricated using traditional lithography and wet process through optimized MMI design. This fabrication method can also be applied to the preparation of laser arrays that can work with CW by regrowing semi-insulating InP blocking layer.The far-field characteristics are consistent with the calculations from the double-slit Fraunhofer diffraction theory,indicating that the modal phase of the arrays is locked.Littrow configuration of an external cavity structure is then used to realize the wavelength-tunable coherent arrays. The tuning range is greater than 60 cm−1. This work provides an approach to the realization of high power,wavelength-tunable QCL coherent arrays based on MMI structure. The tunability of this kind of array provides an insight into the filtering effect of the multimode interference structure in the active laser structure, which is also of guiding significance in the future design and fabrication of MMI laser arrays.
Acknowledgment
The authors would like to thank P.Liang,Y.Hu for their help in the data processing and Dr. Quan-Yong Lu for his valuable advice.
猜你喜欢
中老年保健(2021年2期)2021-08-22
美与时代·城市版(2019年10期)2019-12-05
文艺生活(艺术中国)(2019年1期)2019-11-07
贵州农机化(2018年2期)2018-08-28
琴童(2017年4期)2017-06-14
小说月刊(2016年1期)2015-12-29
中国音乐教育(2014年6期)2014-05-16
外科研究与新技术(2011年2期)2011-08-15
青年文摘·上半月(1984年8期)1984-11-01

- Chinese Physics B的其它文章
- Physical properties of relativistic electron beam during long-range propagation in space plasma environment∗
- High winding number of topological phase in non-unitary periodic quantum walk∗
- Widely tunable single-photon source with high spectral-purity from telecom wavelength to mid-infrared wavelength based on MgO:PPLN∗
- Control of firing activities in thermosensitive neuron by activating excitatory autapse∗
- Adaptive synchronization of chaotic systems with less measurement and actuation∗
- Dynamics analysis of a 5-dimensional hyperchaotic system with conservative flows under perturbation∗