
Characterization of size effect of natural convection in melting process of phase change material in square cavity∗
2021-10-28 07:12ShiHaoCao曹世豪andHuiWang王辉
Chinese Physics B 2021年10期
关键词:王辉
Shi-Hao Cao(曹世豪) and Hui Wang(王辉)
1College of Civil Engineering,Henan University of Technology,Zhengzhou 450001,China
2School of Civil Engineering and Architecture,Hainan University,Haikou 570228,China
Keywords: phase change material,natural convection,size effect,equivalent thermal conductivity
1. Introduction
Because of high latent heat capacity, phase change materials (PCMs) exhibit great advantages over traditional materials for thermal energy storage. For example, 1-kg solid paraffin with latent heat 210.5 kJ/kg can absorb 210.5-kJ thermal energy in the melting process and the melting temperature almost keeps constant. This preferable property makes PCMs considerably useful to store or release thermal energy in a wide range of applications such as buildings,solar power plants,electronic components,spacecrafts,etc.[1–4]
Over the past decades,many studies have been carried out to analyze the heat transfer characteristic of PCMs. For example,the enthalpy method was first developed by Eyreset al.for solving heat conduction in solids[5]and then it was extended to the heat conduction controlled phase change problems,which are also named Stefan problems.[6–8]Recently, Sultanaet al.compared several fixed grid techniques for solving the Stefan problem,thereby predicting moving solid–liquid interface in the phase change process.[9]However, the classic Stefan problem is not suitable for the analysis of melting process of PCM, because the shape of melting front and the total melting time of PCM are actually determined by the heat conductive and convective processes together.[10]Natural convection caused by temperature gradient or density variation in liquid phase significantly changes the thermofluid transport mode.To effectively predict the thermal and hydrodynamic process of a material experiencing phase change, the natural convection effect must be included.[11–14]For conveniently describing the whirlpool flow caused by natural convection, Boussinesq approximation,[15]and porous flow theory[13]are generally utilized to introduce the driving force into the momentum equation.
All those researches reported that the actual solid–liquid phase change process is extremely complex, because it involves with heat transfer, solid–liquid phase transition, liquid phase flow, solid phase motion, volume expansion, and moving solid–liquid interface.[16]Moreover, the melting process is strongly dependent on the geometry shape and size of PCM domain,[12,17,18]the heating direction,[19,20]the enhancing strategy,[21–27]and the constrained mode of the solid phase.[13,17]Although it has been demonstrated that the natural convection in the liquid phase plays a positive role in accelerating the melting process of PCM, the description of natural convection behavior in PCM melting process may encounter some obstacles: (i) the natural convection process is too complex to be captured accurately, (ii) the simulation of natural convection is time-consuming, (iii)the effect of natural convection is size-scale dependent,(iv)the effect of natural convection is related to the applied boundary conditions, and(v)the contribution of natural convection is difficult to quantitively assess. Therefore,comprehensively understanding the melting process and the role of natural convection presents a considerable challenge in applying PCMs to thermal energy storage. The study of influence of natural convection on melting behavior is still insufficient, and the physical principle in it is not specifically explained.
In the present study,we aim to extend the understanding of the performance of natural convection melting process of PCM to the cases of different scales and develop an equivalent thermal conductivity concept for including the contribution of natural convection and reducing the computational difficulty as well. To do so, the melting process of paraffin wax within a rectangular container is studied. The melting experiment of paraffin wax in the rectangular box is conducted to trace the moving of solid–liquid interface and validate the computational model. Then,the temperature field and velocity field in the melting process are simulated and the influences of natural convection on the liquid fraction in various time steps and the total melting time are discussed. Also, with this computational model, the size effects of natural convection are analyzed in different size cases and the critical value of domain size which corresponds to the case that the effect of natural convection can be ignored below this value is obtained.Simultaneously,the physical principle behind it is revealed. Finally,the effect of natural convection on the melting time of PCM is represented by the introduced equivalent thermal conductivity concept,and an empirical correlation of equivalent thermal conductivity is given for simplifying the complex calculation of natural convection in engineering applications.
The rest of this paper is organized as follows. In Section 2, the melting experiment of paraffin wax within a rectangular container is described. In Section 3, the basic governing equations to simulate the melting behavior of the PCM are presented. The numerical model and boundary conditions are explained in detail in Section 4. The simulation results and discussion are given in Section 5. Finally, the important findings are discussed in Section 6.
2. Melting experiment
To further investigate the thermal performance and the energy storage capability of the PCM, the paraffin melting experiment in a rectangular container is carried out,and the schematic diagram of the experiment is shown in Fig.1. The rectangular container with interior dimensions of 100 mm×100 mm×300 mm is made of six transparent perspex plates,each of which has a thickness of 10 mm and good thermal insulation performance,and allows visual observation of the melting inside the container. To further reduce heat loss in the melting process and provide nearly adiabatic environment, the rectangular container is covered with the cotton layer and the polyfoam layer as indicated in Fig.1.The insulation layer can be uncovered when we take photos by a digital camera to record the instantaneous locations of solid–liquid melting front during the melting experiment. The camera is positioned appropriately in front of the container. The cavity is filled with solid PCM paraffin wax(melting temperature 300 K) purchased from Shanghai Joule wax Company: such a wax is adopted because of its stability in melting and freezing cycles. The physical properties of paraffin wax are listed in Table 1. To measure the temperature change in the melting process of paraffin wax, five thermocouples are arranged at different locations (K1 ath=2 cm, K2 ath=4 cm, K3 ath=6 cm, K4 ath=8 cm, and K5 directly exposed to the environment). The temperature data are collected by a 24-channel temperature measurer(Anbai,AT4524),and stored in a computer. Besides,prior to the melting experiment,the rectangular container filled with paraffin should be exposed to the laboratory environment for at least 24 h to ensure a uniform initial temperature in the paraffin wax. The initial temperature of paraffin wax is(16±0.1)°C.

Fig.1. Schematic diagram of paraffin melting experiment. The numbers in the figure describe the fallowing units: 1-polyfoam,2-cotton,3-rectangular container, 4-paraffin, 5-hot plate, 6-thermocouples, 7-data acquisition unit,8-computer,9-camera.
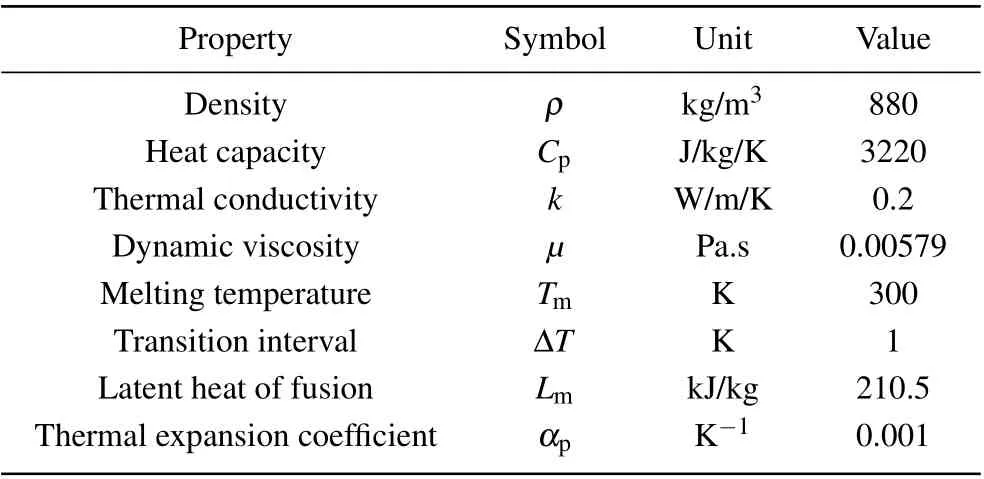
Table 1. Material properties of paraffin.

Fig.2. Evolution of experimental melting front in entire melting process(front view)at f =0(a),0.02(b),0.06(c),0.14(d),0.24(e),0.42(f),0.58(g),0.74(h),and 0.96(i).
During the test,the enclosed paraffin wax is heated from the left side by using an electric heating plate,which is made of highly conductive silicon paste. A digital temperature controller is used to control the heating temperature,which is set to be 70°C in the melting test. In order to ensure the accuracy of heating temperature, the sensitivity and reliability of digital temperature controller have been calibrated by Ktype thermocouples prior to the melting test. To achieve a uniform heating source, a 2-mm-thick copper plate is glued on the electric heater to contact the paraffin wax. In Fig. 2, the experimental results show the evolution of liquid fractionfin the entire melting process of paraffin. Typically,f=0 when the PCM is solid, andf=1 when the PCM is liquid. At the beginning of melting, the heat transfer is dominated by heat conduction due to the direct contact between the heating wall and the paraffin wax, and a very thin liquid layer is formed rapidly. In this region, because the layer thickness is small,the motion of molten PCM is extremely slight. As a result,the melting front of paraffin almost keeps parallel to the heating wall as shown in Fig. 2(b). Subsequently, the paraffin in the upper portion melts faster than in the lower part, so that the solid–liquid interface becomes inclined,which may be attributed to the accelerating effect of natural convection on the liquid paraffin. Moreover,as the melting process goes on,the effect of natural convection becomes more significant. This can be demonstrated by the more and more inclined melting interface.
3. Computational model
3.1. Mathematical formulations
Compared with the experimental results, the numerical results can provide detailed field variations inside the cavity.Here,in order to further investigate the heat transfer behaviors in the paraffin in the melting process at different size levels of the cavity, it is necessary to establish an appropriate computational model to describe the complex melting process of paraffin in the rectangular cavity which may involve with heat conduction, phase change, liquid-phase flow caused by natural convection,solid-phase motion,and moving of solid–liquid interface. In this work,a two-dimensional(2D)computational model along the square cross-section of the cavity is developed based on the symmetrical configuration of the experimental model and the applied boundary conditions, and its details can be found in Fig. 3. The following basic assumptions on the paraffin are made in the mathematical model: i)the fluid phase is incompressible, ii) the physical properties for each phase keep unchanged,iii)mushy zone exists during the melting of PCM,iv)the volume expansion in the melting process is ignored,and v)there is no heat generation inside the PCM.
Based on the above assumptions,the transient governing equations for the problem under consideration are written below.
Continuity equation
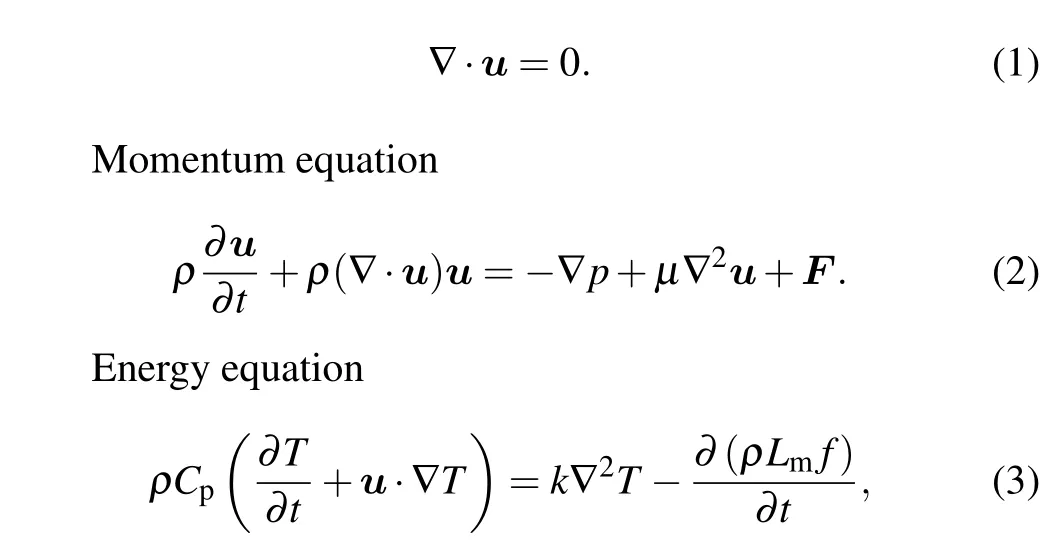
whereρis the density,∇is the Hamiltonian operator,uis the velocity vector,pis the pressure,µis the dynamic viscosity,Fis the volume force vector,Tis the absolute temperature,Cpis the specific heat capacity,kis the thermal conductivity,andLmis the latent heat of fusion.
In momentum equation(2), when the density fluctuation caused by temperature variations is small,we can assume that the flow of the liquid phase is driven by a buoyancy force,which can be given by the following Boussinesq approximation:

whereTrefis the reference temperature and can be taken as the melting temperatureTmfor the phase change problem.αis the thermal expansion coefficient,andgis the acceleration of gravity.
Besides,the solid phase can be regarded as a liquid with much higher viscosity than the liquid phase, so the dynamic viscosity in Eq.(2)practically is written in the form of

whereµs=108µlis the dynamic viscosity of solid phase andµlis the dynamic viscosity of liquid phase. Hereafter,the subscript“s”represents the solid phase,and the subscript“l”denotes the liquid phase.
In Eq.(3),the effective thermal conductivityk,the effective densityρ, and the specific heat capacityCpcan respectively be given respectively by
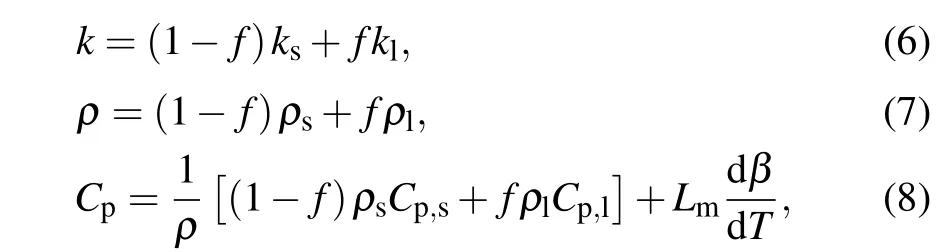
whereβis the mass fraction defined as
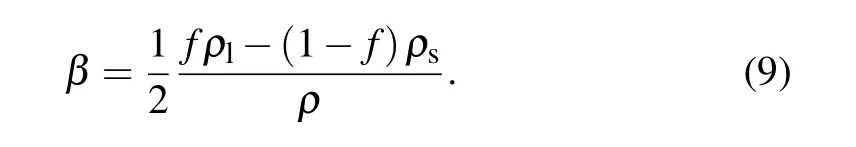
In practice, in order to ensure the solution stability , the phase change is assumed to occur in a small temperature range[Ts,Tl], whereTsandTlusually are set to beTm−∆T/2 andTm+∆T/2,respectively,and ∆T=Tl−Tsis a small temperature interval,[28]i.e., 1 K. For this case, the phase change interphase is modelled as a mushy zone in which the value of liquid fraction can be evaluated by the linear interpolation of temperature

3.2. Boundary and initial conditions
In order to solve the unsteady PCM melting problem,appropriate boundary conditions are applied to the boundary of cavity. Initially, the temperature of the whole PCM is set to be the room temperatureT0=16°C,the velocity filed in it is zero and the pressure is 1 atm(1 atm=1.01325×10⁵Pa). Additionally,the heating temperature is maintained at 70°C and the remaining boundaries are insulated. Besides,the pressure point constraint is applied to point B as shown in Fig.3. Such an operation is helpful in improving the convergence of phase change analysis when the natural convection is considered.
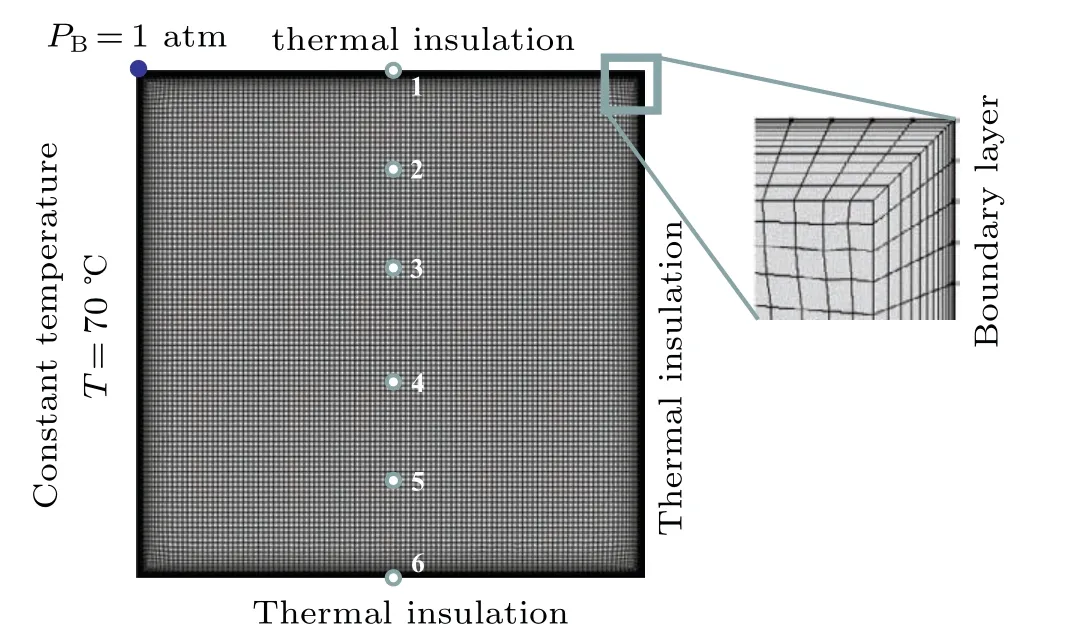
Fig.3. Finite element mesh for melting computation model of paraffin.
3.3. Meshing operation
In this study,the COMSOL Multiphysics 5.3a is utilized to simulate the melting process occurring in the paraffin enclosed in a rectangular cavity by considering the heat conduction in the solid phase,the heat convection in the liquid phase,and the motion of the solid phase. The unstructured quadrilateral mesh containing 90009 DOFs is used to model in the computational domain. In order to exactly describe the flow velocity nearby the boundary, a boundary layer mesh is created as shown in Fig.3. The number of boundary layers is 12,and the boundary layer stretching factor is 20%to smooth the transition in element size from the boundary layer mesh to the interior mesh. The setting of boundary layer properties can achieve a better mesh.
4. Results and discussion
In this section, a comparison between the experimental results and the numerical results is first presented for the purpose of validation. Then,a detailed parameter sensitivity analysis is discussed.
4.1. Validation
Figure 4 shows the simulated melting fronts in the paraffin PCM at different liquid fractions. The blue color and red color represent the solid and liquid phase, respectively, and the yellow arrow denotes the velocity direction. It is found from Fig.4 that the evolution of the melting front is basically consistent with the experimental results given in Fig. 2. One can see that from Fig.4 that the portion of the solid phase descends gradually as expected. Atf=0.02,the melting interface is nearly vertical due to the dominated conduction effect.Then, owing to the effect of natural convection, a clockwise whirlpool flow indicated by the yellow velocity arrow in the molten liquid region appears clearly and becomes significant in accelerating the melting of the solid phase near the upper part of the cavity. As a result,the melting front becomes more and more inclined as the melting process goes on. It can be concluded that the melting process is initially dominated by the heat conduction and then by the natural convection under one-dimensional(1D)heat transfer conditions.
To accurately describe the melting process, the liquid fraction of paraffin is calculated, and the fesults are shown in Fig. 5. It is found that the liquid fraction increases with time going by, but the melting rate slows down. This can be attributed to the fact that as the distance between the melting front and the heating wall increases with time going by, the heating effect of the hot wall becomes weak and the intensity of the whirlpool flow decreases. Moreover,such a variation of the liquid fraction approximately follows a power law.
To further investigate the time-dependent variation of temperature in the melting process, six monitoring points are selected as shown in Fig. 3. The temperature variation at each monitoring point is depicted in Fig. 6. From Fig. 6,it is observed that the temperatures at monitoring points increase monotonically before they are lower than the melting temperature of paraffin. Once the temperature exceeds 300 K,the temperature curves rise rapidly with time. After that, all the temperatures slightly decrease. Finally, each temperature curve gradually reaches the heating temperatureTw=70°C.

Fig.4. Evolution of numerical melting fronts in entire melting process at f =0(a),0.02(b),0.06(c),0.14(d),0.24(e),0.42(f),0.58(g),0.74(h),and 0.96(i).

Fig.5. Computed and fitted curves of variation of liquid fraction with time.
The temperature change at each point can be further explained by Fig. 7. It is found from Fig. 7(a) that there is a high temperature gradient near the heating wall and the melting front. Moreover, as the melting process goes on, it is observed from Fig.7(b)that thermally stable and unstable fluid regions exist together, and the separating line between them is close to the upper segment of the melting front. In the stable layer, the thermal energy is dominated by conduction.Whereas, in the unstable layer, the heat transfer is dominated by convection, and the hot fluid flow is basically wrapped up in the boundary layer of the melting front. As illustrated in Fig. 7(b), a triangular low temperature region is formed due to the effect of coupling between conduction and convection.Hence,the temperature at point B located in the triangular region is slightly lower than the values at points A and C that are located outside of the low temperature region. Such a temperature discrepancy can be used to explain why all the curves in Fig.6 show a slightly descent trend after the rapid rise in the melting process. Furthermore, owing to the presence of thermal boundary layer and velocity boundary layer which closely follows the melting front,the higher grid density is needed to accurately capture the positions of melting front.

Fig.6. Variations of temperature with melting time at six monitoring points in melting process.
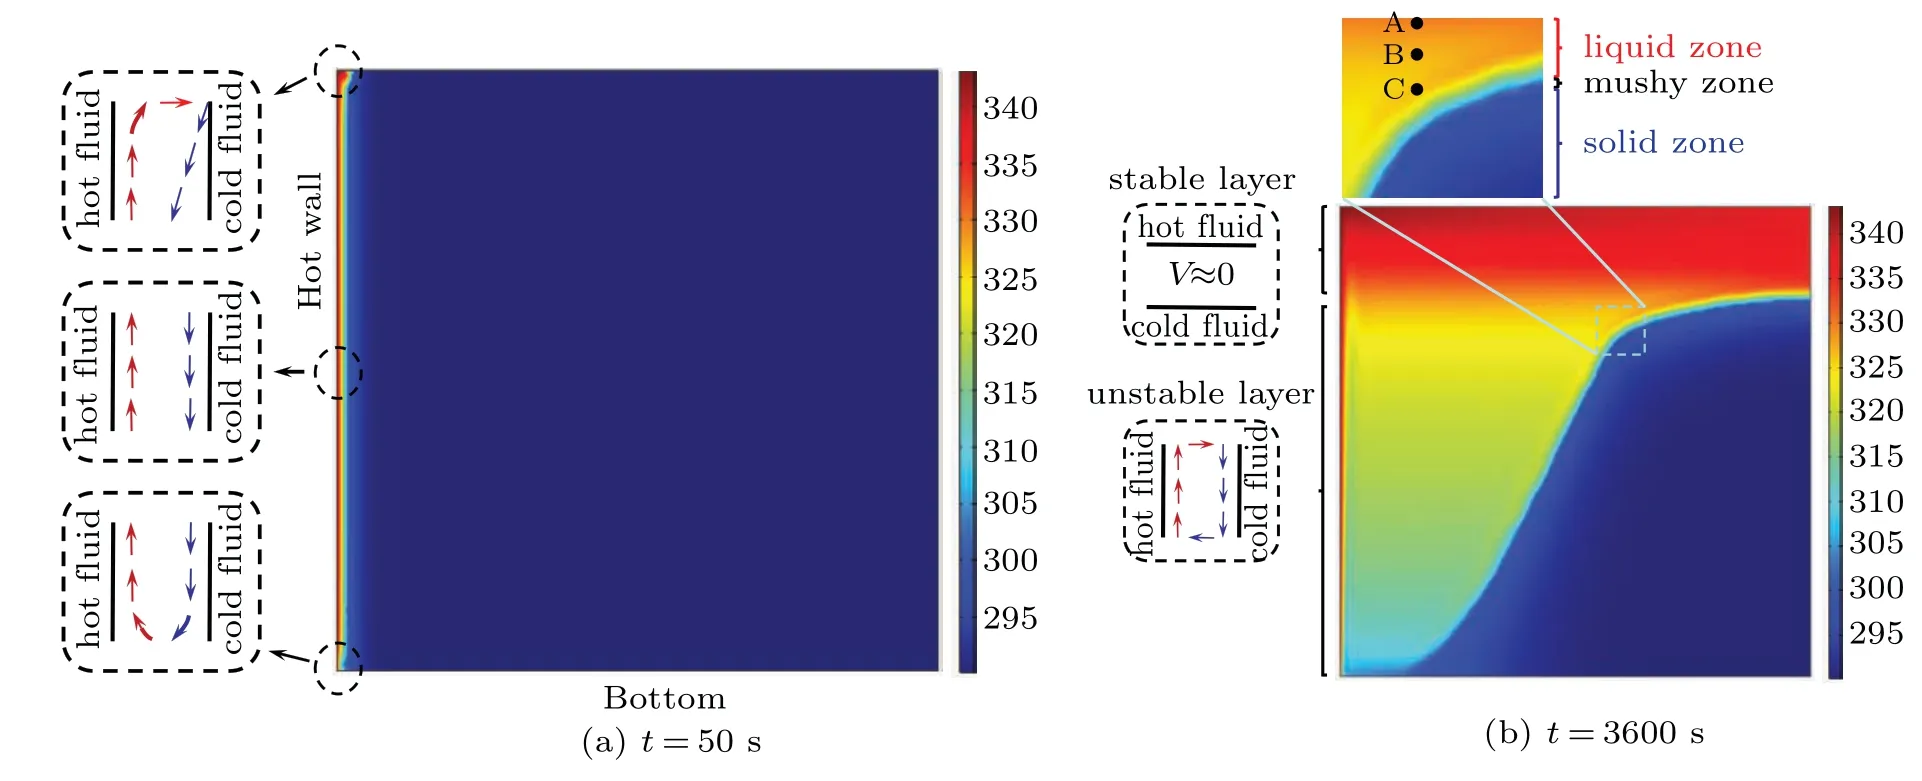
Fig.7. Temperature contours at different time moments.
4.2. Effect of natural convection
To further ascertain the features of the natural convection,the case without fluid flow is investigated for comparison.Figure 8 displays that the melting front of the paraffin gradually moves rightward and keeps almost vertical at each timemoment, when the heat transfer is controlled by the heat conduction. Hence, the temperature curves at the six monitoring points(see Fig.3)are completely identical as shown in Fig.9.It is found that the paraffin at each of these monitoring points begins to melt at aroundt=38300 s at which the temperature approximately reaches the melting temperature 300 K and the liquid fraction is 0.5. Subsequently, the temperature at each of these points continues to increase by the heat conduction in the liquid PCM. Untilt=133860 s, the cavity is fully filled with the liquid paraffin.
By comparing the melting times with and without considering the natural convection, it is found that the contribution of natural convection can make the melting front inclined and, more importantly, can reduce the total melting time by 92.36%. Thus,the natural convection in the liquid phase plays an important role in accelerating heat transfer in the melting process and should be considered. However, how to quantitatively assess its accelerating effect is still an open issue. In the next section, the dependence of natural convection on the cavity size is studied and its influence on the total melting time is analyzed numerically.

Fig.8. Snapshots of melting front at different time moments:t=3600 s(a),38300 s(b),133860 s(c)(fully melted).
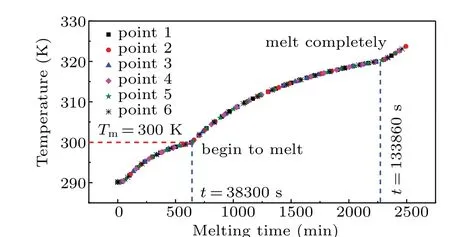
Fig.9. Variations of temperature with melting time at different monitoring points in melting process.
4.3. Size-dependent natural convection
To investigate the effect of the cavity size on the convection heat transfer, a comprehensive analysis is performed in this work, and the results are shown in Figs. 10 and 11,in which the computation stops and the total melting time is recorded when the melting of paraffin is finished. As can be seen from Fig.10(a)which corresponds to the case without the natural convection, the log–log curves of the liquid fractionversusmelting time are approximately straight lines for different cavity sizes, which means that the liquid fraction varying with time follows a power law. Comparatively, under the influence of natural convection,the log–log curves in Fig.10(b)shows different behaviors. These curves initially keep straight and then their slopes increase with time. This indicates that the heat transfer is initially dominated by heat conduction and then the natural convection becomes strong and accelerate the melting rate. However,the melting rate slows down when the liquid fraction is over 0.6. This can be attributed to the fact that the strength of whirlpool becomes weak as the distance between the heating wall and the melting front increases. This stage accounts for around 30%of the total melting time.
Figure 11 depicts the total melting time against the cavity size in the cases without and with the natural convection. It is clearly indicated that a smaller computational domain will melt faster than a larger one for the cases with and without natural convection and the relationship between the total melting time and the cavity side exhibits a power law, especially for the case with natural convection. Also,it is seen that the total melting time is significantly reduced when the natural convection present,and such an accelerating effect becomes stronger as the cavity size becomes bigger. Simultaneously, one observes in Fig.11 that the total melting time is almost identical for the two cases when the cavity size is very smaller.So it can be concluded that the effect of natural convection is closely related to the cavity size.

Fig.10. Variations of liquid fraction with melting time in the cases without(a)and with(b)natural convection.
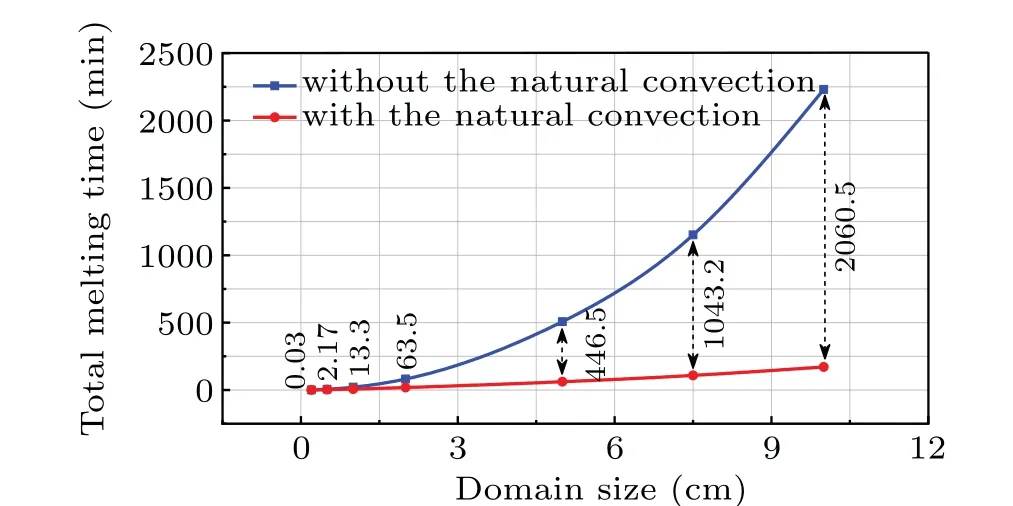
Fig.11. Curve of total melting times versus domain size for cases without and with natural convection.
To clearly demonstrate the size-dependence natural convection, the ratio between the total melting times for the two cases is defined as

wheretvandtddenote the total melting time corresponding to the cases with and without natural convection,respectively.
Figure 12 shows the variation of the total melting ratio with the cavity size. From Fig. 12, it is found that the effect of natural convection is significant. For example, when the cavity size is 50 mm, the total melting ratio is 0.1205. This means that the total melting time with natural convection decreases 87.95% in comparison with that without natural convection. Moreover, the total melting ratio becomes more and more small as the domain size increases. This indicates that the contribution of natural convection becomes more and more significant with the increase of domain size. Also, it is seen that when the cavity size is 2 mm, the total melting time ratio is very close to 1. This means that the accelerating effect of natural convection can be neglected when the cavity size is 2 mm. This can be further explained by the shaping of the melting front when the liquid fraction is 0.5 as indicated in Fig. 13, from which it is observed that the melting front becomes more inclined with the increase of domain size. Partially,as the domain size is 2 mm,the melting front is almost vertical.
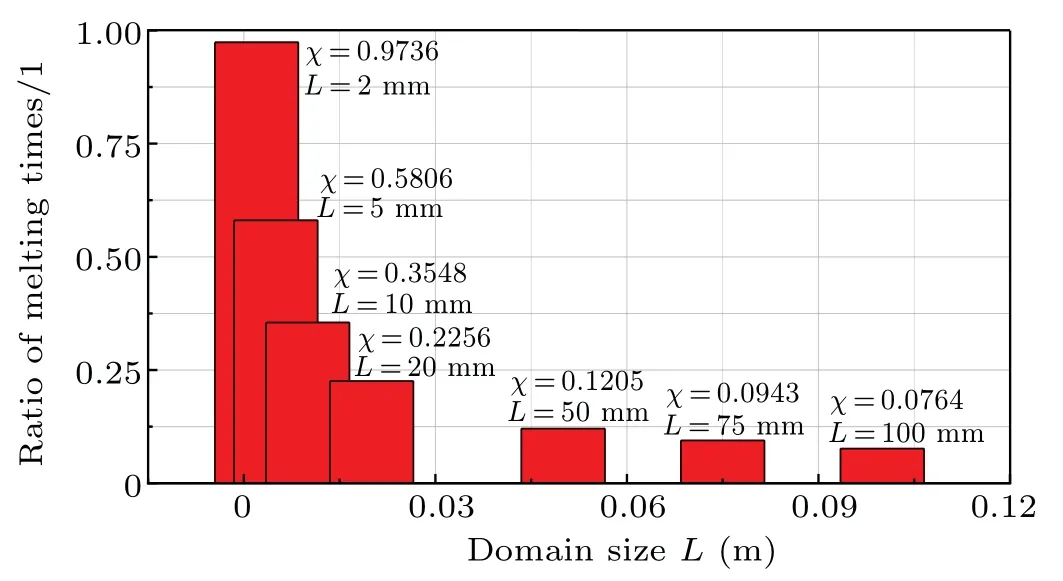
Fig. 12. Ratios of melting times versus domain size for different domain sizes.
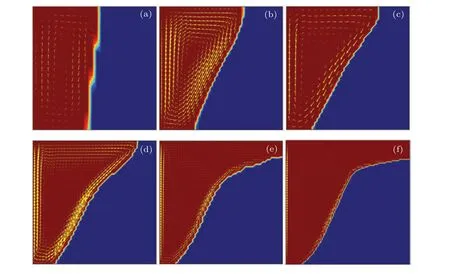
Fig.13. Melting fronts for different domain sizes: L=2 mm(a),5 mm(b),10 mm(c),20 mm(d),50 mm(e),and 100 mm(f).
5. Equivalent thermal conduction
The results above clearly show that the natural convection plays a positive role in accelerating the melting of paraffin and reducing the total melting time, which is directly related to the absorbing rate of latent energy in the melting process of PCM. However, we must point out that when the natural convection of liquid phase is involved, the melting process of PCM becomes very complex and a large number of iterations are needed at each time step. As a result, completing each simulating job may take about several days. For example,with the same mesh for discretizing the 100 mm×100 mm cavity, the CPU computing time is about 20 h by using the desktop with I7-8700 CPU and 16 G memories, although the full melting of paraffin can practically finish within 3 h. Such a time-consuming computation severely limits the quick analysis of PCM melting and hinders the engineering applications of PCM.
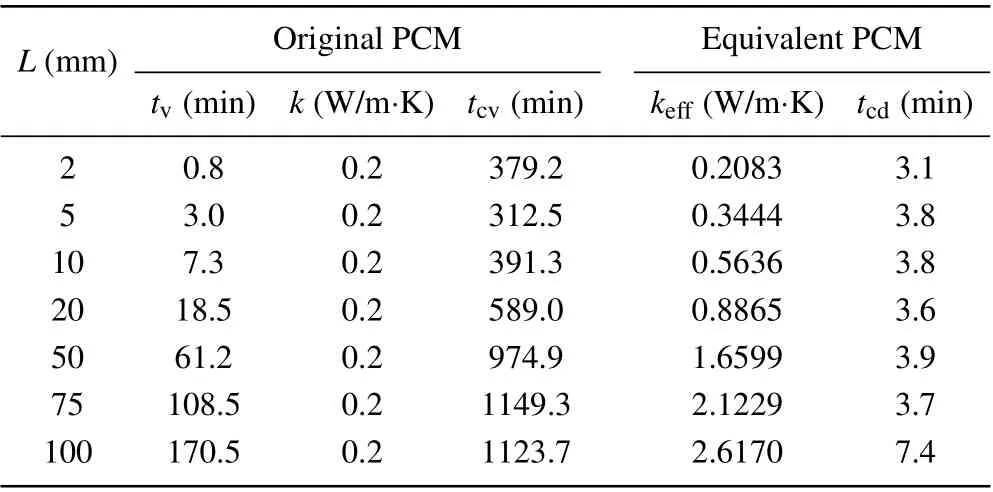
In order to simplify the calculation of PCM, the simplest treatment is to introduce an equivalent thermal conductivity concept which integrates the contribution of natural convection in the original PCM into the thermal conductivity of equivalent PCM and assumes that the heat conduction is a dominant energy transfer mode in the melting process of equivalent PCM. The other physical parameters of PCM like the density,heat capacity,melting temperature,and latent heat,keep unchanged. On the basis of the same total melting time,the equivalent heat conduction coefficientk∗effof the equivalent PCM can be determined by the intersection between the actual total melting time curve and the changing curve plotted by changing the thermal conductivity of the equivalent PCM in a large range as indicated in Fig.14 for the case ofL=100 mm.In Table 2, the values of desired equivalent thermal conductivity are listed for different domain sizes. In Table 2,tcvandtcddenote the CPU computing time for the original PCM and the equivalent PCM, respectively. Obviously, for the equivalent PCM,the computing time dramatically decreases.In other words,the computing efficiency greatly increases. For example,forL=100 mm,the computation for the equivalent PCM is 165.7 times faster than that for the original PCM.Moreover,the results in Table 2 indicate that the equivalent thermal conductivity of the equivalent PCM is related to the domain size.Using the data fitting technique, an empirical correlation of equivalent heat conduction coefficient is written as

Equation(11)is valid for the range of parameters used in simulation cases: 23.8 Fig.14. Variation of total melting time with heat conduction coefficient of equivalent PCM for L=100 mm. Table 2. Equivalent heat conduction coefficient. Fig.15.Comparison between results calculated by FEM and Eq.(11),showing(a)effect of domain size and(b)effect of temperature difference. To analyze the effect of natural convection on the heat transfer behavior and the energy storage capability in the paraffin and reveal the size-dependence of natural convection,the experimental and numerical investigations of the melting process in a rectangular cavity are carried out in this paper.The enthalpy-based numerical model is validated experimentally. The main conclusions are shown below. The heat conduction is dominant at the beginning of the melting process and the corresponding melting front keeps almost parallel to the heating wall. Then,as the melting region grows,the melting front gradually becomes inclined due to the appearance of clockwise whirlpool in the liquid phase caused by natural convection. However,the intensity of whirlpool becomes weak as the distance between the melting front and the heating wall increases. Compared with the case without natural convection,the natural convection can reduce the total melting time by 92.36% and increase the melting efficiency of paraffin forL=100 mm. The domain size plays a significant role in the convective heat transfer in the melting process, and the relation between total melting time and domain side exhibits a power law.When the domain size is less than 2 mm,the influence of natural convection can be ignored. In order to simplify the calculation,the equivalent thermal conductivity concept is proposed,and an empirical correlation of the equivalent thermal conductivity is obtained by data fitting. This simple solution can greatly reduce the computation time and ensure the absorbing rate of latent heat simultaneously. This solution provides an approximate method for the future analysis of complex engineering problems associated with phase change materials. In summary, the present study can enhance our understanding of the relation between the particle size and the latent energy storing function, and the proposed empirical correlation of equivalent heat conduction coefficient provides a great convenience for developing advanced cement-based composite incorporating PCM particles used for potential engineering applications in designing ecology-grain-storage structures.

6. Conclusions
猜你喜欢
辽河(2022年12期)2023-01-29
Chinese Physics B(2022年1期)2022-01-23
火花(2021年10期)2021-11-04
考试与评价·高二版(2021年4期)2021-09-10
中华养生保健(2021年18期)2021-02-13
东坡赤壁诗词(2020年3期)2020-07-04
Plasma Science and Technology(2020年5期)2020-06-14
艺苑(2018年6期)2018-03-04
校园英语·上旬(2017年11期)2017-10-25

- Chinese Physics B的其它文章
- Physical properties of relativistic electron beam during long-range propagation in space plasma environment∗
- High winding number of topological phase in non-unitary periodic quantum walk∗
- Widely tunable single-photon source with high spectral-purity from telecom wavelength to mid-infrared wavelength based on MgO:PPLN∗
- Control of firing activities in thermosensitive neuron by activating excitatory autapse∗
- Adaptive synchronization of chaotic systems with less measurement and actuation∗
- Dynamics analysis of a 5-dimensional hyperchaotic system with conservative flows under perturbation∗