
Large eddy simulation on the flow characteristics of an argon thermal plasma jet
2022-01-10 14:51XuZHOU周旭XianhuiCHEN陈仙辉TaohongYE叶桃红andMinmingZHU朱旻明
Plasma Science and Technology 2021年12期
关键词:桃红
Xu ZHOU (周旭), Xianhui CHEN (陈仙辉), Taohong YE (叶桃红)and Minming ZHU (朱旻明)
School of Engineering Science, University of Science and Technology of China, Hefei 230022, People’s Republic of China
Abstract Large eddy simulations based on the CFD software OpenFOAM have been used to study the effect of Reynolds number and turbulence intensity on the flow and mixing characteristics of an argon thermal plasma jet.Detailed analysis was carried out with respect to four aspects: the average flow field,the instantaneous flow field,turbulence statistical characteristics and the selfsimilarity.It was shown that for the argon thermal plasma jet with low Reynolds number,increasing the turbulence intensity will increase the turbulent transport mechanism in the mixing layer rather than in the jet axis,leading to the faster development of turbulence.The effect of the turbulent transport mechanism increases with increasing Reynolds number.However, the characteristics of flow and mixing are not affected by turbulence intensity for high Reynolds number situations.It was also found that the mean axial velocity and mean temperature in the axis of the turbulent thermal plasma jet satisfy the self-similarity aspects downstream.In addition, decay constant K is 1.25, which is much smaller than that (5.7–6.1) of the turbulent cold gas jet and has nothing to do with the Reynolds number or turbulence intensity in the jet inlet.
Keywords: thermal plasma jet, mixing layer characteristics, Reynolds number, turbulence intensity, large eddy simulation
1.Introduction
DC arc thermal plasmas show characteristics of high temperature, high enthalpy, and high chemical activity, and have been widely used in industry, such as metallurgy, chemicals,machine processing, material preparation, and so on [1, 2].The excellent characteristics of energy savings,environmental protection,and optional oxidation-inert-reduction atmosphere of arc thermal plasmas show great potential for high-temperature, rapid reaction processes in the chemical/material field, such as the pyrolysis of coal or methane to acetylene,plasma gas phase synthesis of new nano-carbon materials,and spheroidization of high temperature resistant materials[3, 4].Among them, plasma jets are the most common form[4–7].Over the past few decades, numerous studies on the characteristics of thermal plasma jets have been performed,in which turbulent thermal plasma jets account for a large proportion [8–12].However, the transition mechanism from laminar thermal plasma jets to turbulent thermal plasma jets is still unclear.
Compared with a laminar thermal plasma jet, the entrainment rate of ambient gas into a turbulent thermal plasma jet is significantly enhanced,which is more conducive to the mixing of thermal plasma and ambient gas[8, 13, 14].The comparison of laminar and turbulent argon thermal plasma jets into ambient air has been performed with the combined-diffusion-coefficient method[15–17].It was shown that the transport mechanisms of laminar and turbulent plasma jets are different [8].Experimental results [12] have been reported regarding the characteristics of a turbulent argon plasma jet issuing into the ambient air.The distributions of velocity,temperature and species concentration in the turbulent argon plasma jet were measured.The data indicate that mixing to the molecular level is incomplete over a substantial portion of the flow field.At the same time, it was found that the entrainment rate of ambient air is affected by the turbulent kinetic energy profile at the jet inlet by their simulation results[9].Numerical studies performed by Cheng[8]and Pan[18]showed that a laminar thermal plasma jet can transform into a turbulent thermal plasma jet, when the turbulence disturbance is applied in the laminar plasma jet inlet.However, how the turbulence develops and affects the characteristics of flow and mixing of the thermal plasma jet is still lacking and deserves further research.
At present,the standardε−kturbulence model has been used for most numerical studies on turbulent thermal plasma flow[8–11].However,it cannot be valid in a region with low Reynolds number.The standardε−kturbulence model is a simplification of complex practical problems, while not universal and precise.In fact, different methods have been attempted to model turbulence.Ye[19]extended the standardk−εturbulence model to a three-equation model by taking into account the temperature and density fluctuations in the plasma.The two-fluid turbulence model, which has similarities to two-phase flow models, was presented to predict the flow properties of a turbulent argon plasma jet issuing ambient argon at 1 atm by Huang [20].Although this model can predict unmixing phenomena, more equations need to be solved and there are some uncertainties regarding two-fluid turbulence model coefficients.
Large eddy simulation [21–26] can overcome the technical limitations of experiment and the inaccuracy in RANS(Reynolds-averaged Navier–Stokes), and has become a popular tool for studying the flow of thermal plasma.Numerical studies with Smagorinsky turbulence model [27] by Marchand[21]showed that the high arc fluctuation frequency and low voltage amplitude fluctuation resulted in a less dispersed spray jet performed.Three-dimensional large eddy simulation approach was conducted to show the unsteady behaviors of plasma as well as the wave-like interfaces [23, 24].
At present, the large eddy simulation of thermal plasma flow primarily studies the unsteady characteristics of largescale structures in the flow field,but there is a lack of further research on the characteristics of the mixing layer and the statistical characteristics of turbulence.In addition, because the temperature and physical properties of the thermal plasma jet change sharply along the jet axis,the self-similarity law for a circular jet may not be fully applicable to the thermal plasma jet.So far, there is no analytical expression for the decay law of velocity and temperature along the axis of the thermal plasma jet.In this work, a large eddy simulation module solving a thermal plasma jet was developed under the framework of OpenFOAM [28].A three-dimensional largeeddy simulation method was used to study the effect of Reynolds number and turbulence intensity in the jet inlet on the characteristics of flow and mixing of an argon thermal plasma jet, and the development process of turbulence.This paper is organized as follows.In section 2,the details of large eddy simulation method, including the governing equations,numerical method, and boundary conditions are addressed.The accuracy of the numerical method is validated via comparison with experimental data [29].The average flow field,instantaneous flow field, turbulence statistical characteristics,and self-similarity of the argon thermal plasma jet are analyzed in detail in section 3.The main conclusions are summarized in section 4.

Table 1.Parameters of the large eddy simulation.
2.Numerical methods and physical models
2.1.Physical model
In this work, the effects of Reynolds number and turbulence intensity in the jet inlet on the characteristics of flow and mixing of the argon thermal plasma jet are studied with large eddy simulation method.Detailed parameters of the large eddy simulation are shown in table 1.The Reynolds number in the thermal plasma jet inlet is expressed as

where,Ujis the maximum axial velocity in the jet inlet,D=8 mm is the diameter of the jet inlet,vjis the kinematic viscosity at maximum temperatureTj=13000 K.The Reynolds numbers in the jet inlet are 1148 and 1722, and the corresponding maximum axial velocities in the jet inlet are 800 m s−1and 1200 m s−1,respectively.For the convenience of description, the short name is used.For example, the case Jet-1148-2 represents an argon thermal plasma jet with a Reynolds number of 1148 and a turbulence intensity of 2%.
2.2.Governing equations
The following assumptions are made: (i) the plasma is in the local thermodynamic equilibrium and local chemical equilibrium state;(ii)the plasma is assumed to be optically thin,so the radiative heat loss is modeled as a temperature-dependent source term; and (iii) the buoyancy effects are negligible because of their smallness.Since the composition of the thermal plasma jet is the same as that of the ambient gas, the species conservation equation is not considered.Based on the foregoing assumptions, the filtered large eddy simulation compressible governing equations are

where, superscript ‘∼’ represents Favre-filtered operation,and ‘−’ represents spatially-filtered operation for large eddy simulation.are spatial coordinate component, filtered density, velocity, pressure,temperature and radiative heat loss, respectively.The filtered viscous stressis defined based on the eddy viscosity hypothesis as

In the equations (3) and (4), the sub-grid scale terms are closed by the Smagorinsky model [27].The sub-grid stress termin equation (3) reads

where the sub-grid viscosity is solved byin whichCsis the constant and takes the value of 0.094.is the filter width andkSGSis the sub-grid kinetic energy.
The sub-grid scale termis closed by the eddy-dif-fusivity model, which reads

where,is the turbulent diffusivity modelled asAccording to the simulation results of Chang[30], the turbulent Prandtl number is set asPrt=0.7.
2.3.Numerical methods
The CFD software OpenFOAM [28] is used to solve the above governing equations with the finite volume method.The solver is rhoPimpleFoam in which the Navier–Stokes and energy equations have been implanted.In this work, the energy conservation equation is modified to the form of temperature and the radiative heat loss is considered.In addition,the physical parameters in figure 1 are applied in the solver rhoPimpleFoam.The specific implementation methods are as follows: before the numerical simulation, the physical parameters and radiative heat loss item of argon thermal plasma are stored as an one-dimensional data tableφ T( )with an interval of temperature of 100 K; during the numerical simulation, the one-dimensional data tableφ T( ) is inquired according to the local temperature; finally, the physical parameters and radiative heat loss item are obtained by the method of linear interpolation to perform the next iteration or next time step.
The PIMPLE algorithm, a combination of SIMPLE(semi-implicit method for pressure linked equations)[31]and PISO(pressure implicit with split operator)[32]algorithm,is employed.According to [22–25], if the convection terms are discreted by the first-order upwind scheme, its inherently large numerical viscosity will make the calculation converge,but it will also cause the spatial gradient of the variable to unphysically flatten.On the other hand, the second-order central difference scheme can obtain a large spatial gradient of the variable.However, central difference scheme will produce large numerical instability, which can easily cause calculation divergence.Therefore,the second-order van-Leer-TVD (total variation diminishing) scheme is employed to discrete the convection term.Compared with the central difference scheme, a limiter is added to improve the numerical stability in the van-Leer-TVD scheme.It was shown that the numerical results used first-order Euler method for time integration may include accumulated errors by Shigeta [24].In order to improve the accuracy of numerical results, the second-order implicit Crank–Nicolson scheme is adopted.In addition, the time step is of the order 10−7sto makeCFLnumber less than 0.5.Time-averaging is performed over two hundred and forty flow through times (240L Uj/ ) when a statistical convergence is achieved after eighty flow through times(80L Uj/ )in our simulations,whereLis the axial length of computational domain andUjis the maximum axial velocity in the jet inlet.
Figure 2 is a schematic of the grid used in the large eddy simulation.The radial length of the computational domain is 7.5D,and the axial length is 50D.The computational domain is discretized into 400×90×96 hexahedral cells used in the axial, radial and circumferential directions, respectively.Meanwhile,mesh refinement is implemented near the jet inlet and the mixing layer,and the minimum mesh size is 0.13 mm.Under the parameters in table 1, the turbulence scale in the high-temperature plasma region is estimated to be a few millimeters, which is larger than the grid scale and can be solved directly by the grid [22].While the low-temperature flow region can be approximated by the sub-grid model,since the turbulence scale is about a few tens of microns.

Figure 1.Density, kinematic viscosity and thermal diffusion coefficient related to the argon thermal plasma temperature.

Figure 2.Schematic of the grid near the jet inlet.

Figure 3.Comparison of inflow distributions of mean temperature with experimental data [29] along a radial distribution 1 mm downstream from the torch.

Figure 4.Comparison of radial temperature profiles with experimental data [29] at different axial positions.
In this study, the mean axial velocity and temperature profile in the jet inlet are prescribed by equations(9)and(10),respectively.The artificial perturbations of different sizes are added in the mean axial velocity profile in the jet inlet to achieve the turbulent inlet velocity boundary conditions of different turbulence intensities.The total pressure boundary conditions are applied in the outlet.The open boundary conditions are employed in the side face to allow fluid to enter and exit freely, in which the temperature∞Tand the pressure∞Pare 300 K and 1 atm, respectively.Isothermal noslip wall boundary conditions are applied for the other faces.
2.4.Numerical validation
The present numerical method is validated by the experimental data [29] of the mean temperature field of the argon thermal plasma jet into the cold argon,which was also used to validated the accuracy of the LAVA program[11].The inner radius(Rin)of the torch exit or the jet inlet radius is 6.35 mm.The maximum axial velocityU0and maximum temperatureT0in the jet inlet are 135.8 m s−1and 12227 K,respectively.The temperature and pressure of the ambient cold argon are 300 K and 1 atm, respectively.The extent of the computational domain is 0.05 m in the radial direction and 0.2 m in the axial direction.269×86×96 hexahedral cells used in the axial,radial and circumferential directions are employed in the computation with mesh refinement near the jet inlet and mixing layer.
The inflow distributions of mean axial velocity and mean temperature in plasma torch are difficult to be measured experimentally, and are generally obtained by fitting the experimental data in the downstream of the plasma torch.The following distribution of mean temperature in the jet inlet is satisfied in the following equation [8–11]

where,Tw=700 K is the temperature of the inner wall of the plasma torch;nis the fitting parameter.The comparison between different values of fitting parameter in equation (8)with the experiments [29] along a radial distribution 1 mm downstream from the torch is shown in figure 3.The results show that equation (8) cannot describe the temperature distribution in the jet inlet in this work.By fitting experiments 1 mm downstream of the plasma torch,the mean temperature distribution in the jet inlet is obtained

Approximately, the mean axial velocity distribution in the jet inlet is satisfied

In addition, the value of turbulence intensity in the jet inlet is 2%.
Figures 4 and 5 show the comparisons of the mean temperature between experiments [29] and the current predicted results.The radial temperature profiles obtained by the simulation are slightly lower than the experimental results.The axial temperature profiles obtained by the simulation are in good agreement with those from experiment.Therefore,the numerical method in this paper can accurately solve the thermal plasma jet problem.This guarantees the accuracy of the following numerical study on the physical mechanism of flow and mixing process of an argon thermal plasma into the ambient cold argon.

Figure 5.Comparison of axial temperature profiles with experimental data [29].
3.Results and discussion
Large eddy simulations were carried out for different cases in table 1, and the effects of Reynolds number and turbulence intensity in the jet inlet on the mean flow field, large-scale structures and mixing layer characteristics of the thermal plasma jet were studied.
3.1.The mean flow field and mean temperature field
Figures 6 and 7 compare the mean axial velocity and mean temperature field of argon thermal plasma jets under different Reynolds numbers and turbulence intensities,respectively.As seen in figures 6 and 7,the results show that the length of the high-temperature region (the region where the mean temperature exceeds 5000 K) always decreases, and the gradient of the mean axial velocity and mean temperature increase significantly when the Reynolds number changes from 1148 to 1722, and the turbulence intensity changes from 2% to 10%,which is consistent with the phenomenon observed in the simulation [8].For cases with a Reynolds number of 1148,the change of turbulence intensity in the jet inlet has almost no effect on the distributions of the mean axial velocity and mean temperature in the upstream of the jet (z/D<20); but in the downstream of the jet, an increase in turbulence intensity leads to sharp dissipation of mean axial velocity and mean temperature.The reason for this phenomenon will be explained in the following section 3.3.When the Reynolds number was 1722, the length of the high-temperature region was short, and the axial gradient of the mean axial velocity and mean temperature were large,which is consistent with the characteristics of a turbulent plasma jet.Moreover,the change of turbulence intensity in the jet inlet has no effect on the flow characteristics.

Figure 6.Computed spatial distributions of the mean axial velocity for different cases.(a)Jet-1148-2,(b)Jet-1148-10,(c)Jet-1722-2,(d)Jet-1722-10.

Figure 7.Computed spatial distributions of the mean temperature for different cases.(a)Jet-1148-2,(b)Jet-1148-10,(c)Jet-1722-2,(d)Jet-1722-10.

Figure 8.Iso-surfaces of vortical structures for different cases(colored with local Reynolds number),the cases from top to bottom are Jet-1148-2, Jet-1148-10, Jet-1722-2, and Jet-1722-10.
3.2.Instantaneous flow field
TheQ-criterion and vorticity are used to characterize the effect of Reynolds number and turbulence intensity in the jet inlet on the structures of instantaneous flow field.TheQ-criterion [33], which deals with the second invariant of velocity gradient tensor, is used to extract the vortical structures from the simulation data.Here,Qis given as:

Iso-surfaces ofQ=5.0 ×10⁵of the instantaneous flow field are shown in figure 8, and it is colored with the local Reynolds number.The local Reynolds number is expressed aswhereUandvare the local mean axial velocity and kinematic viscosity, respectively.The circumferential vorticity of the argon thermal plasma jet is shown in figure 9.For case Jet-1148-2, rolling and breaking of the vortex were not found, and the local Reynolds number was basically unchanged.For other cases, the local Reynolds number continues to increase with the development of the jet,and the development of the entire mixing layer is divided into three regions, namely the laminar region, transition region and turbulent region.The local Reynolds number is small, and molecular diffusion and velocity shear are the main features in the laminar region.The laminar region of the case Jet-1148-10 is longer than that of cases Jet-1722-2 and Jet-1722-10.As the mixing layer develops downstream,the Kelvin–Helmholtz instability causes the vortex to roll up.The momentum exchange between the fluids on both sides of the mixing layer is dominated by the Kelvin–Helmholtz vortex.The turbulent transport mechanism of case Jet-1148-10 is slower than those of the high Reynolds number cases.After entering the fully turbulent region,vortical merging and pairing occurs,and the large-scale structure is clearer in the whole process.
3.3.Turbulence statistical characteristics
Figures 10 and 11 show the distributions of rms-fluctuations of axial velocity and temperature along the jet axis and the mixing layer (r/D=0.5), respectively.The rms-fluctuations of axial velocity normalized with the maximum axial mean velocity in the jet inlet gradually decrease along the jet axis due to the high viscosity caused by high temperature.Even if the inlet turbulence intensity is 10%, it decreases to a minimum nearz/D=2,which is similar to the laminar hightemperature potential core observed in experiment [34].However, the rms-fluctuations of axial velocity near the jet mixing layer decrease first and then rapidly increase due to the growth of Kelvin–Helmholtz instability, which exceeds the rms-fluctuations of axial velocity in the jet axis.Furthermore,it was seen in figure 10(b)that for the cases with a Reynolds number of 1148, increasing the turbulence intensity in the jet inlet will increase the turbulent transport mechanism in the mixing layer, leading to the peak of rmsfluctuations of axial velocity arriving earlier.Thusly, this is the cause for the differences of the mean axial velocity and mean temperature of the two cases with a Reynolds number of 1148,as shown in figures 6 and 7.However,for cases with a Reynolds number of 1722, the change in inlet turbulence intensity only affects the rms-fluctuations of axial velocity withinz/D<2.With the development of the jet,the change in the rms-fluctuations of axial velocity of the two cases is same.The effect of the turbulent transport mechanism increases as the Reynolds number in the jet inlet increases(the slope of the high Reynolds number cases in figure 10(b)is much higher than those of the low Reynolds number cases).Regardless of whether it is in the jet axis or the mixing layer,increasing the Reynolds number in the jet inlet will allow the peaks of the rms-fluctuations of axial velocity to arrive earlier and increase the peaks.The rms-fluctuations of temperature are normalized with the difference between the maximum temperature in the jet inlet and ambient temperature.The variety of rms-fluctuations of temperature is the same as that of the rms-fluctuations of axial velocity in the downstream of the jet.

Figure 9.Circumferential vorticity for different cases.(a) Jet-1148-2, (b) Jet-1148-10, (c) Jet-1722-2, (d)Jet-1722-10.
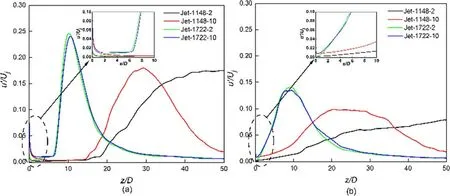
Figure 10.Distributions of rms-fluctuations of axial velocity (a) along the jet axis, (b) along the mixing layer.
The radial distributions of the rms-fluctuations of the axial velocity and temperature at several downstream positions are displayed in figures 12 and 13, respectively.Here,the local velocity half-widthLuand the local temperature half-widthLTare used to normalize the radial coordinates,respectively.Here,Luis defined as the radial distance where the local mean axial velocity meetsandLTis defined as the radial distance where the local mean temperature meetsUcandTcare the mean velocity and mean temperature in the jet axis, respectively.First, the peaks of the rms-fluctuations of axial velocity and temperature appear near the mixing layer.With the development of the jet, the peaks of the rms-fluctuations of axial velocity and temperature move to the jet axis and increase with increasing the Reynolds number in the jet inlet.Finally,the rms-fluctuations of the axial velocity and temperature are reduced by the mixing process.
Radial distributions of the normalized Reynolds shear stress〈 u ′v′〉Uj2/ are plotted in figure 14.For clarity,different scales are used for the vertical axes of each case.For case Jet-1148-2, the maximum value of the Reynolds shear stress appears atz/D=30,which is about1.2 ×10−4.The turbulence intensity in the jet inlet increased by a factor of 5 and the maximum value of the Reynolds shear stress increased by about 5 times for the two cases with a Reynolds number of 1148.However,for the two cases with a Reynolds number of 1722,the maximum value of Reynolds shear stress appears atz/D=10,which is about 25 times the maximum value of case Jet-1148-2.As the jet half-width increases,the Reynolds shear stress gradually decreases and disappears downstream.The shearing effect is strong enough to cause the rapid development of turbulence, resulting in a completely turbulent jet.So the change in turbulence intensity has almost no effect on the distributions of Reynolds shear stress for the two cases with a Reynolds number of 1722.
3.4.Self-similarity of a thermal plasma jet
For a circular turbulent cold (near room-temperature) gas jet,the distribution of mean axial velocity in the jet axis normalized by the maximum axial velocity of the jet inlet,Uj/Uc,has nothing to do with the Reynolds number in the jet inlet,which satisfies self-similarity [35–38]
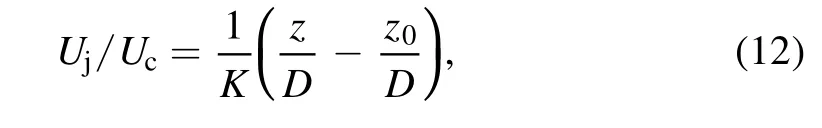
where,Ucis the mean velocity in the jet axis,z0is a virtual origin, andKis the decay constant, which varies from 5.7 to 6.1.However, the temperature and physical properties of the thermal plasma jet change sharply along the jet axis, and equation (12) can no longer be satisfied.
Figures 15 and 16 show the distributions of the mean axial velocityUj/Ucand mean temperatureΔTj/ΔTcalong the jet axial direction,respectively.Here,the variables refer to as follows:ΔTcis the difference between the mean temperature in the jet axis and the ambient temperature,namelyΔTc=Tc−T∞,andΔTjis the difference between the maximum temperature in the jet inlet and the ambient temperature, namelyΔTj=Tj−T∞.The turbulent argon thermal plasma jet,in which the mean axial velocity along the jet axial direction decays faster than that in the laminar thermal plasma, satisfies the self-similarity.The decay constant is equal to 1.25, which is much smaller than that of a circular turbulent cold gas jet and has nothing to do with the Reynolds number and turbulence intensity in the jet inlet.The distribution of the mean temperatureΔTj/ΔTcin the axis of the turbulent argon thermal plasma jet is similar to that of the mean velocityUj/Uc.

Figure 11.Distributions of rms-fluctuations of temperature (a) along the jet axis, (b) along the mixing layer.

Figure 12.Radial distributions of rms-fluctuations of axial velocity.

Figure 13.Radial distributions of rms-fluctuations of temperature.

Figure 14.Radial distributions of Reynolds shear stress.

Figure 15.Axial distributions of the mean axial velocity Uj / Ucfor different cases.
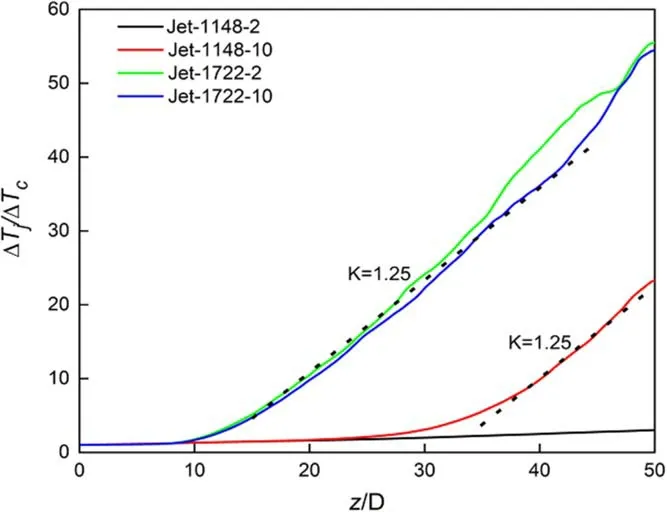
Figure 16.Axial distributions of the mean temperature Δ Tj/Δ Tcfor different cases.

Figure 17.Radial distributions of the mean axial velocity at several downstream positions.
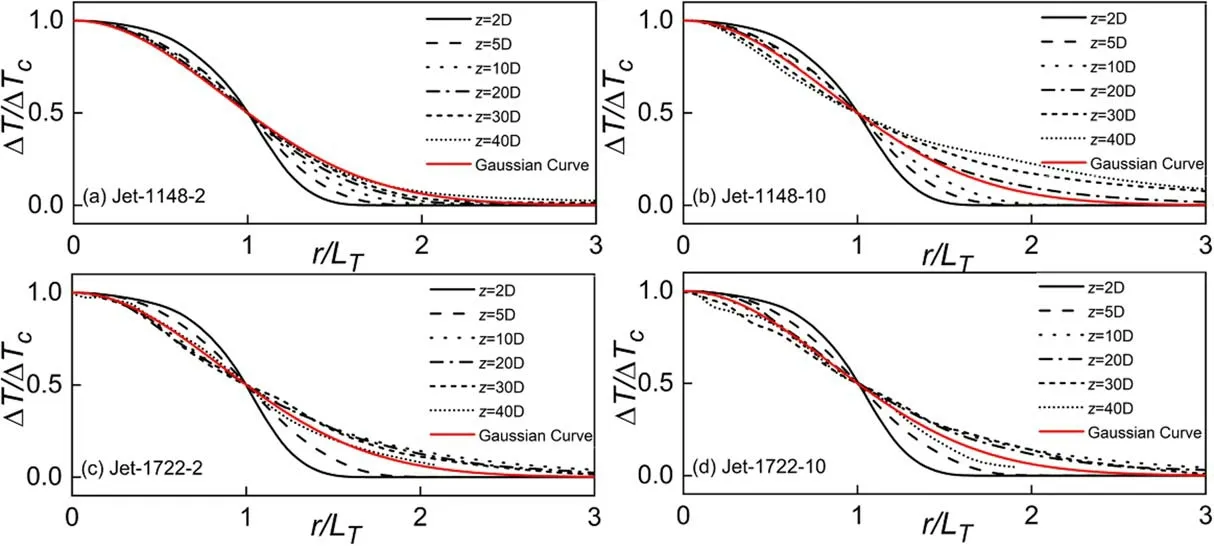
Figure 18.Radial distributions of the mean temperature at several downstream positions.
The radial distributions of the mean axial velocity and mean temperature at several downstream positions are displayed in figures 17 and 18, respectively.The local mean velocity and local mean temperature are normalized by the mean velocity and mean temperature in the axis of thermal plasma jet, respectively.It is shown that both laminar and turbulent thermal plasma jets exhibit self-similarity at the downstream of the jet, satisfying a Gaussian distribution[20, 39]

However, the radial distributions of the mean axial velocity and mean temperature are different from the Gaussian distribution at =zD2 , =zD5 and =zD40 , which may be affected by the inlet and outlet boundary conditions.
4.Conclusions
A large eddy simulation module solving thermal plasma jet was developed based on the CFD software OpenFOAM.Large eddy simulations have been used to study the effect of Reynolds number and turbulence intensity in the jet inlet on the characteristics of flow and mixing of the argon thermal plasma jet, and the development process of turbulence, in which the inlet diameter of the jet is 8 mm, the maximum temperature is 13 000 K, the Reynolds number ranges from 1148 to 1722,and the turbulence intensity ranges from 2%to 10%.First, the accuracy of the numerical method was validated by the experimental data of the mean temperature field of the argon thermal plasma jet into the cold argon.Good agreement between present predicted results and experimental data was shown.The flow characteristics and mixing of argon thermal plasma jets were analyzed by the average flow field,instantaneous flow field, turbulence statistical characteristics,and jet self-similarity.
When the Reynolds number in the argon thermal plasma jet inlet was 1148, increasing the turbulence intensity in the jet inlet increased the turbulent transport mechanism in the mixing layer rather than in the jet axis, resulting in faster development of turbulence, which then caused the rapid dissipation of the mean axial velocity and mean temperature in the downstream.Compared with the low Reynolds number argon thermal plasma jet, the high Reynolds number argon thermal plasma jet has a stronger turbulent transport mechanism.As a result, the characteristics of flow and mixing are not affected by the change in turbulence intensity in the jet inlet,the length of the high-temperature region is shorter,and the axial gradient of mean axial velocity and mean temperature are larger.
Compared with laminar thermal plasma, the mean axial velocity and mean temperature in the jet axis of turbulent thermal plasma decay faster and satisfy self-similarity downstream.The decay constantKis 1.25,which has nothing to do with Reynolds number and turbulence intensity in the jet inlet,and is much smaller than that of the circular turbulent cold gas jet.Whether it is the laminar thermal plasma jet or the turbulent thermal plasma jet, the axial mean velocity and mean temperature distributions in the radial direction show self-similarity satisfying a Gaussian curve.
Acknowledgments
This work is supported by National Natural Science Foundation of China (No.12035015).The numerical simulations in this paper have been performed on the supercomputers in the Supercomputing Center, University of Science and Technology of China.
猜你喜欢
Plasma Science and Technology(2022年5期)2022-06-01
神剑(2021年3期)2021-08-14
东坡赤壁诗词(2019年1期)2019-04-30
东坡赤壁诗词(2018年3期)2018-07-16
东坡赤壁诗词(2018年3期)2018-07-16
南方文学(2016年4期)2016-06-12
岁月(2016年6期)2016-05-14
微型小说选刊(2014年9期)2014-11-15
小小说月刊·下半月(2014年6期)2014-05-14
可乐(2011年5期)2011-05-11
 Plasma Science and Technology2021年12期
- Plasma Science and Technology的其它文章
- Numerical simulation of nanosecond laser ablation and plasma characteristics considering a real gas equation of state
- The propagation dynamics and stability of an intense laser beam in a radial power-law plasma channel
- Effect of edge magnetic island on carbon screening in the J-TEXT tokamak
- Relativistic effect on synergy of electron cyclotron and lower hybrid waves on EAST
- Influence of the X-point location on edge plasma transport in the J-TEXT tokamak with a high-field-side single-null divertor
- A simulation study of protons heated by left/right-handed Alfvén waves generated by electromagnetic proton–proton instability