
Biophysical model for high-throughput tumor and epithelial cell co-culture in complex biochemical microenvironments
2022-02-24 09:38GuoqiangLi李国强YanpingLiu刘艳平JingruYao姚静如KenaSong宋克纳GaoWang王高LianjieZhou周连杰GuoChen陈果andLiyuLiu刘雳宇
Chinese Physics B 2022年2期
关键词:陈果
Guoqiang Li(李国强), Yanping Liu(刘艳平), Jingru Yao(姚静如), Kena Song(宋克纳),Gao Wang(王高), Lianjie Zhou(周连杰), Guo Chen(陈果), and Liyu Liu(刘雳宇),‡
1Chongqing Key Laboratory of Soft Condensed Matter Physics and Smart Materials,College of Physics,Chongqing University,Chongqing 401331,China
2College of Medical Technology and Engineering,Henan University of Science and Technology,Henan 471023,China
The in vivo tumor microenvironment is a complex niche that includes heterogeneous physical structures,unique biochemical gradients and multiple cell interactions.Its high-fidelity in vitro reconstruction is of fundamental importance to improve current understandings of cell behavior, efficacy predictions and drug safety.In this study, we have developed a high-throughput biochip with hundreds of composite extracellular matrix (ECM) microchambers to co-culture invasive breast cancer cells(MDA-MB-231-RFP)and normal breast epithelial cells(MCF-10A-GFP).The composite ECM is composed of type I collagen and Matrigel which provides a heterogeneous microenvironment that is similar to that of in vivo cell growth.Additionally,the growth factors and drug gradients that involve human epidermal growth factor(EGF),discoidin domain receptor 1(DDR1)inhibitor 7rh and matrix metalloproteinase inhibitor batimastat allow for the mimicking of the complex in vivo biochemical microenvironment to investigate their effect on the spatial-temporal dynamics of cell growth.Our results demonstrate that the MDA-MB-231-RFP cells and MCF-10A-GFP cells exhibit different spatial proliferation behaviors under the combination of growth factors and drugs.Basing on the experimental data,we have also developed a cellular automata (CA) model that incorporated drug diffusion to describe the experimental phenomenon, as well as employed Shannon entropy (SE) to explore the effect of the drug diffusion coefficient on the spatial-temporal dynamics of cell growth.The results indicate that the uniform cell growth is related to the drug diffusion coefficient,which reveals that the pore size of the ECM plays a key role in the formation of complex biochemical gradients.Therefore, our integrated,biomimetic and high-throughput co-culture platforms,as well as the computational model can be used as an effective tool for investigating cancer pathogenesis and drug development.
Keywords: microfluidic,high-throughput,biochemical gradient,cancer
1.Introduction
Breast carcinoma is a malignant disease that poses a serious threat to the health of women.[1]Its poor prognosis is not only regulated by genes, but also exhibits a vital relationship within vivotumor’s microenvironment.[2,3]For instance, the extracellular matrix (ECM) provides mechanical support for cell growth as well as spatiotemporally biochemical signals,which plays an important role in guiding the differentiation,adhesion and migration of cancer cells.[4–6]Therefore, constructing anin vitroco-culture model is essential to the precise study of cancer development.
In addition to basic research, the pharmaceutical industry also requires a more reliable and predictable screening approach to better assess drug responses in preclinical study.Currently, owing to the lack of an accurate predictive models,a number of drug efficacy tests are primarily performed in two-dimensional (2D) culture systems and animal models.[7]However, such models are generally considered to have the disadvantages of high chemical doses, time-consuming, and an inability to reproduce the tumor physiology in the human body.[8]As a deleterious consequence,it is not only unable to meet the requirements of high-throughput drug screening,but also results in more than 80% of drug candidates failing after entering the clinical trials.[9]Fortunately, the advances in microfluidics allow for the development of a novel multifunctional platform for cancer research,especially for the study of cell sorting, pathogenesis and drug screening.[10–14]For example, by loading bionic gels such as collagen or Matrigel with human-derived cells into the biochip, many researchers have constructed various micro-lesions that mimic the structure of vasculature,[15]glomerulus[16]and breast ducts.[17]These models are useful for revealing the mechanisms of cancer metastasis, and can be used as an experimental platform for drug screening.
Moreover, establishing concentration gradients inside biochip for realizing high-throughput drug screening is another important aspect of our study.In general,concentration gradients are common in cell physiology and developmental biology.For example, extracellular gradients are necessary to direct cell migration,[18]while intracellular gradients play an important role in regulating processes such as cell division, polarity and mitosis.[19]For cancer patients undergoing chemotherapy, their tumor tissues are not only rich in nutritional factors,e.g.,epidermal growth factor(EGF),serum and glucose, but also flood with various chemotherapy drugs.In such cases, complex nutrient/drug gradients would dually affect the cell behavior and physiology.Therefore, it is necessary to construct stable complex biochemical gradientsin vitroto mimic thein vivomicroenvironment more realistically.To date,there are two types of concentration gradients generated by microfluidics.One is convection,i.e.,solute transport through the boundaries of laminar flow that is parallel to each other(flow-based gradient generation),[20]and the other is diffusion, i.e., solute passive diffusion from a source to a sink(diffusion-based gradient generation).[21]Compared with the former,the concentration gradient established by the diffusion of small molecules in porous gels is more advantageous.It not only avoids the effect of fluid shear force that is caused by convection on cell physiology and behavior,but also provides a three-dimensional(3D)microenvironment similar toin vivofor cell growth.[22]However, to best of our knowledge, this type of generator is mostly used to establish a single drug gradient, and does not consider the individualized design of the microenvironment.
In this work, considering the physical and biochemical factors in tumor tissues,we have constructed a biochip-based model that contains complex biochemical gradients and hundreds of ECM chambers embedded with cells.By controlling the growth factor/drug gradients across the entire chip,cells in each chamber experienced different local biochemical conditions and exhibited distinct behaviors and physiologies.Moreover, based on experimental data, we have also developed a cellular automata(CA)model incorporating drug diffusion to describe the dynamics of cell growth in complex biochemical gradients,and explained the effect of the drug diffusion coefficient on cell proliferation.Overall, our results demonstrate that the biochip and computational model are expected to provide a potential platform for investigating cancer pathogenesis and high-throughput drug screening.
2.Materials and methods
2.1.Microfluidic device design and fabrication
To construct a high-throughputin vitrotumor/epithelial cell co-culture model that is closer toin vivomicroenvironment, we designed and fabricated a biochip based on polydimethylsiloxane(PDMS)and composite ECM.As illustrated in Fig.1(a),the integrated device contains three main components: (i) a PMMA jig lid with four thumb screws and eight reservoirs for chip sealing and medium storage;(ii)a biochip with a PDMS–ECM–PDMS sandwich structure for cell coculture;(iii)a PMMA jig base with four screw holes cooperate with lid to support and clamp the biochip.Moreover, both of the jig base and lid were designed with an observation window to facilitate the continuous tracking of cell growth.During the experiment,the PMMA jig was processed by a company(Beijing Zhongke Hengxin Mechanical and Electrical Equipment Co.,Ltd.,China),and the biochip was fabricated in the laboratory by traditional SU-8 lithography and soft lithography.[23]Obviously, the PDMS lid possesses an array of cubic protrusions with a size of 200×200×200µm(Figs.1(b)and 1(c)).The PDMS base supports four independent microfluidic channels for introducing different media,and the central square region is prepared for loading the ECM and cells (Fig.1(d)).Figure 1(e)is the photograph of an assembled microfluidic device.
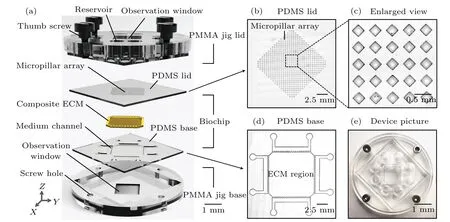
Fig.1.Construction of the microfluidic device.(a)Hierarchical structure of the integrated device,including PMMA jig lid,PDMS lid,composite ECM,PDMS base and PMMA jig base.(b)Microscopy image of the PDMS lid confirms that it possess an array of cubic protrusions.(c)Enlarged image from(b)shows that the size of each protrusion is about 200×200×200µm.(d)Microscopy image of PDMS base displays the tetragonal lined trapezoid pillars that separate the central ECM region from the four medium channels on the edges.(e)Photograph of an assembled microfluidic device.
2.2.Cell culture and cell seeding
Normal human breast epithelial cell line MCF-10A marked with green fluorescent protein (GFP) and invasive breast cancer cell line MDA-MB-231 marked with red fluorescent protein(RFP)were obtained from China Infrastructure of Cell Line Resources(Beijing,China).Before seeding,MDAMB-231-RFP cells were maintained in DMEM(Corning)supplemented with 10.0% fetal bovine serum(FBS)(Gibco)and 1.0% penicillin/streptomycin(Corning).MCF-10A-GFP cells were cultured in Dulbecco’s modified Eagle’s medium-F12(DMEM/F12)(Corning)supplemented with 5.0% horse serum(Gibco), 1.0% penicillin/streptomycin (Corning), 20.0 ng/ml human EGF (Gibco), 10.0 µg/ml insulin (Roche Diagnostics Gmbh), 100.0 ng/ml cholera toxin (Sigma) and 0.5 µg/ml hydrocortisone (Corning).All cells cultured under standard conditions (37.0°C in a humidified atmosphere, 5.0% CO2)and the medium was refreshed every 2 days.After the cells reached 90% confluence, the cell suspension was prepared according to the standard procedure of cell subculture.For cell seeding, 10.0 mg/ml Matrigel (Corning) and 6.0 mg/ml Collagen type I (Corning) were mixed at 1:1 and injected into the biochip for constructing ECM microchambers.Then,MCF-10A-GFP cells and MDA-MB-231-RFP cells suspensions were successively seeded into the chambers.Specifically, the cell seeding process was performed on an ice bath to avoid cell adhesion to the ECM outside the chamber.After the cell suspension was added to the ECM region, it was allowed 1.0 min to precipitate cells into each chamber.Then,the excess cells outside the chamber were gently rinsed off with cold 1×PBS.Finally,the cell-seeded chip was sealed by coverslip pre-coated with collagen,and the media of two cells were mixed at 1:1 for co-culture.
2.3.Complex gradients simulation and validation
To assess whether the designed biochip can generate gradients, we selected three common fluorescent dyes,i.e.,Rhodamine-Dextran(10kDa,red),Cascade blue-Dextran(3kDa, bule) and FITC-Dextran (3kDa, green) for gradient simulation and tests.[24–26]Here, the COMSOL software(Multiphysics 5.3a, Sweden) was employed to simulate the diffusion of dyes in the ECM.In brief, we firstly created a two-dimensional finite element model of the same size as the biochip.According to the reported literature, the initial concentration and diffusion coefficient were set as 10.0µg/ml and 1.0×10⁻⁷cm2/s,respectively.[27]Then,the diffusion of dyes in the ECM was simulated using the “Transport of Diluted Species” package within the COMSOL software.Moreover,three fluorescent dyes(10.0µg/ml)and 1×PBS were injected into the four media channels to validate the formation of complex gradients.During the experiment,each dye solution was refreshed every 24.0 h.The time-lapse fluorescence images of the biochip were taken every 8.0 h until 96.0 h.Then, the gradients for each dye at the time points were quantified using the MATLAB software(MathWorks,USA)by measuring their average fluorescence intensity at different positions.
2.4.Cell assay and quantification of cell proliferation
To evaluate the high-throughput drug screening properties of our platform, the cell-seeded biochip was incubated in the presence or absence of complex biochemical gradients.Here,the complex biochemical gradients were generated by injecting 1×EGF (0.04 µg/ml), 2×EGF (0.08 µg/ml), batimastat(66.0 µg/ml) and 7rh (22.44 µg/ml) into the channel around the ECM region,and the medium was refreshed every 24.0 h to maintain a relatively consistent concentration at the source and sink.Moreover,to quantitatively analyze the cell proliferation over time and space,the time-lapse fluorescence images of the cells were captured every 24.0 h under the same conditions using an inverted fluorescence microscope (Nikon, Ti-E).As the previous studies indicated that the cell number is proportional to the cell fluorescence intensity,therefore the latter can be calculated to represent the spatial-temporal proliferation of cells inside the biochip.[28,29]In details, the fluorescence image was gray processed(white-gray value was 255,black-gray value was 0) and equally divided into 324 sub-regions using the MATLAB software (MathWorks, USA).Then, the gray value of per pixel in each sub-region was analyzed to obtain its average value Gray, that is,Gray = ∑Gray(i)/n, wherei=1,2,3,...,n, andnis the sum of pixel numbers in each sub-region.Finally, based on the obtained data, the spatialtemporal distribution of the cell fluorescence intensity was plotted to indirectly assess the cell number variations.
3.Results and discussion
3.1.Establishment and characterization of the tumor/epithelial cell co-culture model
The aim of this work is to develop a high-throughput tumor/epithelial cells co-culture model that closely mimics thein vivomicroenvironment.To achieve this goal, we developed a microfluidic device and a series of operation procedures to complete the construction of model (Fig.2(a)).Initially, a chip base with trapezoidal pillars and a chip lid with square pillars were fabricated by soft-lithography technology based on an SU-8/silicon mold, and followed by sterilization with 75% ethanol (step 1).Before use, the surfaces of the chip base and chip lid were hydrophilic and hydrophobic modified with fibronectin and bovine serum albumin (BSA), respectively (step 2).Specifically, the chip base was incubated with 100.0 µg/ml fibronectin solution at 37.0°C for 4.0 h to enhance its adhesion to the ECM.The chip lid was coated with 2.0% BSA at 37.0°C for 2.0 h to prevent it from sticking to the ECM.After surface modification, the chip base and chip lid were aligned together to form a mold for ECM microchambers and the composite ECM was simultaneously injected into the chamber for gelling at 37.0 °C.Then, the upper lid was peeled off and formed an array of microchambers in the ECM region(step 3).Next,the MCF-10A-GFP cells were uniformly seeded into the chamber and incubated for 6.0 h to allow them for sticking to the inner wall (step 4).Similarly, the MDAMB-231-RFP cells were seeded according to the same procedure (step 5).After cell seeding, the biochip was sealed with a coverslip pre-coated with collagen and clamped with the PMMA jig (step 6).Finally, the medium was introduced into the channels and the integrated device was placed in an incubator at 37.0°C,5.0% CO2for culture.

Fig.2.Establishment and characterization of tumor/epithelial cell co-culture model.(a)Schematic diagram of constructing the tumor/epithelial cell co-culture mode.(b)–(d)The formation process of tumor/epithelial cell co-culture model characterized by confocal microscopy.Among them, (b) shows the image of representative ECM microchamber (black) fabricated by collagen soft-etching technology; (c) displays the snapshot after seeding MCF-10A-GFP cells (green) into ECM microchamber; (d) exhibits the snapshot of MCF-10A-GFP cells (green) and MDA-MB-231-RFP cells(red)co-cultured in an enclosed ECM microchamber.
Moreover, during the establishment of the tumor/epithelial cell co-culture model,two-photon confocal microscopy was employed to characterize the ECM microchambers and cells.Figures 2(b)–2(d) display the representative images of the microchamber at different formation stages.In Fig.2(b), the upper 2D image shows that the square microchambers(black)were wrapped by collagen fibers(blue)in the ECM,and the enlarged 3D image below indicates that the size of each chamber was approximately 150×150×60µm.After seeding MCF-10A-GFP cells(green), it was found that the majority of cells adhered to the inner wall and formed a hollow structure inside the chamber (Fig.2(c)).This phenomenon is consistent with the previous results,that is,MCF-10A-GFP cells prefer to adhere to the ECM for growth.[30]Obviously, the presence of the hollow structure provided a space for tumor cell seeding.Then, after seeding MDA-MB-231-RFP cells (red) into the chamber, most of them were uniformly deposited in the hollow structure of MCF-10AGFP cells(green),and formed a niche that is similar to that ofin vivoreal tumor(Fig.2(d)).Compared toin vivocomplex structures,[31]e.g., duct, our model does not contain basement membrane, myoepithelial cells and stromal cells, but it integrates hundreds of the tumor/epithelial cell co-culture system on a single chip, and can cooperate with optical imaging technology to realize real-time observation of cell behaviors.Moreover,due to the permeability of ECM,this model also has the potential to generate concentration gradients to emulatein vivocomplex biochemical microenvironments.Therefore,our model not only makes up the inconvenience of continuous observation of real tumor,but also provides an opportunity for high-throughput screening of drugs.
3.2.Generation of complex biochemical gradients and their effects on cell growth
After establishing the tumor/epithelial cell co-culture model, we continued to explore the biochemical potential of the biochip.Ultimately, our aim is to establish a platform for high-throughput drug screening,similar toin vivocomplex biochemical gradients.As reported in the literature,many natural or synthetic hydrogels, e.g., Matrigel and collagen have porous structures that enable a much smoother and uniform diffusion of small molecules.[32]Based on the unique design of biochips, our platform may be able to generate up to four biochemical gradients simultaneously.Here,we selected three common fluorescent dyes, i.e., Rhodamine-Dextran, Cascade blue-Dextran and FITC-Dextran for gradient simulation and tests.The COMSOL simulation indicates that each dye diffused along the channel towards the central region and formed complex biochemical gradients (Fig.3(a)).Apparently, the closer to the channel, the higher concentration of the dyes(Figs.3(a1)–3(a3)).Moreover, these simulation results can be verified by the dye gradient experiments.As illustrated in Fig.3(b),after flowing the dye solution into the channel,it diffused toward the center region,and gradually generated stable complex gradients at 96.0 h.Then,the fluorescence intensities of the three dyes in the biochip over time and space were quantitatively analyzed using MATLAB,and the results are plotted in Figs.3(b1)–3(b3).Obviously,the fluorescence intensity of each dye was negatively correlated with the distance from the source of the channel,and the gradient can be well maintained for at least 96.0 h.Technically speaking,the porous composite ECM can maintain the gradient stably as long as the relatively concentration keeps constantly at source and sink.

Fig.3.Simulation and validation of complex gradients in biochip.(a) Schematic diagram of COMSOL simulation for complex gradients obtained by merging(a1)–(a3).(a1)–(a3)COMSOL simulation for the diffusion of Rhodamine-Dextran,Cascade-Dextran and FITC-Dextran along with channels towards the central region,respectively.(b)Overview of the complex gradients in dye gradient experiments at 96.0 h.The image is the combination of three fluorescent channels.(b1)–(b3) The fluorescence intensity distributions of Rhodamine-Dextran, Cascade-Dextran and FITC-Dextran over position and time.The x-axis represents the distance from the channel, while the y-axis represents the fluorescence intensity of various dyes.Here,the distribution of fluorescence intensity reflects the concentration of dyes over time and space.
After confirming that our platform can generate up to four complex gradients,we further injected 1×EGF,2×EGF,batimastat and 7rh into the biochip to explore the effects of complex growth factor/drug gradients on cells(Fig.4(a)).Among them, EGF is a widely used growth factor that facilitates the growth of MDA-MB-231-RFP cells and MCF-10A-GFP cells.[33]Batimastat and 7rh are inhibitors of matrix metalloproteinases(MMPs)and discoidin domain receptor 1(DDR1),respectively,which can effectively inhibit the proliferation and migration of MDA-MB-231-RFP cells.[34,35]Moreover, batimastat also maintains the expression of E-cad and the structural integrity of epithelial cells by inhibiting MDA-MB-231-RFP cells to secrete MMPs,which is beneficial for the growth of MCF-10A-GFP cells.[36]After the four biochemicals were introduced into the channels, they diffused towards the center of the ECM region and gradually formed complex biochemical gradients.In this case, two types of cells in each chamber are supposed to experience different concentrations of biochemicals, which could potentially induce distinct behaviors and physiologies.Figure 4(b) and its representative enlarged image show that in the presence of complex biochemical gradients, cells in different regions exhibited different behaviors and aggregation morphologies.Specifically,at the junction of 1×EGF and 2×EGF, MDA-MB-231-RFP cells proliferated significantly and some of them had already migrated outside the chamber.Meanwhile, the aggregation of MCF-10A-GFP cells was destroyed by the proliferation of MDA-MB-231-RFP cells,resulting in dispersed morphology,which is consistent with the phenomenon observed by Fanet al.[30]In contrast, at the junction of batimastat and 7rh, the proliferation and migration of MDA-MB-231-RFP cells were inhibited, while MCF-10A-GFP cells showed an aggregated growth morphology.Moreover, the control experiment indicated that in the absence of growth factors and drugs,the two types of cells grew uniformly and did not exhibit spatial differences in the biochip(Fig.4(c)).This demonstrates that our platform could support a stable co-culture of MDA-MB-231-RFP cells and MCF-10A-GFP cells under contiguous perfusion of the medium.
In addition,to quantitatively analyze the spatial-temporal dynamics of cell proliferation,we calculated cell fluorescence intensity to represent its number at different time and space.Figure 4(d) shows the representative time-lapse fluorescence images of MDA-MB-231-RFP cells and MCF-10A-GFP cells co-cultured in the biochip.In Fig.4(d1), the fluorescence intensity of MDA-MB-231-RFP cells at 0 h was low and uniformly distributed throughout the map.Interestingly, after 48.0 h of incubation, their fluorescence intensities near 1×EGF and 2×EGF channels were slightly higher than those of other regions,and this tendency was significantly enhanced at 96.0 h.Figure 4(d2) shows the fluorescence intensity of MCF-10A-GFP cells at the same interval with MDA-MB-231-RFP cells.It can be seen that the fluorescence intensity of MCF-10A-GFP cells was also uniformly distributed at the beginning.Compared with MDA-MB-231-RFP cells, MCF-10A-GFP cells did not show regional differences inside the biochip over time.In other words,MCF-10A-GFP cells grew uniformly under the combination of growth factors and drugs,which seems to be independent of the detailed effects of the biochemicals.Therefore,our platform enables the generation of stable complex growth factor/drug gradients in a flexible and controlled manner.It is ideally suitable for simulatingin vivocomplex biochemical microenvironments, providing an effective platform for drug screening.Notably, due to that the formation of complex biochemical gradients is attributed to the porous ECM and its ability to diffuse small molecules,therefore, the selected drugs for high-throughput screening should be water-soluble and not react with the ECM.That is,some insoluble or ECM-degrade drugs are not suitable for this platform.
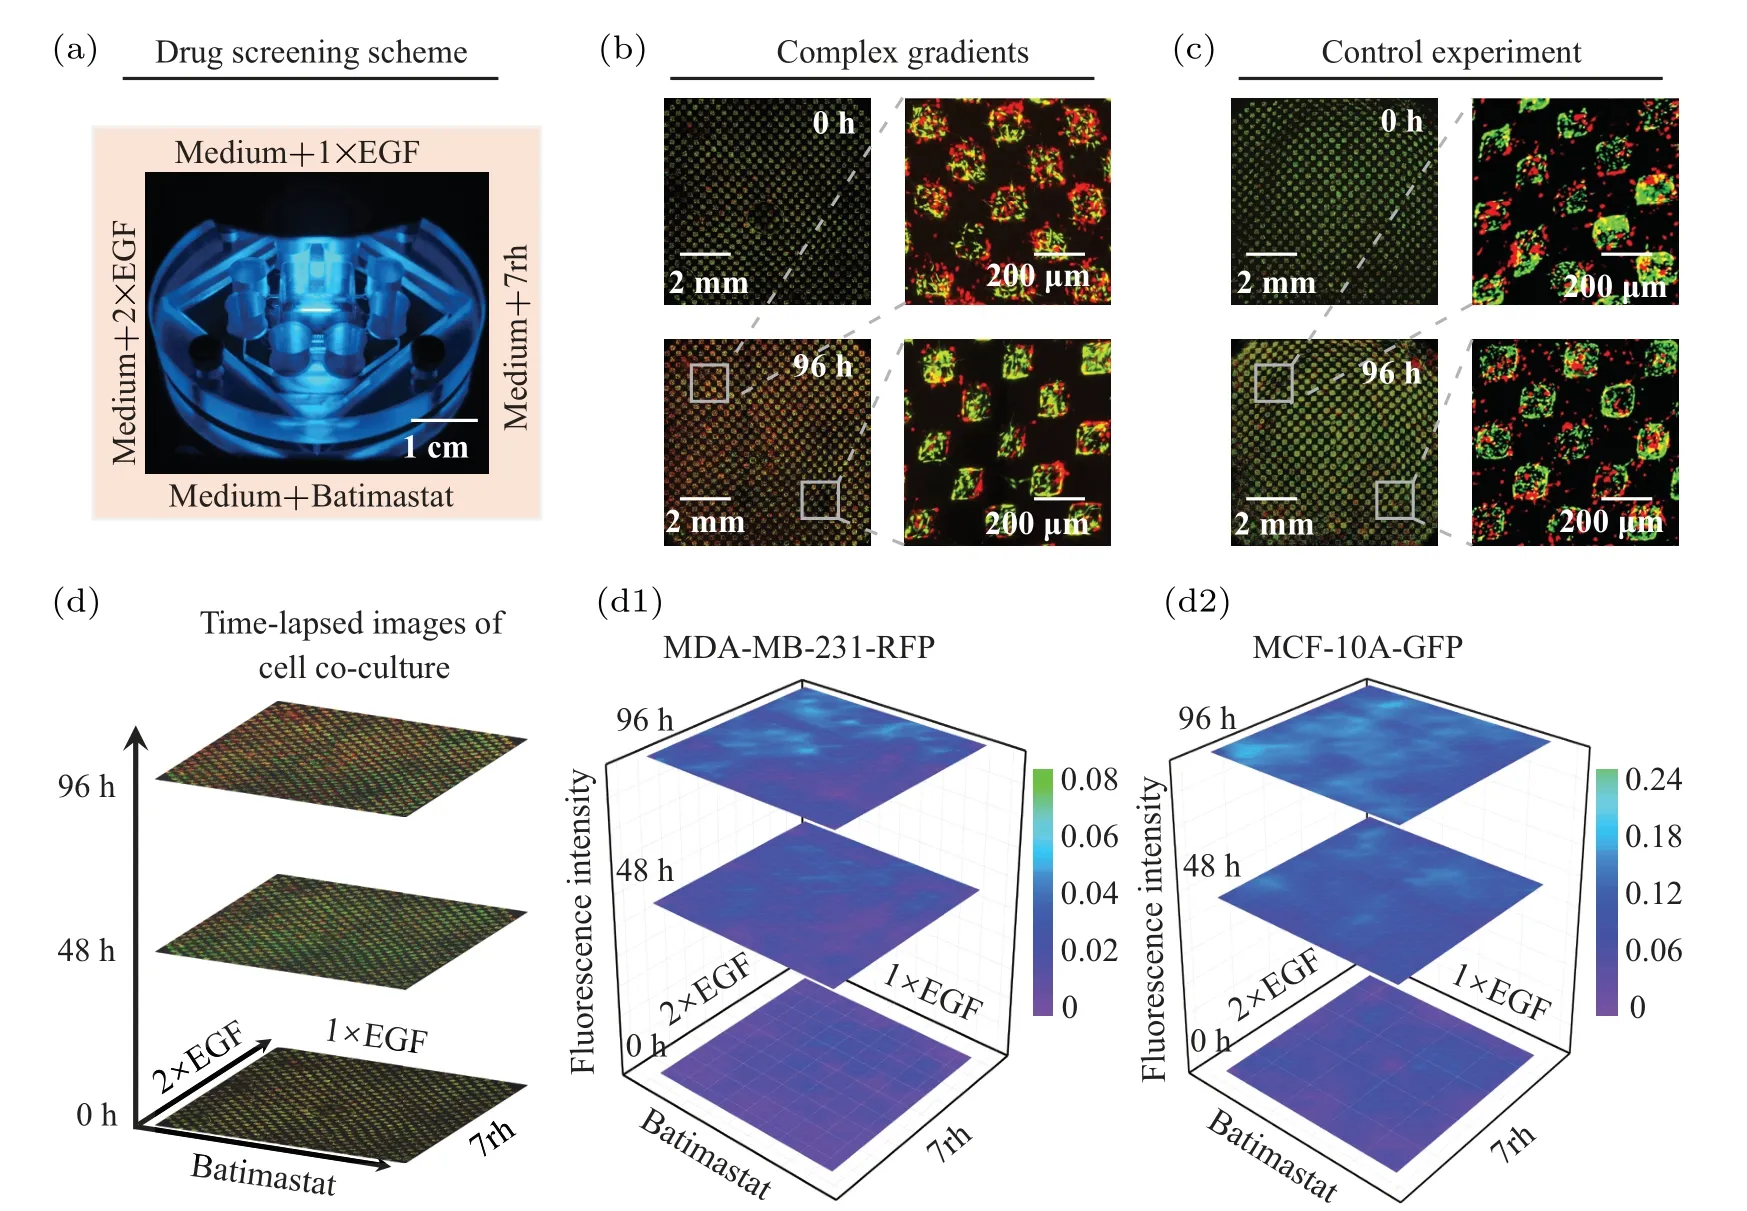
Fig.4.Effects of complex biochemical gradients on cell growth.(a)Schematic diagram of drug screening scheme.(b)and(c)The representative fluorescence images of MDA-MB-231-RFP cells(red)and MCF-10A-GFP cells(green)at 0 h and 96.0 h in the presence and absence of complex biochemical gradients, respectively.(d) Time-lapse fluorescence images of MDA-MB-231-RFP cells (red) and MCF-10A-GFP cells(green)co-cultured under the complex biochemical gradients.(d1)and(d2)The fluorescence intensities of MDA-MB-231-RFP cells and MCF-10A-GFP cells over time and space,respectively.
3.3.Cell growth simulated by cellular automata in complex gradients
After analyzing the effects of complex gradients on cell growth in the biochip, we aimed to introduce a CA model to describe cell behaviors in the context of biochemical gradients.In the early 1950s, the CA model was proposed by Von Neumann to simulate the self-replication function of life system,[37]and analyzed systematically by Stephen Wolfram in the 1980s.[38,39]This model has been widely used in mathematics, physics, and other fields.[40,41]It evolves on a grid of specified space based on the given rules and the states of neighboring cells through discrete time steps, and terminates until the outputs conform to the prescribed conditions.Inspired by the experimental results,we abstracted some mechanisms including drug diffusion,effects of drugs on cell proliferation,cell–cell interaction,etc.,to construct the corresponding CA model.The detailed procedure is as follows.
(i) Initializing the distribution of cells and biochemical gradients.The CA model involves two subjects,i.e.,cell distribution and drug distribution,and it is therefore necessary to prescribe the initial distributions on the grid of thex–yplane by referring to the experimental design.First,we seeded two types of cells into microchambers to form a uniform cell distributionI(x,y).Second,the continuous diffusion equation[27]was introduced to determine the initial(t=1)drug concentrations over spacec(x,t),which is given by
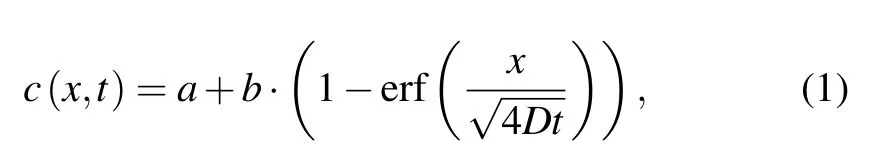
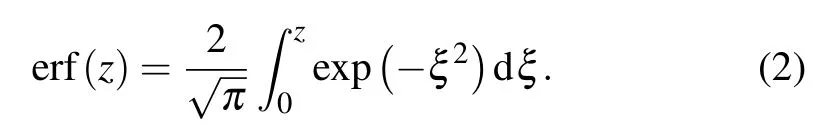
where parametersaandbdecide the maximum drug concentration,xis the distance between the drug input point and any point on the grid,Dis the diffusion coefficient of drugs,and erf is the Gauss error function regulating the ensemble tendency of drugs,which has the following form:
So far, the cell number and drug concentration for each grid have been defined.
(ii) Calculating the diffusion of the biochemical factors.After prescribing the initial distributions, cells start to consume drugs, and the consumption is related to the number of cells,which can be computed by
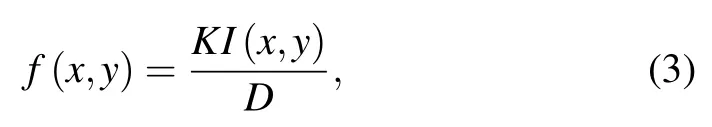
whereKis the consumption rate, andf(x,y) is located at a close interval of 0–1, indicating that the drug concentration will decrease on the site where cells appear.Although the consumption process is transient and continuous,it can be regarded as a stable process in discrete time steps.Thus, the formation of the steady-state diffusion of the drug concentration can be calculated by

(iii) Computing the cycle of cells for proliferation.For any discrete time step, we need to calculate the cell cycle for proliferation based on the Owen model,[42]which is a simplified version of the Alarcon model[43]and given by

whereTminis the minimal time required for a cell to complete a cycle,chalfis the drug concentration when a cell reaches half of the cycle,and the Cycle represents the cell cycle in the close interval 0–1.Due to the presence of four types of complex gradients including 2×EGF, 1×EGF, 7rh and batimastat, the right-hand side of Eq.(5) should be the linear superposition in the computer simulations.For example,the proliferation of MDA-MB-231-RFP cells is enhanced by EGF, but inhibited by 7rh and batimastat,thus the Cycle is the consequence of the net effects.In contrast, the MCF-10A-GFP cells are mainly affected by EGF and the number of MDA-MB-231-RFP cells,thus the linear superposition should contain three terms, i.e.,2×EGF,1×EGF and the effects of MDA-MB-231-RFP.Here,the last term here is defined as

whereNis the maximum number of cells for each microchamber.The equation above indicates that the more the MDA-MB-231-RFP cells,the stronger the inhibitory effect on MCF-10AGFP cells.
(iv) Performing cell proliferation and update cycles.In each discrete time step,the Cycle for cells is computed.At the beginning of the cell growth,the Cycle equals to 0 and gradually increases up to 1 when a cell divides into two cells, then resetting the Cycle of the two cells to 0.
(v) Performing iteratively step (ii)–step (iv).In the last step, the CA simulation has performed one time step, next it will loop step(ii)–step(iv).
(vi)Terminating.The CA simulation ends when the number of cells for each microchamber or runtime reaches the prescribed value(i.e.,N=2000 orT=1×10⁴).
Following the procedure above, we first simulated cell growth in an environment containing only medium.In details,the main parameters in CA simulation are given as follows:initial drug concentrations (400 for 2×EGF, 200 for 1×EGF,7rh and batimastat), diffusion coefficient (500 for the four cases),the minimal division cycleTmin(10 for MDA-MB-231-RFP cells and 20 for MCF-10A-GFP cells),chalfof MDA-MB-231-RFP cells (20 for 2×EGF and 1×EGF, 100 for 7rh and batimastat),chalfof MCF-10A-GFP cells(20 for 2×EGF and 1×EGF, 1000 for 7rh and batimastat), the consumption rateK(5 for four cases independent of cell types).Here, while the values above are dimensionless, all of them can represent the response of cells to complex gradients to some extent.After simulation, the results are shown in Figs.5(b1)and 5(b2).It is evident that both of the MCF-10A-GFP cells(Fig.5(a1))and MDA-MB-231-RFP cells(Fig.5(a2))are distributed uniformly on the grid of space for timestep=1, and still remain uniform when timestep=85,as seen in Figs.5(b1)and 5(b2).The results conform to of course what we expected and the experimental results(see Fig.4(c)).Furthermore, we also simulated the cell growth considering the effects of complex growth factor/drug gradients, and the strategy of growth factor and drug input was consistent with that of the experiment, that is, the left, top, right and bottom correspond with 2×EGF, 1×EGF, 7rh and batimastat, respectively.Here, the initial distributions of MCF-10A-GFP cells and MDA-MB-231-RFP cells were the same as those for the environment only containing medium(Figs.5(a1)and 5(a2)).Interestingly, the MCF-10A-GFP cells and MDA-MB-231-RFP cells behaved differently in the complex gradients, that is, the former does not exhibit obvious non-uniformity,meaning that the enhancement of EGF and the inhibition of MDA-MB-231-RFP cells have reached a balance (Fig.5(c1)).The latter does possess an obvious non-uniformity, and it is the consequence of the enhancement of EGF and the inhibitory of 7rh and batimastat(Fig.5(c2)).These results are in agreement with those of thein vitroexperiment(see Figs.4(b)and 4(d)),which clarifies two aspects: (i) the regulation mechanisms of drugs are complex and dependent on cell types;(ii)the CA model does possess a higher performance in characterizing cell growth in complex biochemical gradients.

Fig.5.Cell growth simulated by CA model in the presence and absence of complex growth factor/drug gradients.(a1)–(a2) The initial distributions of MCF-10A-GFP cells(a1)and MDA-MB-231-RFP cells(a2)for timestep=1.(b1)–(b2)and(c1)–(c2)are the distributions of MCF-10A-GFP cells and MDA-MB-231-RFP cells for timestep=85 in environment only containing medium and complex growth factor/drug gradients, respectively.Note that the values visualized in each panel are normalized by the number of respective cell type when the CA simulation is terminated.
3.4.Diffusion coefficient associated with ECM affects cell growth
In general, the drug diffusion coefficient is partly determined by the structure and properties of the ECM, and the coefficient can greatly affect cell growth.[44,45]Therefore, it is essential to study the features of cell co-culture and obtain insights into the role of the ECM in regulating cell behavior.In this section,we focus on the drug diffusion coefficient and employ the CA model to explore the regional features of cell distribution in the complex growth factor/drug gradients.The details are as follows: First, we uniformly divided the space into eight regions,as illustrated in Fig.6(a).Second,we simulated six cases with different diffusion coefficients and obtained the resulting cell distributions.Finally,we counted the numbers for the two types of cells in each region and obtained the percentages by dividing by the respective total cell numbers to characterize the uniformity of cell distribution in the biochip,the results are shown in Figs.6(b)and 6(c).
Evidently, the tendencies of percentage were almost the same as each other for MDA-MB-231-RFP cells in different cases of diffusion coefficients,i.e.,the percentages for the topleft region (including 1, 2, 3 and 4) are almost greater than 15.0%,while the percentages for the bottom-right regions(including 5, 6, 7 and 8) are less than 15.0% (Fig.6(b)).This tendency appears naturally because the top-left region is almost full of EGF, however, the bottom-right region is almost full of the inhibitors(7rh and batimastat).Here,the diffusion coefficientD=1 corresponds to the most uniform case,whileD=103corresponds to the most non-uniform case.Moreover,the drug distribution can also explain why a peak and a valley appear in regions 2,3 and regions 6,7,respectively.In particular,the uniformity encoded by percentage first decreases and then increases(non-monotonic)as the diffusion coefficient increases, i.e., more non-uniform for the value of the diffusion coefficient lying in the interval 1–103,and more uniform in the interval 103–105(Fig.6(b)).This phenomenon accords with our intuitiveness when considering two extreme cases.One corresponds to a diffusion coefficient close to 0, in which no biochemical gradient can form and cell distribution is almost uniform;the other corresponds to a diffusion coefficient close to infinity,which leads to no difference in drug concentration between any two points, thus the cell distribution also tends to be uniform.Additionally, the percentage of MCF-10AGFP cells exhibited the opposite tendency to that of MDAMB-231-RFP cells,i.e.,the percentages for the top-left region were less than 12.5%, while the percentages for bottom-right were almost greater than 12.5%.Specifically, the uniformity of MCF-10A-GFP cells also exhibits the non-monotonic behavior as the diffusion coefficient increases, which is similar to the tendency of the uniformity of MDA-MB-231-RFP cells with the diffusion coefficient.We argue that this tendency is mainly due to the combined effect of enhancement(EGF)and the inhibitory of MDA-MB-231-RFP cells.
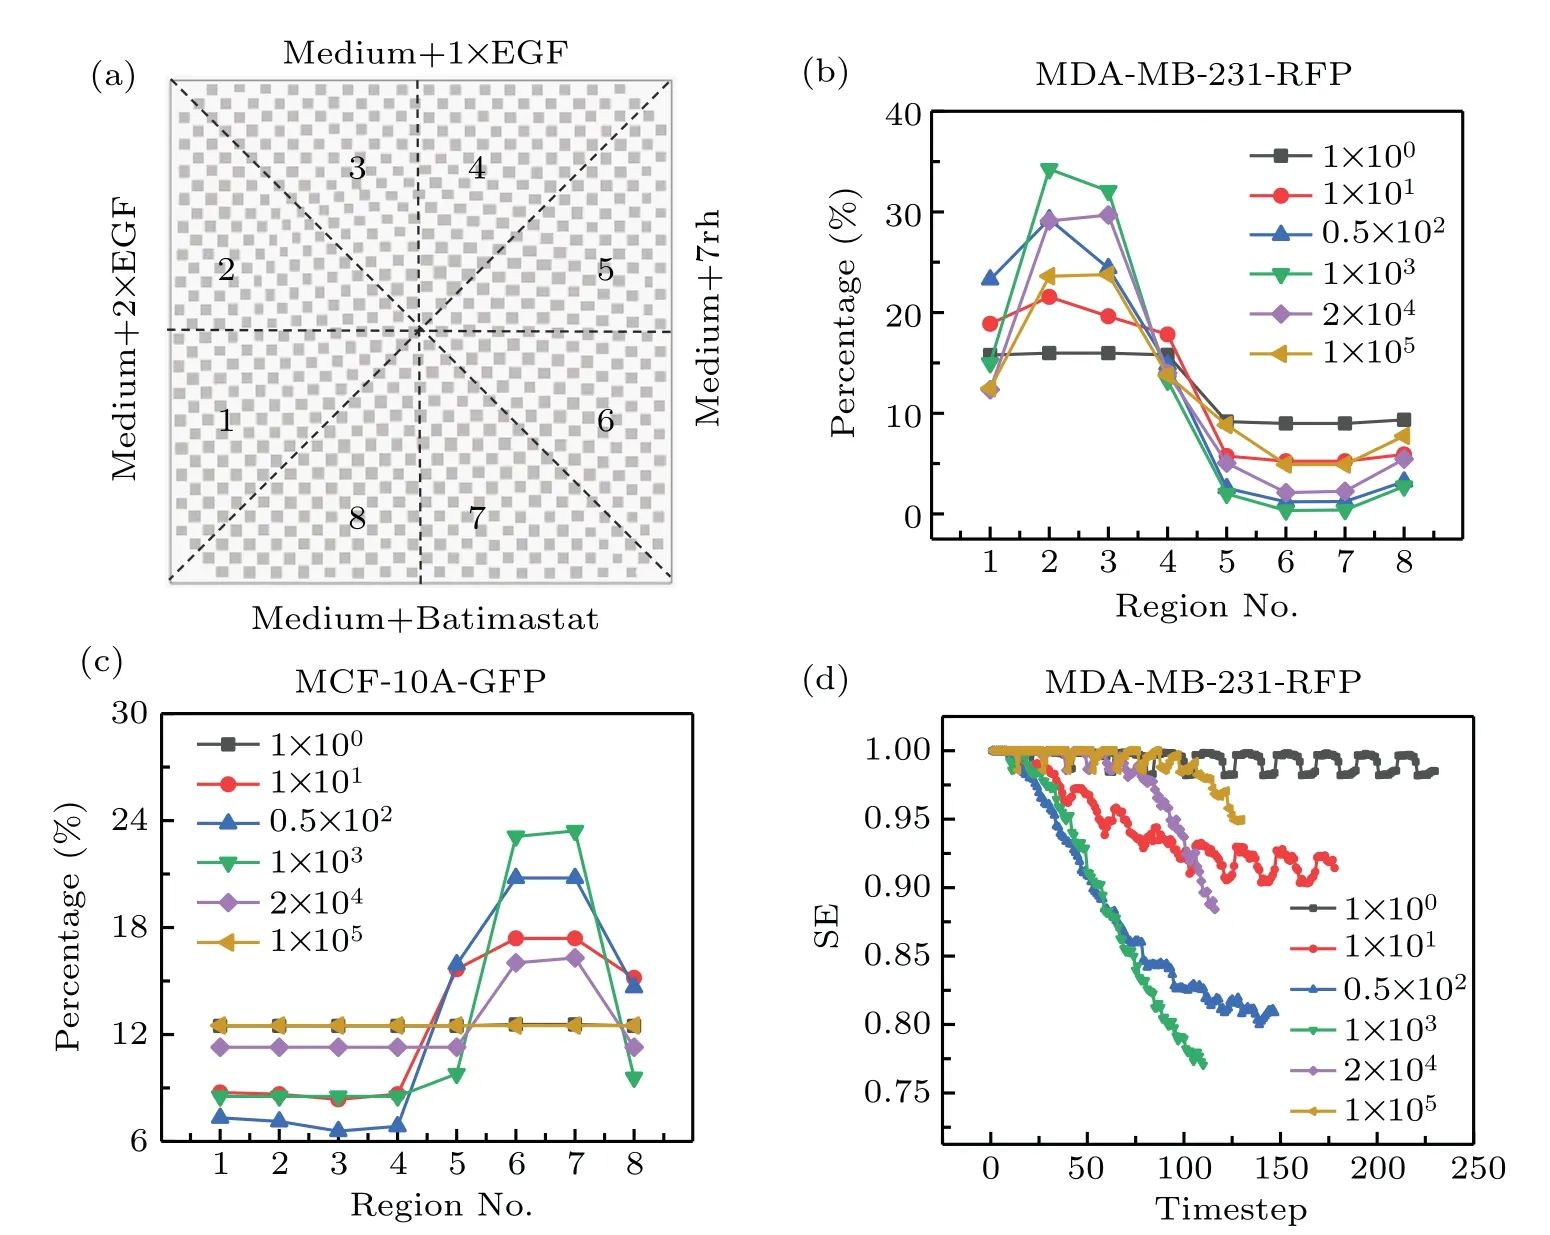
Fig.6.Effects of the drug diffusion coefficient on cell growth.(a)Schematic diagram of dividing uniformly the biochip into eight regions.(b)and(c)The percentage of MDA-MB-231-RFP cells and MCF-10A-GFP cells in each region for different diffusion coefficients,respectively.(d)Shannon entropy of MDA-MB-231-RFP cells distribution as a function of time for different diffusion coefficients.The parameters in CA model are identical with those shown in Fig.5.
To study the features of cell distribution over time, we further introduced Shannon entropy (SE)[46]to describe the uniformity mentioned above,see more details in our previous work.[47]Here,the value of SE locates in the close interval 0–1,and SE=1 indicates that cell distribution is uniform,in similar sense as Gibbs entropy[48]that describes the “randomness” of state of molecular,while SE=0 indicates that cell distribution is non-uniform.The SE of MDA-MB-231-RFP cells is plotted in Fig.6(d).The results clearly suggest two aspects:(i) the SE exhibits regular fluctuations, which may be a direct manifestation of cell cycle accumulation;(ii)the minimal value of SE first decreases and then increases as the diffusion coefficient increases, indicating that cell distribution follows the “uniform–nonuniform–uniform” process.This feature is identical to those in Figs.6(b)and 6(c).Therefore,according to the analysis above, we not only obtain more insights into the effects of drugs on cells,but also validate the effectiveness and practicability of the CA model in simulating cell growth in complex gradients.
4.Conclusions
In this study, we have designed and fabricated a highthroughput biochip that integrates hundreds of ECM microchambers for tumor/epithelial cell co-culture.With its unique design, the biochip enables the generation of up to four stable complex biochemical gradients taking advantage of ECM permeability.Based on these features, cells in each chamber experienced unique biochemical conditions and exhibited distinct behaviors and physiology.Furthermore, we have developed a CA model by incorporating the drug diffusion to describe the spatial-temporal dynamics of cell growth under complex biochemical microenvironments.Our model has not only effectively validated the experimental results,but also confirmed the role of the diffusion coefficient associated with ECM in establishing the complex biochemical gradients.Therefore, the experimental and computational models allow one to investigate the effect of complex biochemical gradients on cell growth over time and space, which offers a potential platform for high-throughput preclinical drug screening.Moreover,by logically changing the internal details of the biochip and optimizing the parameters of the computational model,it is expected to expand its applications in more related fields such as biological research and clinical drug guidance.
Acknowledgements
Project supported by the National Natural Science Foundation of China (Grant Nos.11974066 and 12174041), the Fundamental and Advanced Research Program of Chongqing,China (Grant No.cstc2019jcyj-msxmX0477), the Capital Health Development Research Project (Grant No.2020-2-2072),the Key Specialized Research and Development Breakthrough of Henan Province,China(Grant No.212102310887),and the Key Scientific Research Projects of Colleges and Universities of Henan Province, China (Grant No.21A416005).In addition,we would like to thank Miss Qin Deng at the Analytical and Testing Center of Chongqing University for her assistance with the confocal imaging.
猜你喜欢
Chinese Physics B(2022年8期)2022-08-31
美与时代·美术学刊(2022年3期)2022-04-27
桃之夭夭B(2020年4期)2020-05-21
第二课堂(初中版)(2020年1期)2020-05-11
小小说月刊·下半月(2019年8期)2019-09-17
文化交流(2019年3期)2019-03-18
莫愁·家教与成才(2017年9期)2017-09-19
莫愁(2017年27期)2017-09-15
美食(2016年7期)2016-10-20
清明(2014年4期)2014-11-17
- Chinese Physics B的其它文章
- High sensitivity plasmonic temperature sensor based on a side-polished photonic crystal fiber
- Digital synthesis of programmable photonic integrated circuits
- Non-Rayleigh photon statistics of superbunching pseudothermal light
- Refractive index sensing of double Fano resonance excited by nano-cube array coupled with multilayer all-dielectric film
- A novel polarization converter based on the band-stop frequency selective surface
- Effects of pulse energy ratios on plasma characteristics of dual-pulse fiber-optic laser-induced breakdown spectroscopy