
Mechanism analysis and improved model for stick-slip friction behavior considering stress distribution variation of interface
2022-03-12 07:44JingyuHan韩靖宇JiahaoDing丁甲豪HongyuWu吴宏宇andShaozeYan阎绍泽
Chinese Physics B 2022年3期
关键词:靖宇
Jingyu Han(韩靖宇), Jiahao Ding(丁甲豪), Hongyu Wu(吴宏宇), and Shaoze Yan(阎绍泽)
State Key Laboratory of Tribology,Department of Mechanical Engineering,Tsinghua University,Beijing 100084,China
Keywords: stress distribution,tangential stiffness,friction coefficient,stick-slip,friction model
1. Introduction
A mechanism generally transfers force or displacement through friction between contact surfaces of a contact pair. Influence of environment, temperature, oxidation, three-body,wear and plastic deformation on contact interfaces leads to complex contact behavior,[1,2]which make it difficult to accurately predict the interface friction.[3]At present, revealing the“black box”behavior of friction and establishing more accurate friction model are of great significance in many engineering fields.[1]At the same time,the in-depth study of friction is also a process for human beings to understand nature,machinery, structure, transmission and many other unknown factors.[4]
Friction characteristics are basically reflected in stickslip phenomena,such as precursor event,[5-7]non-local memory effect,[8-10]maximum static friction,[6,11-13]Stribeck effect,[14-17]and friction hysteretic effect.[6,13]In 1939,Bowden and Leben proposed the concept of “stick-slip” for the first time.[18]The stick-slip is the result of coupling action of many different mechanisms.These mechanisms depend on the geometric size,topology,normal load,loading mode,material characteristics,commensurability,relative displacement of the contact interface, sliding speed, friction coefficient, molecular film, temperature and lubrication, etc.[19-25]This paper mainly analyzes the stick-slip contact behavior in the dry friction field. Through the observation of AFM from the micro scale,[26]scholars have found that the stick-slip phenomenon is mainly caused by the roughness of the contact interface,and the stick-slip movement is directly related to the distribution of asperities on the contact interface.[27-29]
According to different engineering application backgrounds,scholars use different theories to explain the internal mechanism of stick-slip friction. For example,the friction coefficient theory is used for explaining the stick-slip mechanism in vibration,and the modal coupling theory is used for explaining the stick-slip mechanism in a braking system. Although scholars have made many explanations for the phenomenon of stick-slip friction,[30-33]it is not enough to accurately predict the friction between interfaces. For example, under the assumption of small static and kinetic friction coefficient,the approximate analytical solution of stick-slip vibration can be obtained by using perturbation theory.[13]However,due to the Painleve paradox,[34]“under certain conditions, Coulomb’s law of friction and rigid body dynamics are completely contradictory.”This will lead to“confusion”[35,36]when scholars use a rigid body dynamics model to simulate stick-slip friction behavior.[37]With the development of measurement technology and interface contact mechanics theory, the understanding of interface contact behavior is more in-depth,such as the load dependence of friction coefficient,[37-39]the characterization of stress distribution considering contact morphology and contact angle.[7,12,38,40-45]In recent years, with the development of contact visualization technology, analyzing the internal mechanism of nonlinear contact parameters by considering the state evolution of contact area has become a hot research topic in the field of tribology and control engineering. In this paper,the dynamic stress distribution and the evolution of micro contact behavior are considered. The relationship between the change of stress distribution and the nonlinear characteristics of contact parameters is revealed. Based on this theory,a stick-slip friction model considering the change of stress distribution is established,which provides a theoretical reference for improving the accuracy of dynamic performance prediction in practical engineering structures.
The plan of this paper is given as follows. Section 2 describes the experimental apparatus of interface contact behavior based on total reflection method, and analyzes the mechanism of experiment repeatability. In Section 3,the influence of tangential force on the contact area is analyzed. According to the evolution law of contact area during stick-slip process,the mechanism of interface tangential stiffness change is explained. In Section 4, considering the evolution of real contact area, the influence of normal force on stick-slip behavior is analyzed. In Section 5, the mathematical model is established,based on the experimental analysis. Then the stick-slip friction behavior is simulated by considering the stress distribution evolution. Finally,Section 6 provides conclusions.
2. Experiment of stick-slip considering the stress distribution variation
2.1. Specimens and experimental apparatus
The visualized contact area is formed by the contact of an isotropic rough surface and a smooth surface. Under the coupling action of normal force and tangential force, the distribution of real contact area on the interface changes, which leads to the change of stress distribution on the interface, as shown in Fig.1(a). The isotropic rough surface is on the specimen 1,and its roughness(Sq)is 3.024 μm. The smooth surface is on the specimen 2,and its roughness(Sq)is 0.002 μm.Specifically,the smooth surface is polished by the 1600 mesh sandpaper. Specimen 1 is a boss structure cut from the whole PMMA block. The lengthx,widthyand heightzof the boss structure are 9 mm,9 mm and 4 mm,respectively,as shown in Fig.1(b).Specimen 2 is a transparent glass block with the size of 30 mm (x), 30 mm (y) and 70 mm (z). Because specimen 1 is fixed, the contact area of the interface always changes in a certain space during the stick-slip process, which is different from Rubinstein’s stick-slip experiment.[5,6]Based on the principle of total reflection, the image of contact area can be collected. It should be noted that the change of micro contact image in space and time has a strong regularity in this experiment,which is convenient to analyze the internal mechanism of stick slip.
The experimental apparatus shown in Fig. 2 consists of specimens, normal loading device, tangential loading device,three-dimensional force sensor,optical fiber sensor and angle adjuster,etc. Specimen 1,angle adjuster 1 and upper platform are connected by bolts in turn. The upper platform is fixed on the base by 8 steel rods with a diameter of 20 mm. The contact angle of specimen 1 can be adjusted by angle adjuster 1 (range 20°, resolution 0.005°), which is to simulate different normal stress distribution. Specimen 2, angle adjuster 2,three-dimensional force sensor,tangential loading device and normal loading device are fixed with bolts in turn. The contact angle of specimen 2 can be adjusted by angle adjuster 2(range 10°,resolution 0.08°),which is to ensure that the contact surface is level. Normal loading device (stroke 25 mm, resolution 0.6 μm, maximum load 800 N) is to realize the normal loading of interface at submicron level. Tangential loading device(stroke 200 mm,resolution 0.32 μm)drives the specimen 2 to move along thexdirection. MTI2100+RS2032R probe(range 74 μm,resolution 0.019 μm)is used for measuring the left side displacementD1of the boss and the right side displacementD2of specimen 1. The difference betweenD1andD2is taken as the relative displacementδof the interface. The tangential forceFtand the normal forceFnof the interface are measured by a three-dimensional force sensor.
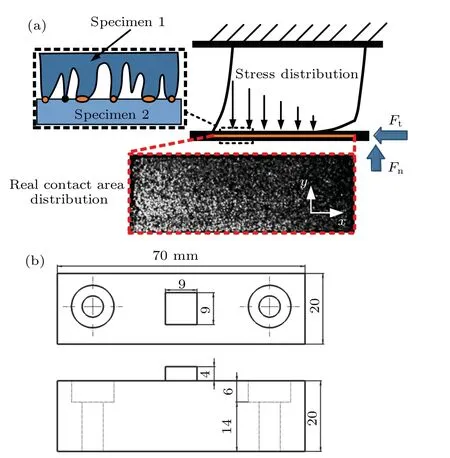
Fig.1. Contact interface and specimen. (a)Interface stress distribution and contact area distribution. (b)Size of specimen 1;(upper)top view;(lower)front view.

Fig.2. Picture of experimental apparatus.
First,the specimen surface is cleaned by the acetone and an ultrasonic cleaning machine. Then the specimen is cleaned by the ethanol and dried naturally. Finally, the specimen is installed in the experimental apparatus. Driven by the normal loading device, specimens 1 and 2 contact and form contact spots on the interface. Referring to Rubinstein’s method,[5,6]we first let the normal load be higher than the predetermined value and then be unloaded to the predetermined value,which can reduce the influence of aging on the experiment as much as possible. Driven by the tangential loading device,the stickslip motion of specimen 1 occurs at a slower speed relative to specimen 2. The signal acquisition instrument records the values ofFt,Fn,D1andD2at frequency of 1024 Hz. At the same time, the camera collects the contact area image at the frequency of 60 Hz. All the experiments are carried out in an air-conditioned room with a temperature of 22°C and a humidity of 30%.
2.2. Repeatability analysis
First, a normal force of 500 N is applied to the contact surface, and then unloaded. The above process is repeated three times, which is called the normal loading repeatability experiment (NLRE). To eliminate the influence of aging, the time interval of two consecutive experiments is 60 s.Then,the normal force is set to 300 N,and the tangential loading device drives specimen 2 to move along thexdirection at the speed of 1.3 μm/s.At the end of the experiment,specimen 2 returned to its original position. The above process is also repeated three times, which is called the tangential loading repeatability experiment(TLRE).After all the experiments are completed,we can obtain the intensity matrixI(x,y,t)of gray image of each frame in the video,xandydenote the positions of pixels in the matrix. Therefore,the intensityIsum(t)of contact image at timetis expressed as
wheremandndenote the row size and column size of the image intensity matrix,respectively. Figure 3(a)shows the time history curve ofIsum(t)during loading. In the NLRE,the relative error of maximumIsum(t)is less than 1.31%,which means that the experiment has good repeatability. When the normal force is less than 300 N,the relationship betweenIsum(t)and normal force is approximately linear,such as the purple line in Fig.3(a). The relative error of linear fitting is less than 5.6%in the TLRE. Especially, Rubinstein and others usually usedIsum(t)to quantitatively evaluate the real contact area.[10]Figure 3(b) shows the time history of the tangential force in the tangential loading repeatability experiment. The relative error of the maximum tangential force is 3.56%, which means that the experiment has good repeatability. The good repeatability of the experiment provides a basis to study the evolution of contact state in the process of stick slip using the change of contact image.

Fig. 3. Repeatability experiment: (a) normal loading repeatability experiment,(b)tangential loading repeatability experiment.
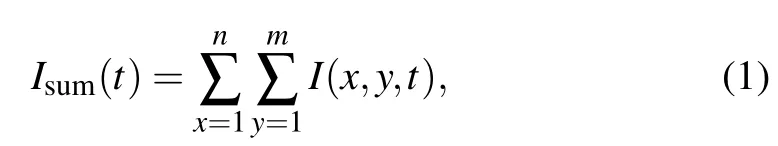
The power spectral density is used for evaluating surface morphology before and after the experiment, and the internal mechanism of the experiment repeatability is also analyzed.The surface morphology of specimen 1 before and after the experiment is scanned by white light interferometer.Figures 4(a)and 4(b)show that the surface roughness before and after the experiment changes from 3.024 μm to 3.982 μm. Figure 4(c)shows the probability distribution of surface height before and after the experiment. The increase of surface roughness after the experiment is due to the increase of the number of higher asperities. In all the stick-slip experiments in this study, the contact interface pressure is less than 8 MPa,far less than the yield strength of PMMA 100 MPa.[42]It is generally believed that elastic deformation occurs at the interface. However, by comparing the surface morphology before and after the experiment,we found that the interface had obvious plastic deformation. This may be due to the adhesion and interaction between the asperities at loading. Figure 4(d)shows the power spectral density(PSD)of the surface profile height before and after the experiment. The PSD of the low frequency part and the high frequency part changes before and after the experiment. However,when the spatial frequency is about 0.02-0.18 μm-1,the power spectrum curve is approximately equal before and after the experiment,as shown by the black dotted line in Fig.4(d).This shows that the contact surface changes little in this length range before and after the experiment.After multiple stick-slip motions,the plastic deformation of the contact surface occurs,and the power spectral density determining the spatial distribution of the contact area is basically stable, which is one of the reasons for the good repeatability of the experiment. It should be noted that this conclusion is convenient for us to use the same surface for comparative analysis when the number of experiment repetitions is less than 200.
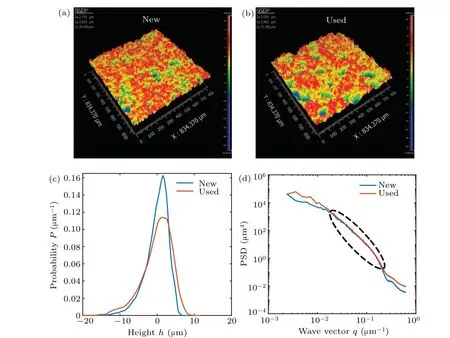
Fig. 4. Surface morphology before and after the experiment: (a) surface morphology before experiment, (b) the surface morphology after experiment, (c) the probability distribution of rough surface height before and after experiment, (d) power spectrum of rough surface before and after experiment.
3. Influence of tangential force on interface contact state in stick-slip process
3.1. Variation of contact parameters in stick slip
In stick-slip motion,the tangential force fluctuates in the positive direction.According to the fluctuation characteristics,it can be divided into initial stage and stable stage,as shown in Fig.5.In the initial stage,the tangential force increases gradually from 0 N.When the tangential force reaches the threshold of Coulomb friction,it decreases rapidly. Then,the tangential force fluctuates stably in a certain range. The process in which the tangential force increases slowly with time is called the stick, and the process in which the tangential force decreases rapidly is called the slip. In stick-slip motion, two important parameters,which are friction coefficient and tangential stiffness,need to be considered to predict the tangential force. In this paper,the ratio of the extreme value of the tangential force to the normal force is defined as the friction coefficient. It can be found that the friction coefficient of the interface is not a fixed value. The ratio of the threshold value to the normal force is called the maximum static friction coefficientμs,max.The ratio of the maximum tangential force to the normal force in the stable stage is called the static friction coefficientμs.The ratio of the minimum value to the normal force in the stable stage is called the kinetic friction coefficientμk. It is generally believed that the fluctuation of friction coefficient is one of the causes of stick-slip process. Scholars often simulate stick slip by settingμsandμk. It should be noted that the friction coefficientμsof the initial stage is larger than that of the stable stage due to the aging effect of the interface in our experiments.

Fig.5. Variation of tangential force with time in stick slip process.
The curve of tangential force changing with relative displacement between interfaces is shown in Fig.6(a). There are two characteristics of the curve in the initial stage and the stable stage. The slope of the curve is called the instantaneous stiffnessKI=ΔFt/Δδ. In the initial stage,the curve gradually bends and the instantaneous stiffness gradually decreases, as shown in Fig. 6(b). In the stable stage, the curve is approximately linear and the instantaneous stiffness is basically stable,as shown in Fig. 6(c). The slope of the initial linear stage of theithcycle curve is defined as the tangential stiffnessK(i)of the interface in theithcycle,as shown in Fig.6(d). The stable stageK(i)is almost equal, but the value in the initial stage is larger than that in the stable stage.
Fig.6. The relationship between tangential force and displacement in stick slip: (a)tangential force and relative displacement in whole stick slip process,(b)tangential force and relative displacement in the first cycle,(c)tangential force and relative displacement in the fifth cycle,(d)k(i)versus the number of cycles.
3.2. Evolution analysis of interface dynamic stress distribution
Because both the global and local contact image intensities have a good linear relationship with the normal force,[10]the change of the contact image intensity distribution is approximately consistent with the change of the real contact area distribution in the stick-slip process.It is found that the change of the contact area in the stick-slip process is mainly in thexdirection. The intensity distributionI(x,t)in thexdirection is obtained by summing the intensity of the contact image in theydirection,as shown below:

TheI(x,t)is used for characterizing the change of contact area distribution inxdirection.
If the real contact area linearly changes with the change of normal force, the distribution of contact area on the interface can approximately represent the distribution of interface stress. The equivalent stress distribution ¯P(x,t) along thexdirection of the interface is expressed as

The change of ¯P(x,t) during the stick-slip process is shown in Fig. 7(a), where the ordinate is the timet, the abscissa is the normalized lengthxof the contact area, 0 is the back end of the contact area,and 1 is the front end of the contact area. The intensity of the local contact area image represents the magnitude of the stress. The brighter the image of the local area is, the greater the stress is. With the increase of tangential force,the stress in the back end decreases gradually and then disappears, which indicates that the interface in this area is separated. The stress at the back end of the interface does not change obviously during the stick-slip process.It should be noted that the stress mutation occurs nearx=0.4-0.5,which is also found in Rubinstein’s experiment.[10]In the initial stage,the stress changes in a large range,but in the stable stage,the stress changes periodically in a small range. The change of stress distribution is consistent with the change of tangential force.
In the initial stage, ¯P(x,t) is calculated whenFtis 0 N,10 N, 20 N and 30 N, respectively, as shown in Fig. 7(b). In the stable stage, ¯P(x,t) is calculated whenFtis 33 N, 38 N and 43 N, respectively, as shown in Fig. 7(c). In the initial stage, it can be found that the stress distribution at the back end of interface decreases rapidly,but the change of the stress distribution at the front end of interface is small. In the stable stage, the stress distribution changes little in the whole interface. Combining Figs.6(b)and 6(c), we can find an interesting phenomenon,namely,when the stress distribution changes greatly, the instantaneous stiffness also changes greatly, on the contrary,the instantaneous stiffness is stable. This finding provides an experimental basis for us to improve the friction model considering the stress distribution.

Fig.7. The evolution of interface dynamic stress distribution is as follows: (a)evolution of ¯P(x,t)in the whole stick-slip process,(b)evolution of ¯P(x,t)in initial stage,(c)evolution of ¯P(x,t)with time in stable stage,(d)Im(i)versus number of cycles. Here x is the normalized length in the contact area.
It is generally believed that the tangential stiffness is positively correlated with the real contact area. To analyze the reason for the decrease of the tangential stiffness of the stable interface,the change of the image intensity is used for characterizing the change of the real contact area. Here the average valueIm(i)of the contact image intensity in the corresponding time is taken to calculate theK(i).Im(i)is called the average contact strength,
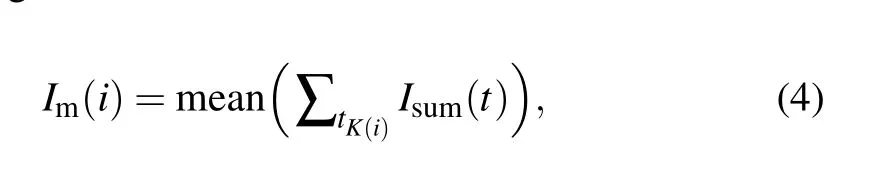
wheretK(i)is the time whenK(i)is calculated.Im(i)decreases with the increasing number of cycles,as shown in Fig.7(d).In the stable stage,the value ofIm(i)is almost unchanged. This is consistent with the change of tangential stiffnessK(i) in Fig. 6(d). Considering the positive correlation betweenIm(i)and the real contact area,we think that the decrease of the real contact area is one of the important reasons for the decrease of the tangential stiffness of the stable stage.
3.3. Evolution analysis of interface micro contact behavior
In our previous research,[46]an identification and quantitative analysis method of interface micro contact behavior is proposed. In this section, this method is used for analyzing the interface micro contact behavior in the stick-slip process.First, we let the tangential force increase fromFt,initoFt,fin,whereFt,prois betweenFt,iniandFt,fin. Meanwhile,the images with tangential forces ofFt,ini,Ft,proandFt,finare extracted,respectively, and the real contact spots in the three images are extracted by weighted filter superposition (WSM), and then these contact spots are superimposed together. In this paper,blue,green and red are used for representing the contact spots corresponding to the three tangential force. Here, sky blue,purple, yellow and black are used for representing different superposition combinations. The primary color superposition diagram (CSI) is drawn as shown in Fig. 8(a).[46]When the graphs of three kinds of tangential forces are superimposed together, different colors indicate different contact behaviors in the process of tangential force growth. Blue indicates that the initial contact point disappears, green indicates that the new contact point disappears with the increase of tangential force, sky blue indicates that the initial contact point grows and then disappears,and purple,yellow and black indicate that the contact area growth. Black means that the initial contact area grows and always exists. The above process is called the black region growth, which is the key to bear the normal and tangential forces and is of great significance for the evolution of interface contact behavior. By counting the number of colors in CSI,we can quantitatively analyze many micro contact behaviors of interface under a certain extent. By combining WSM and CSI, we realize the visual analysis of micro contact behavior under different loads, which is called the visual analysis method of contact behavior.
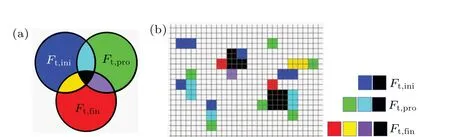
Fig.8. Visual analysis method of contact behavior: (a)principle of CSI,(b)CSI diagram of local contact area.
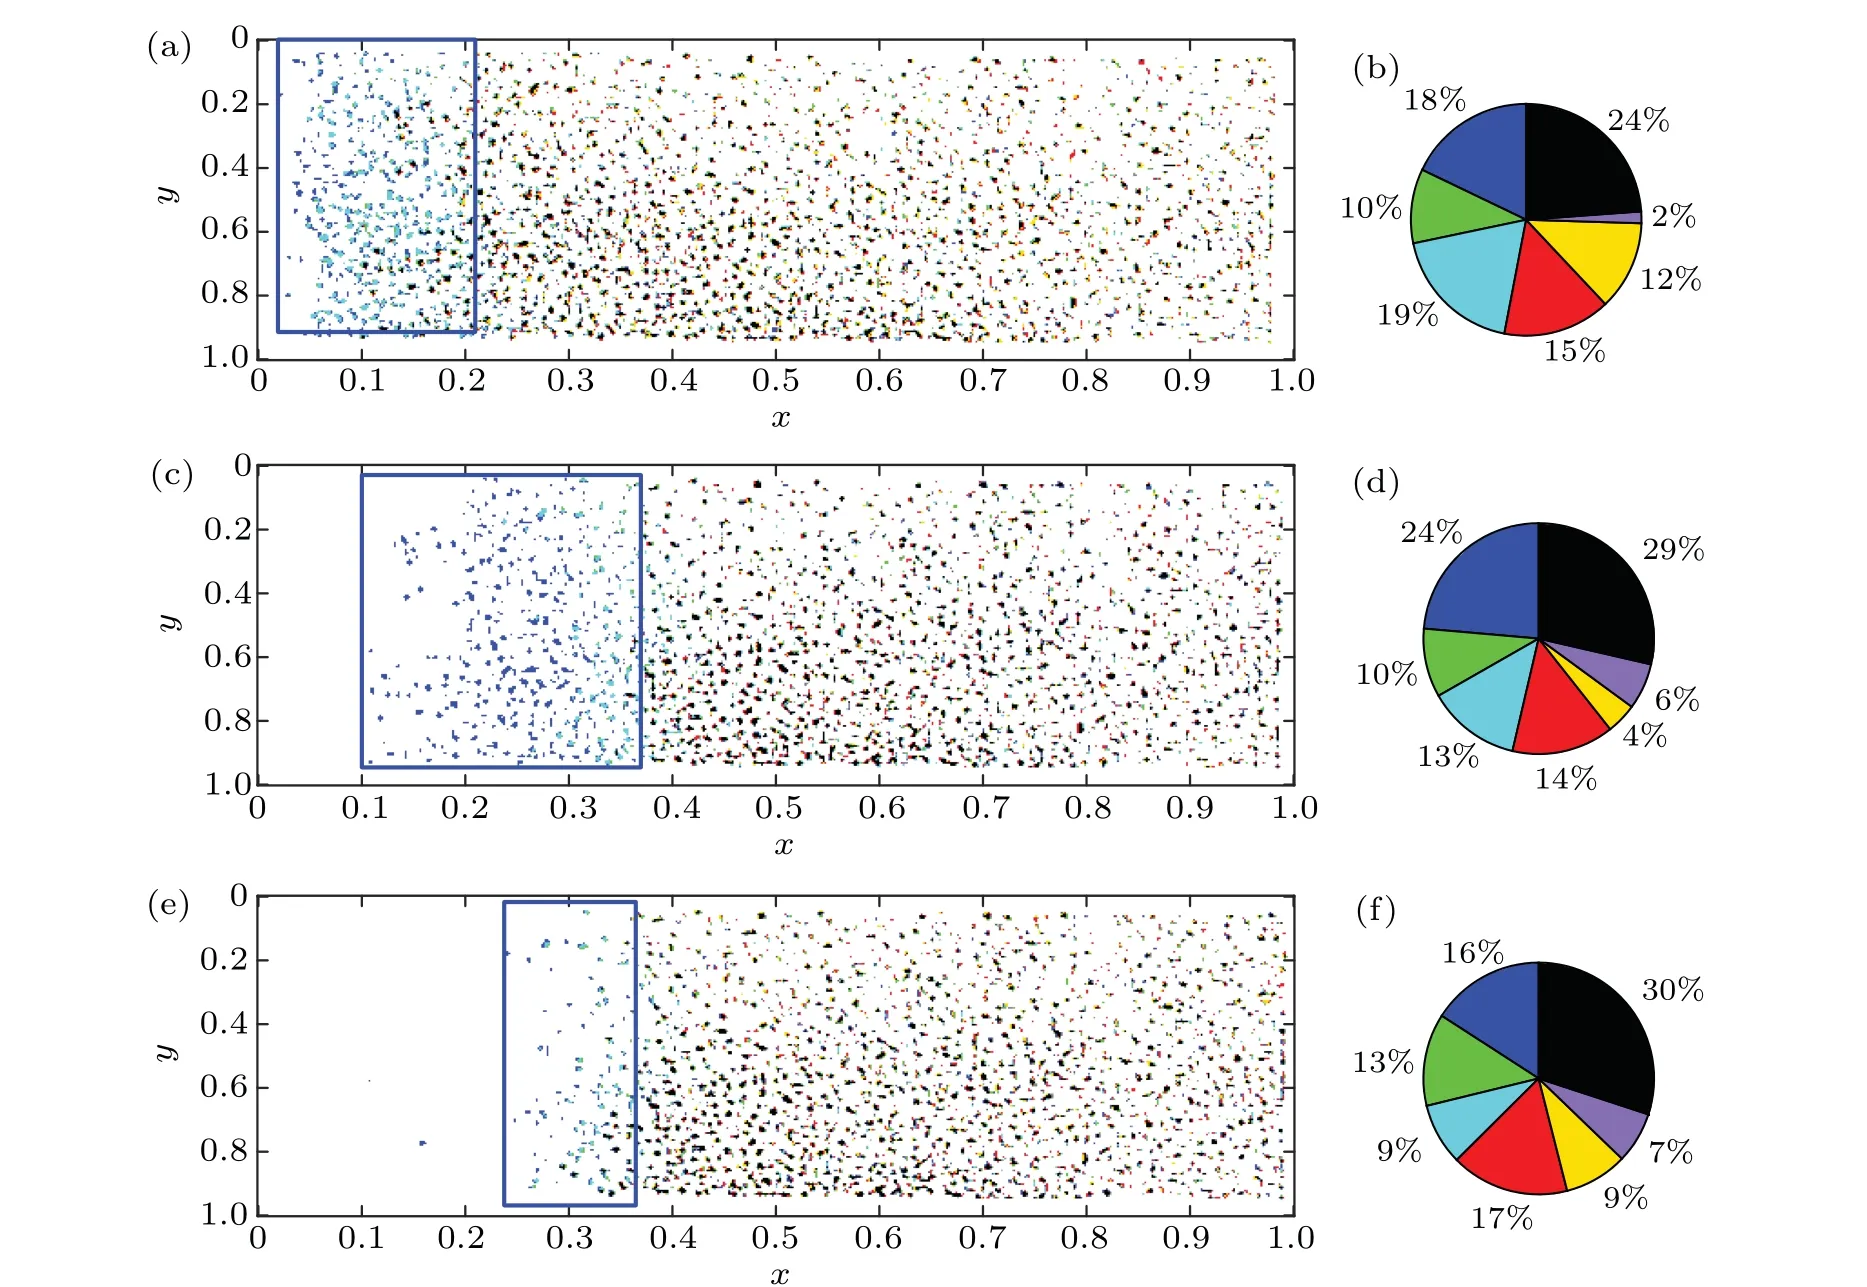
Fig. 9. Based on the CSI chart, the evolution of contact behavior in different stick-slip stages is characterized: (a) and (b) CSI of initial stage Ft,ini =0 N, Ft,pro =17 N and Ft,fin =25 N and their corresponding pie charts; (c) and (d) CSI of initial stage Ft,ini =25 N, Ft,pro =36 N and Ft,fin=47 N and their corresponding pie charts;(e)and(f)CSI of stable stage Ft,ini=32 N,Ft,pro=37 N and Ft,fin=42 N and their corresponding pie chart.
By drawing the CSI diagram, we analyze the evolution law of contact behavior in different stick-slip stages. First,we let the corresponding tangential forces of frames 254,938 and 1932 beFt,ini=0 N,Ft,pro=17 N andFt,fin=25 N, respectively.The CSI diagram is drawn,as shown in Fig.9(a),which shows the change of interface micro contact behavior when the tangential force in the initial stick-slip stage increases from 0 N to 25 N.Then,we let the corresponding tangential forces of frames 254,938 and 1932 beFt,ini=25 N,Ft,pro=36 N andFt,fin=47 N,respectively.The CSI diagram is drawn as shown in Fig. 9(c), which shows the change of interface micro contact behavior when the tangential force increases from 25 N to 47 N in the initial stick-slip stage. Next,the images of frames 3189, 3299 and 3563 in the video are extracted, and the tangential forces areFt,ini=32 N,Ft,pro=37 N andFt,fin=42 N,respectively. The CSI diagram is drawn as shown in Fig.9(e),which shows the change of micro contact behavior when the tangential force increases from 32 N to 42 N in the stable stickslip stage. The pie charts in Figs. 9(b), 9(d), and 9(f) show the proportion of micro contact behaviors corresponding to the three CSI diagrams.
With the increase of tangential force,the contact separation (blue frame) area increases gradually. The contact areas in Figs.9(c)and 9(e)are smaller than those in Fig.9(a),which indicates that the decrease of the real contact area is the reason for the decrease of the instantaneous tangential stiffness of the initial stage and the reason for the decrease of the interface tangential stiffness of the stable stage. Comparing Figs.9(b),9(d), and 9(f), we find that the increasing new contact point and region play a role in resisting the tangential force. When the tangential force increases, the proportion of black area growth(black proportion)in Figs.9(d)and 9(f)is greater than that in Fig.9(b),which indicates that the tangential force will lead to the increase of local stress and the increase of wear probability.
4. Influence of normal force on interface contact state in stick-slip process
4.1. Variation of contact parameters in stick-slip process
The normal forces of 150 N,175 N,200 N,250 N,300 N and 350 N are applied to carry out the subsequent research,respectively. In addition, the tangential loading device drives specimen 2 to move along thexdirection at the speed of 1.3 μm/s. Figure 10(a)shows the evolution of tangential force with time under different normal forces. The increase of normal force will lead to the decrease of tangential force fluctuation frequency.It should be noted that the stick-slip motion decreases gradually at 200 N,which may be caused by the large dry friction damping of elastic materials. With the continuing decrease of normal force,stick-slip motion disappears finally.Figure 10(b) shows the effect of normal force on the friction coefficient. It can be found that the maximum static friction coefficient is weakly related to the normal force,but in the stable stage,the kinetic friction coefficient and static friction coefficient increase with the increasing normal force. Therefore,the friction coefficient in the stable stage is positively related to the normal force in this experiment. Figure 10(c)shows the relationship between the tangential stiffness of the interface and the normal force. The tangential stiffness is positively related to the normal force,and its growth rate slows down with the increasing normal force, which is consistent with the experimental and theoretical analysis results of Raffaet al.[47,48]Here the above phenomenon is called the nonlinear characteristic of the tangential stiffness, which is closely related to the elastic-plastic deformation, structural deformation, strain hardening and other factors of interface. Figure 10(d) shows the change trend of tangential stiffness at different cycles. It can be found that the normal force mainly affects the tangential stiffness of the initial stage,but has little influence on the tangential stiffness of the stable stage.
4.2. Evolution analysis of interface dynamic stress distribution
In the initial stage, the equivalent stress distribution¯P(x,t)with tangential force of 20 N is first extracted,and the corresponding ¯P(x,t)with normal force of 150 N,250 N and 350 N is shown in Fig. 11(a). The change of stress distribution is positively related to the tangential stiffness of interface. Moreover,the larger the normal force is,the smaller the change of stress distribution is, and the larger the tangential stiffness of interface is. On the contrary, the interface stiffness decreases. The increase of tangential stiffness of interface mainly depends on the normal force which restrains the decreasing trend of stress distribution in the initial stage. In the stable stage, the equivalent stress distribution ¯P(x,t) at the maximum value ofFtis extracted, and the corresponding ¯P(x,t)with normal force of 150 N,175 N,200 N,250 N,300 N and 350 N is shown in Fig. 11(b). When the normal force increases,it mainly affects the change of stress distribution in the initial stage, and has little influence on the change of stress distribution in the stable stage. Using the method in Subsection 3.2,we calculate the corresponding ¯Im(1)when the normal forces are 150 N,175 N,200 N,250 N,300 N and 350 N,as shown in Fig.11(c). The average contact strength is related to the increasing normal force, and the change trend is consistent with the tangential stiffness of interface. Figure 11(d)shows the relationship between ¯Im(1)andK(1)under different normal forces. ¯Im(1) is positively related to the tangential stiffness of the interface. This shows that the increase of real contact area is the main reason for the increase of interface tangential stiffness with the increasing normal force.

Fig.10. The experimental results under different normal forces: (a)evolution of tangential force with time, (b)influence of normal force on friction coefficient,(c)K(1)versus normal force,(d)influence of normal force on K(i)versus number of cycles.
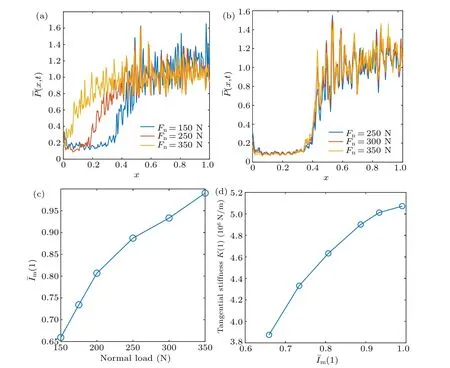
Fig.11. Evolution of interface dynamic stress distribution: (a)evolution of ¯P(x,t)with time at initial stage,(b)evolution of ¯P(x,t)with time at stable stage,(c) ¯Im(1)versus normal force,(d) ¯Im(1)versus K(1).
4.3. Evolution analysis of interface micro contact behavior
In the initial stage of stick slip,the contact images corresponding to the frame numbers of tangential forcesFt,ini=0 N,Ft,pro=10 N andFt,fin=20 N are extracted,and the CSI diagrams and pie diagrams of different normal forces are drawn,as shown in Fig.12. Comparing Figs.12(a),12(c)and 12(e),we can find that with the increase of load,the area of contact separation becomes obviously smaller, and the growth range of black area gradually expands, which is consistent with the conclusion in Subsection 4.2. The increase of normal force restrains the tendency of contact separation at the rear end,and further restrains the tendency of stress distribution decreasing.Comparing Figs.12(b),12(d)and 12(f),we find that with the increase of normal force,the proportion of black area growth gradually increases, which indicates that the local stress increases and the wear probability increases. It should be noted that when the normal force increases from 150 N to 250 N,the proportion of contact area increases, which indicates that the new contact points and area growth play an important role in resisting the interfacial shear force.However,when the normal force increases from 250 N to 350 N,the proportion of the contact area decreases, and the resistance to interfacial shear stress mainly depends on the growth of the area. To sum up,we believe that in the process of resisting the increase of tangential force, the new contact points mainly play a key role under light load. With the increase of normal force,the region growth will play a leading role,and the local stress of interface will also increase. This phenomenon explains why the probability of wear increases with the increasing normal force.
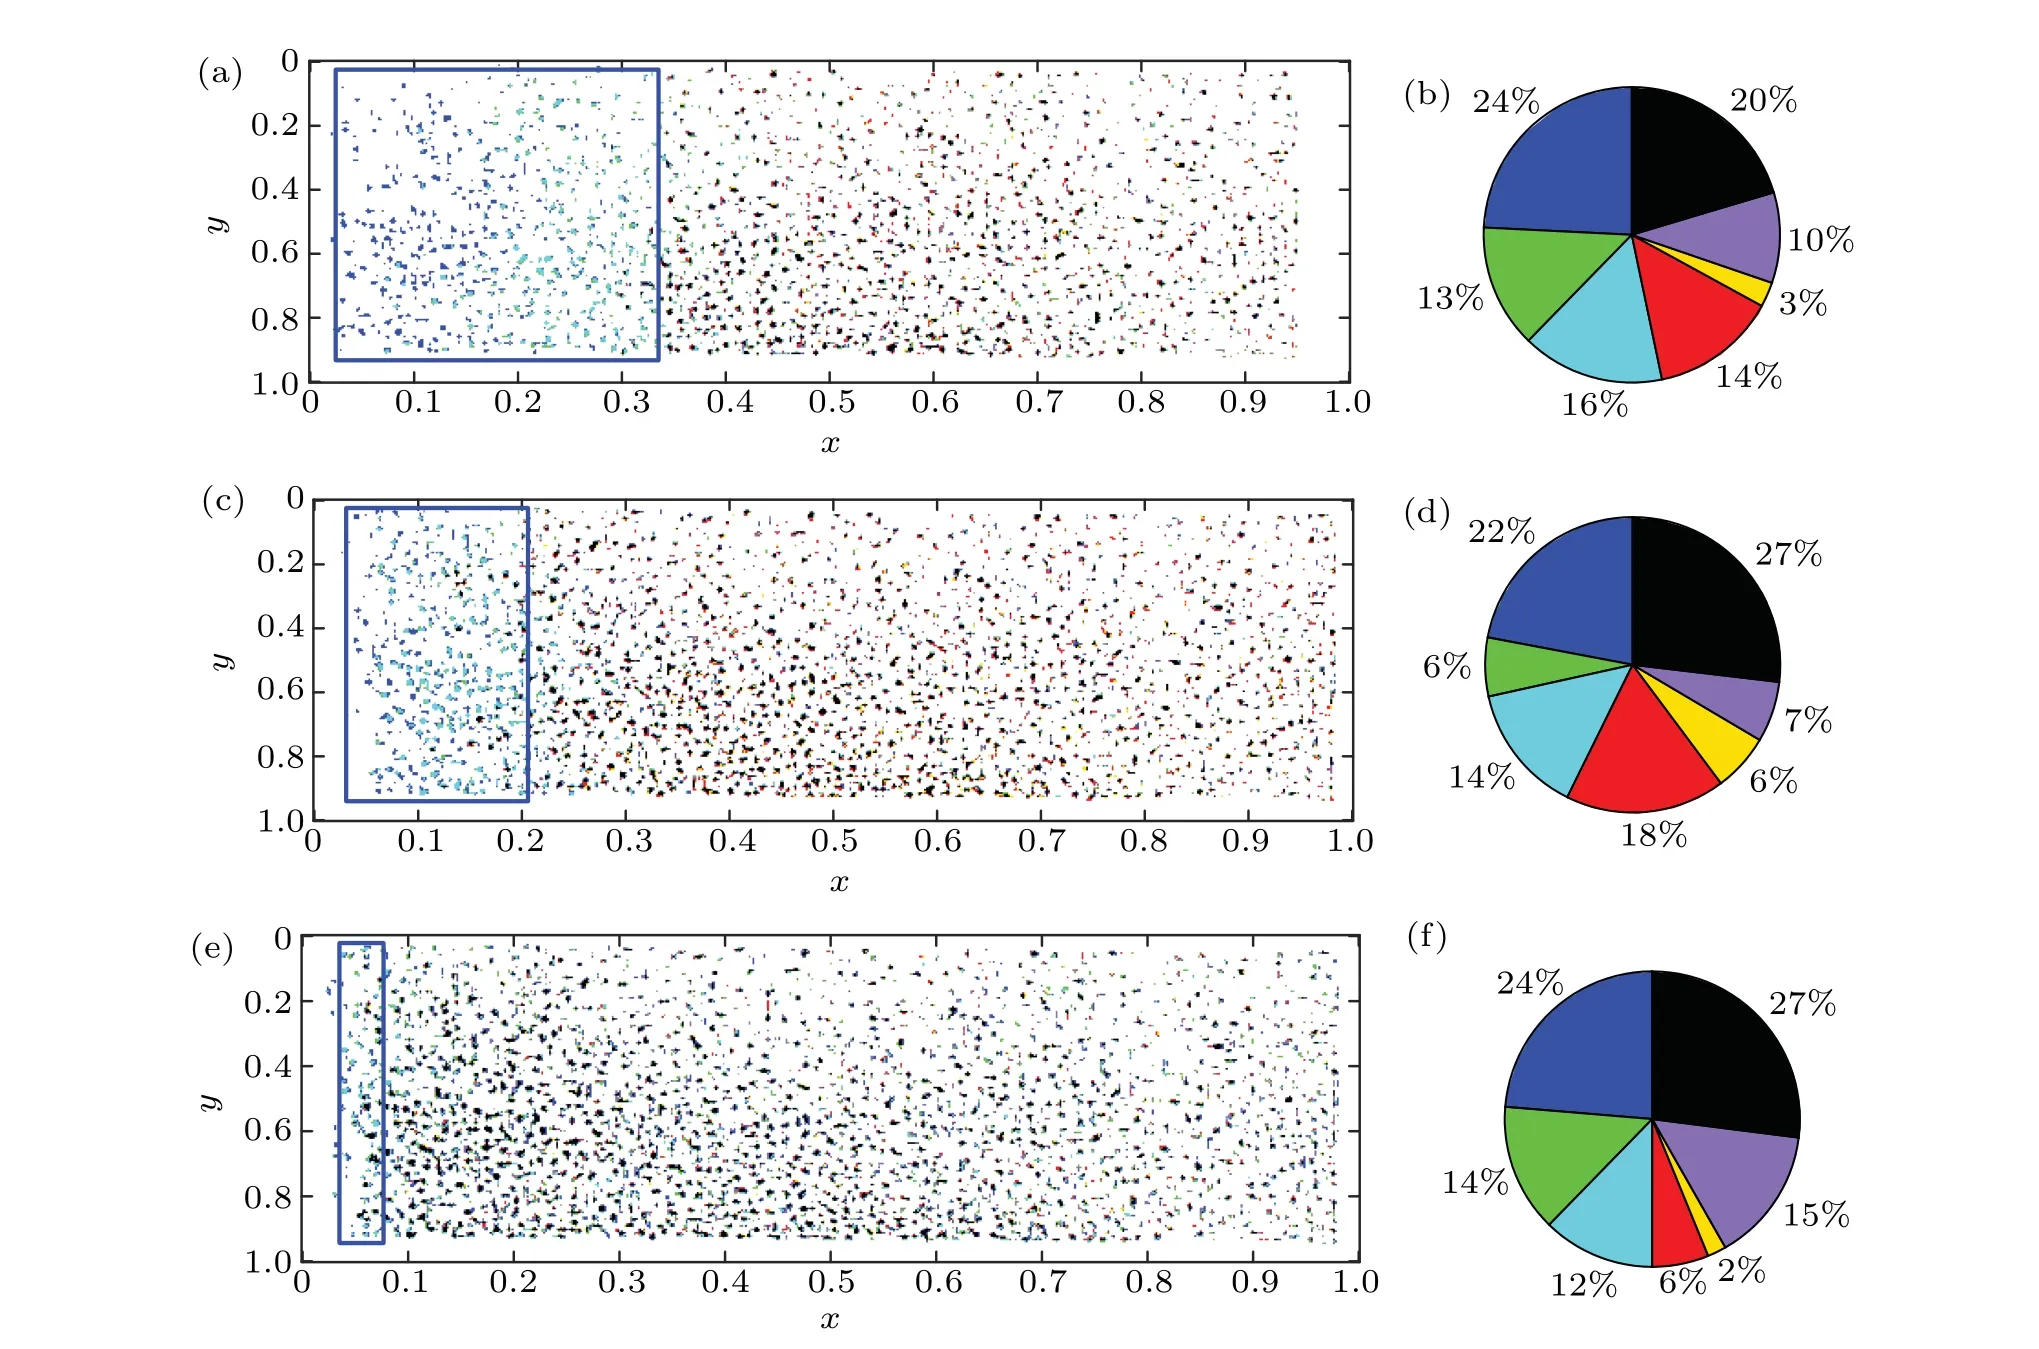
Fig.12. The real contact area evolves with time: (a)and(b)CSI and its pie chart of the initial phase when Fn=150 N;(c)and(d)CSI and its pie chart of the initial stage when Fn=250 N;(e)and(f)CSI and its pie chart of initial stage when Fn=350 N.
5. Stick-slip friction model considering stress distribution variation
5.1. Characterization method of stick slip behavior
At present, the spring-damping-mass units are generally used for describing the stick-slip mechanism. Although this method can well explain precursor events in the initial stage,[35-37]it cannot describe the whole stick-slip process completely.[35]On the one hand,the tangential stiffness in the initial stage is not necessarily constant. On the other hand,due to the difficulty of solving nonlinear dynamic equations,there are always large errors when the above model is used for describing the stable stage. Recently, more and more experiments and theories have found that the change of interface stress has a significant effect on the contact behavior. To simulate the stress distribution using the discrete mathematical model, the contact area is divided into 10 parts along thexdirection, and the intensity proportion of local contact image is calculated as the equivalent stress distribution ¯P(k,t),k=1,2,...,10. Figure 13(a)shows the equivalent stress distribution of the interface when the initial tangential forces are 0 N,27 N and 46 N,respectively. Figure 13(b)shows the relationship between tangential force and displacement of the initial stage. The range of stress distribution in the initial stage is large,and the instantaneous stiffness(curve slope)decreases gradually.Figure 13(c)shows the relationship between the tangential force and displacement of the stable stage, and Fig.13(d)shows the equivalent stress distribution of the interface when the tangential force of the stable stage is 31 N,36 N and 42 N,respectively. The change range of stress distribution in the stable stage is small, and the corresponding instantaneous stiffness is basically unchanged. This shows that the instantaneous stiffness is very sensitive to the change of stress distribution. Then, the tangential force curve for the stickstage process is divided into 10 equally spaced intervals, as shown in Figs. 13(b) and 13(d). Two equivalent stress distribution functions can be used for describing the different characteristics of the tangential force in the initial and stable stage.The concrete form of the equivalent stress distribution function will be explained in the next section.
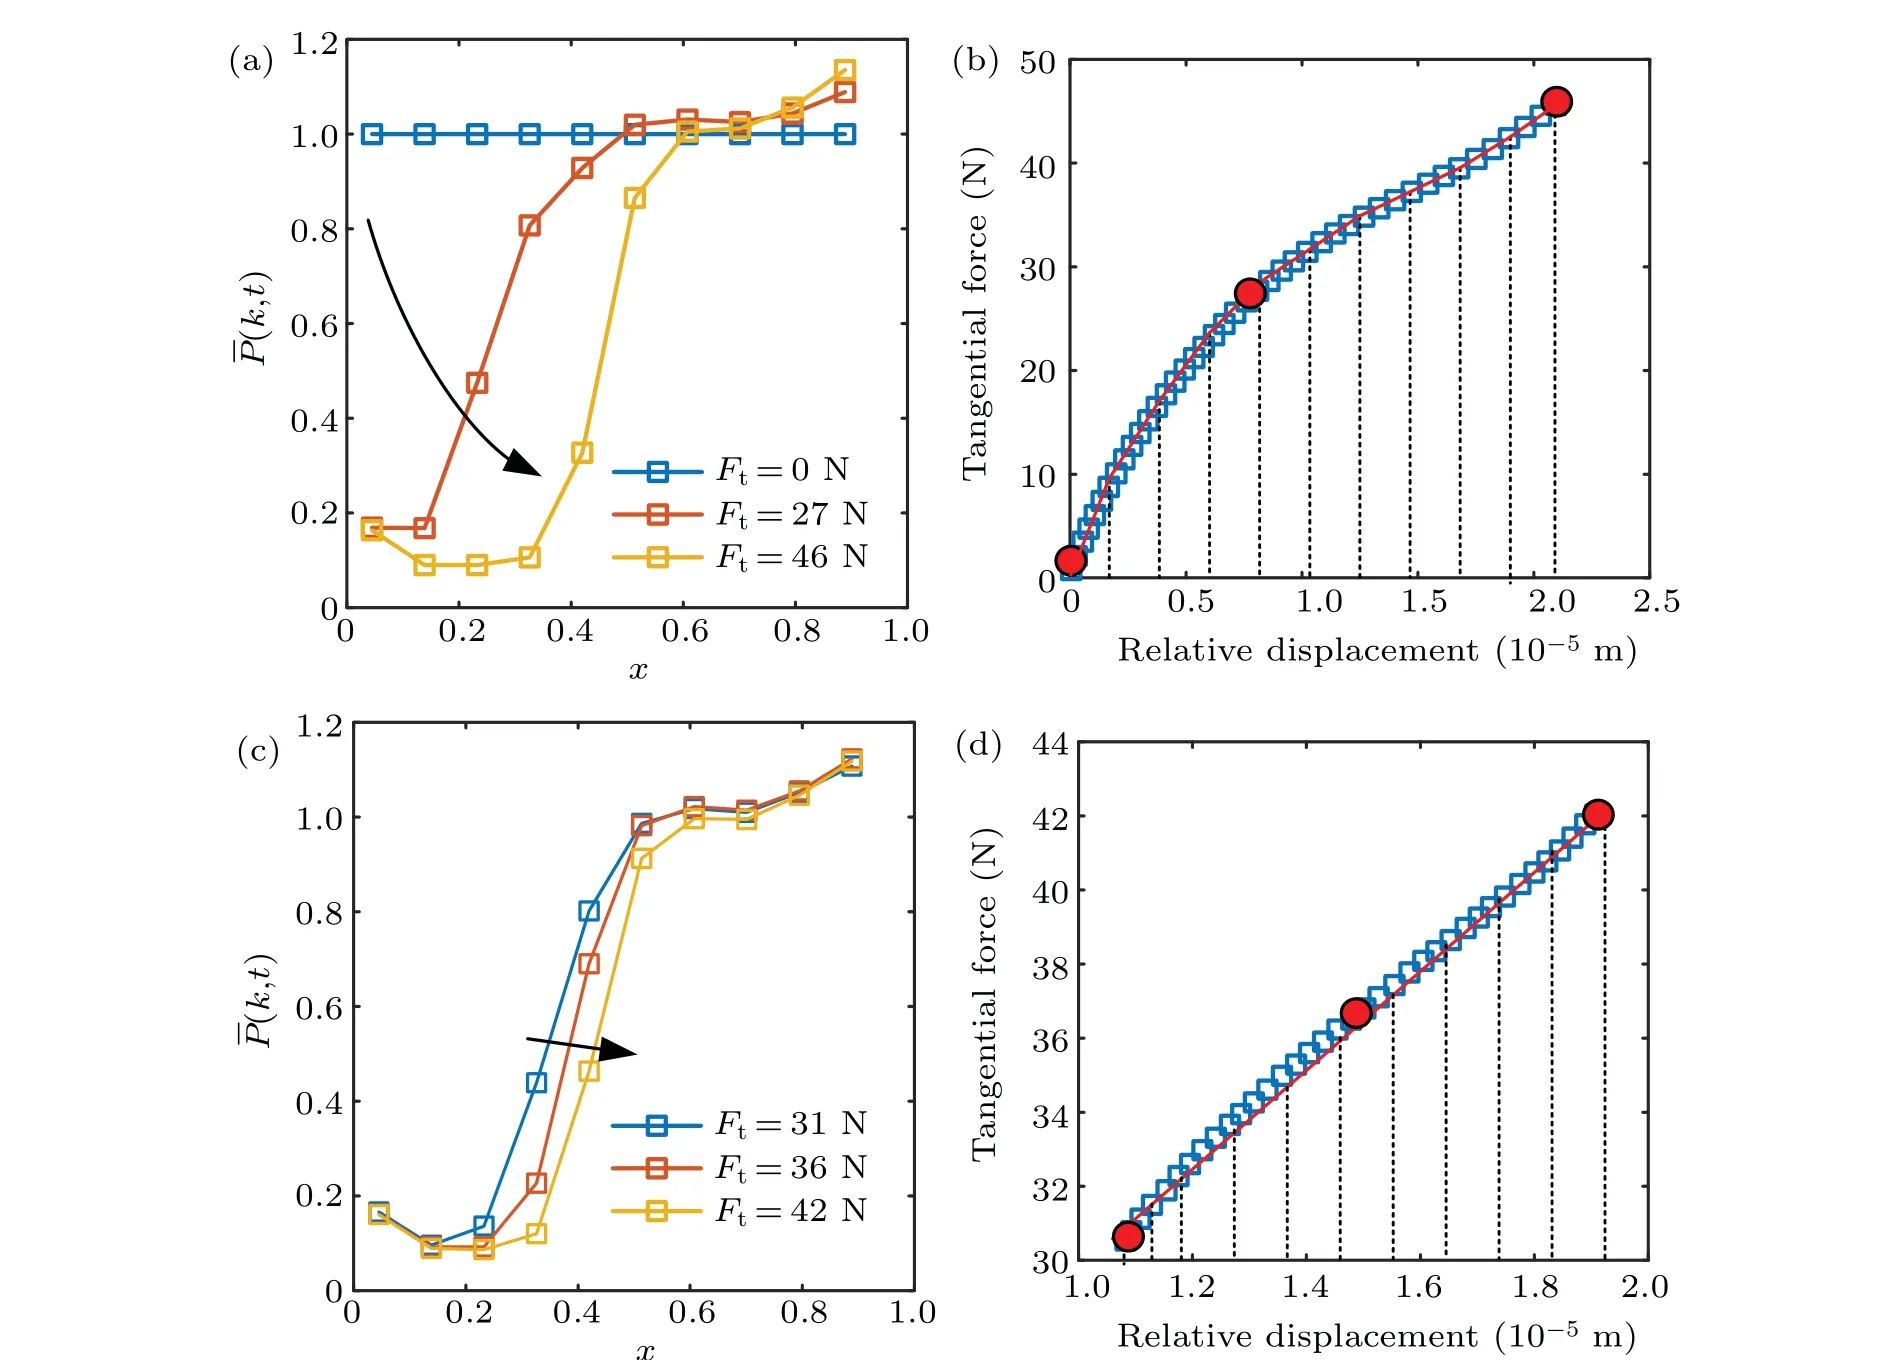
Fig.13. The relationship between the stress distribution and stick slip behavior: (a) ¯P(k,t)at the initial stage,when the tangential forces are 0 N,27 N and 46 N,respectively;(b)tangential force versus displacement in the initial stage;(c) ¯P(k,t)at the initial stage when the tangential forces are 31 N,36 N and 42 N,respectively;(d)tangential force versus displacement in the stable stage.
5.2. Mathematical model of stick-slip behavior considering stress distribution variation
The mathematical model of stick-slip behavior considering the stress distribution variation is shown in Fig. 14. The model consists of two parts:driving unit and contact unit. The driving unit includes an external pointD0with a velocityv,a spring and a damping betweenD0and the contact unit,where the spring stiffness isK0and the damping coefficient isC0.The contact element consists of specimen 1, specimen 2 and contact interface,and specimens 1 and 2 are regarded as rigid bodies here.The contact behavior is simulated by a contact interface composed ofNJenkins elements.NJenkins elements simulate the local normal and tangential forces exerted on the local area,andwiis the normal force exerted on theithJenkins element. Each Jenkins element is composed of normal spring and tangential spring with stiffnessknandkt,respectively,and damping sliderDiwith coefficientτiin series,whereτiis the critical friction. In this model, we assume thatknandktare mutually independent. Here,yiis the compression of the normal spring under the action ofwi, andxiandfiare the displacement and friction ofDi,respectively.
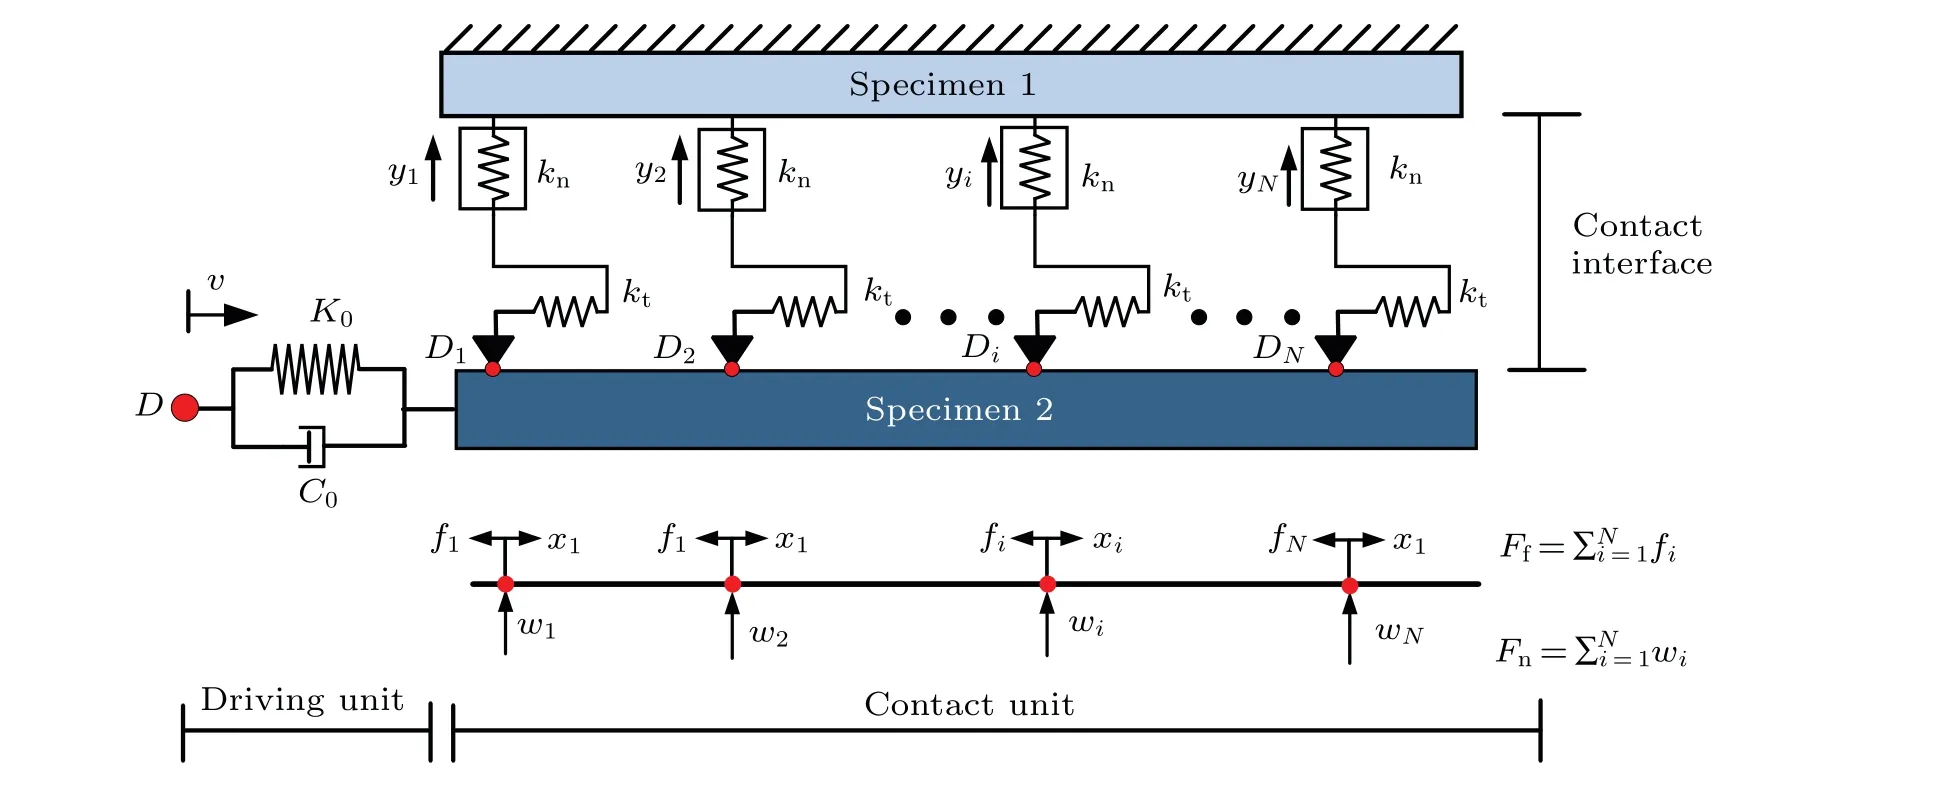
Fig.14. The mathematical model of stick-slip friction considering stress distribution.
The frictionFtof the interface is the sum of the frictionfiof allDi,

whereP(i) is the equivalent stress distribution function,Plinear(i) denotes theP(i) in the initial stage, andPuniform(i)denotes theP(i)in the stable stage;μis the friction coefficient of the interface,which is related to the interface motion state.The friction coefficient is the maximum static frictionμsmaxin the initial stage. In the stable stage, the friction coefficient is divided into static friction coefficientμsand kinetic friction coefficientμkaccording to the two states of stick and slip. According to the different states of the initial stage and the stable stage,the tangential stiffnessKtof the interface is divided into the tangential stiffnessKt0of the initial stage and the tangential stiffnessKtsof the stable stage,and the frictionfiat pointDiis also expressed in the following:
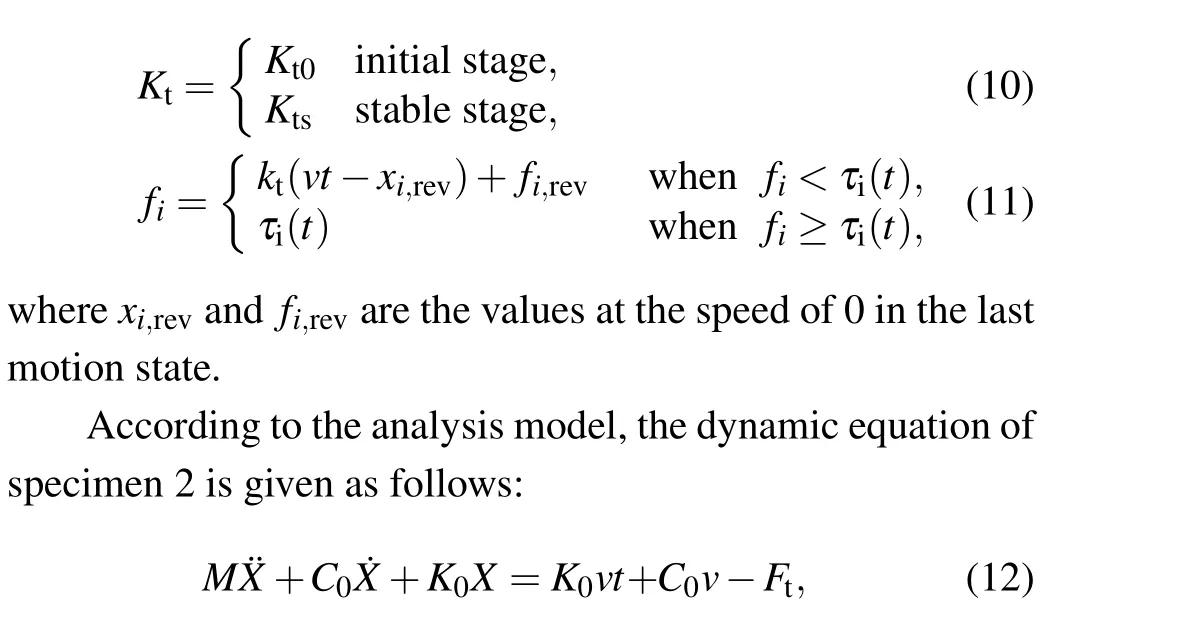
whereX, ˙Xand ¨Xdenote the displacement, velocity and acceleration of specimen 2,respectively.Mdenotes the mass of specimen 2.
5.3. Calculation process and experimental verification
The parameters to be identified in the model include the numberNof Jenkins elements, the massMof specimen 2,the driving speedv,the driving stiffnessK0,the driving dampingC0,the tangential stiffnessKt,the maximum static friction coefficientμs,max,the kinetic friction coefficientμk,the static friction coefficientμs,and the normal forceFn. In this experiment,PlinearandPuniformrepresent the equivalent stress distribution functions of the initial and stable stage of stick slip,respectively,and they can be adjusted according to the experimental conditions. According to formula(11),the frictionfiofDiat timetcan be calculated,and the tangential forceFtof the interface at timetis obtained by summation. The ode45 solver is used for solving the nonlinear equation,and the displacementxiof each element at the next time is obtained. The above steps should be repeated until the end of the calculation.
Here the experiment in Subsection 3.1 is taken as an example to illustrate our calculation method.Through parameter identification,the interface parameters are obtained as follows:Fn=300 N,v=1×10⁻⁵m/s,M=0.048 Kg,C0=4 N·s/m,K0=1.475×106N/m,Kts=0.9×106N/m,μsmax=0.2,μs= 0.15,μk= 0.1. The calculation results of tangential force are compared with the experimental data, as shown in Fig. 15. The model can describe the process that the instantaneous tangential stiffness gradually decreases in the initial stick-slip stage, and can also characterize the characteristic that the tangential stiffness is smaller than the initial stage in the stable stage,which is basically consistent with the experimental results.
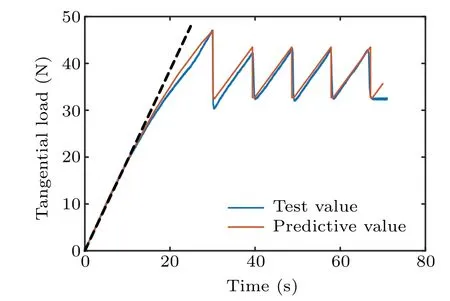
Fig.15. Verification of simulation results.
6. Conclusion
By using the experimental apparatus of friction behavior based on total reflection principle, we carry out the experimental research about the stick-slip friction contact behavior.Moreover, the corresponding theoretical analysis is also carried out. Especially,the above works consider the influence of stress distribution variation. Then, the following conclusions are obtained.
(1)The tangential stiffness of the interface is not a fixed value during the stick-slip process. The change mode of tangential stiffness is different for the different stages. In the initial stage, the instantaneous tangential stiffness decreases gradually. In the stable stage, the instantaneous stiffness is relatively stable.
(2) The change of tangential stiffness is consistent with that of stress distribution.When the stress distribution changes greatly, the instantaneous stiffness also changes greatly. On the contrary,the instantaneous stiffness is relatively stable.
(3)The increase of tangential stiffness of interface mainly depends on the normal force which restrains the decreasing trend of stress distribution in the initial section. The average contact strength is positively related to the tangential stiffness of the interface,and the increase of the real contact area is the main reason for the increase of the tangential stiffness with the increasing normal force.
(4) The mathematical model of stick-slip behavior considering the stress distribution variation can describe the process of gradual decrease of instantaneous tangential stiffness in the initial stick-slip stage. Furthermore, the above model can also characterize the characteristic that the tangential stiffness in the initial stage is larger than that in the stable stage.The simulation results of our model are in good agreement with the experiment data.
All analysis results illustrate that the stress distribution is an important factor affecting the tangential stiffness of the interface. The model in this paper is based on the experimental analysis of the interface contact type of the experimental device. The model can be used to analyze the nonlinear change of contact parameters caused by the change of stress distribution. Considering the change of stress distribution is of great significance to improve the accuracy of friction prediction. Next, we will consider the contact angle and contact morphology of the interface to further analyze the influence of stress distribution variation on the tangential stiffness of the interface. It should be noted that the above conclusions are obtained from the experimental analysis of the specific interface contact type of this experimental apparatus. The interface contact is a complex multi-physical behavior. When the contact conditions change,the contact characteristics may also change, and even the opposite conclusion may be obtained.Therefore,the complex“black box”behavior in interface contact mechanics needs to be further explored.
Acknowledgements
Project supported by the National Natural Science Foundation of China(Grant No.11872033)and the Beijing Natural Science Foundation,China(Grant No.3172017).
猜你喜欢
Chinese Physics B(2022年10期)2022-10-26
Chinese Physics B(2022年8期)2022-08-31
财会月刊·下半月(2022年4期)2022-04-25
中学生博览·文艺憩(2021年12期)2021-12-21
中学生博览(2021年9期)2021-05-18
投资与理财(2018年10期)2018-10-18
文理导航·阅读与作文(2015年8期)2015-10-10
妇女生活(2015年5期)2015-09-10
中国周刊(2014年5期)2014-05-15
故事会(2007年9期)2007-05-14

- Chinese Physics B的其它文章
- Measurements of the 107Ag neutron capture cross sections with pulse height weighting technique at the CSNS Back-n facility
- Measuring Loschmidt echo via Floquet engineering in superconducting circuits
- Electronic structure and spin-orbit coupling in ternary transition metal chalcogenides Cu2TlX2(X =Se,Te)
- Characterization of the N-polar GaN film grown on C-plane sapphire and misoriented C-plane sapphire substrates by MOCVD
- Review on typical applications and computational optimizations based on semiclassical methods in strong-field physics
- Quantum partial least squares regression algorithm for multiple correlation problem