
A novel car-following model by sharing cooperative information transmission delayed effect under V2X environment and its additional energy consumption
2022-05-16 07:12GuangHanPeng彭光含TeTiJia贾特提HuaKuang邝华HuiLiTan谭惠丽andTaoChen陈陶
Chinese Physics B 2022年5期
Guang-Han Peng(彭光含) Te-Ti Jia(贾特提) Hua Kuang(邝华)Hui-Li Tan(谭惠丽) and Tao Chen(陈陶)
1College of Physical Science and Technology,Guangxi Normal University,Guilin 541004,China 2Boyuan Scientific Instruments(Zhenjiang)Co.,Ltd,Zhenjiang 212003,China
Keywords: traffic flow,car-following model,additional energy consumption
1. Introduction
With the improvement of people’s living standards, the speed of road construction is far lower than the growth rate of vehicles,which leads to increasingly worse traffic conditions,traffic congestion, and traffic safety problems. As the above traffic situation is becoming more and more serious, scholars have advanced many traffic models to analyze traffic behaviors and solve traffic congestion from different perspectives. Then,there have occurred the car-following models,[1–9]cellular automata models,[10–15]and lattice hydrodynamic models.[16–22]Among them, the optimal velocity(OV)model[3]is a classic car-following model. However, the OV model has some defects such as exorbitant acceleration and deceleration. Thereafter, Helbing and Tilch[23]brought forward a generalized force(GF)model. They used the vehicle tracking data to calibrate the OV model, solving the problems in the OV model.But the GF model cannot describe the delayed time and startup velocity in real traffic. Afterwards, Jianget al.[24]established a full velocity difference (FVD) model in regard of the difference between positive velocity and negative velocity,which made up for the defects of GF model. The research on the car-following model is still in-depth with the efforts of many scholars, who have made great contributions to the development of traffic flow.
More importantly,with the popularization of vehicle to X(V2X) communications technology, drivers can acquire traffic information such as the position and speed of surrounding themselves,as well as the average headway of vehicles from a macro perspective. Therefore, under V2X environment, realtime traffic data can be used to guide drivers to adjust their driving behavior. Backfriederet al.[25]used V2X communication to detect,predict and solve traffic congestion problems.Zhanget al.[26]provided a comprehensive framework based on the V2X technology and built an unusual model to detect the driving behaviors on different roads.Maet al.[27]proposed a traffic control system for ring roads under the V2X environment.Penget al.[28]raised a CM car-following model by integrating the estimated optimal speed effect under the V2X environment. With the spread of 5G,the V2X technology could play a greater role in conveying the delayed information including headway and velocity.
Therefore,a novel car-following model in this paper is established by sharing cooperative information transmission delayed(CITD)effect covering headway and velocity of the current vehicle under the V2X environment.The rest of this paper is organized as follows.In Section 2,we will list some existing models about the delay feedback control in the field of traffic flow and explain the construction logic of the new model. The linear stability analysis and nonlinear stability analysis will be studied in Sections 3 and 4. The content of Section 5 is the numerical simulation, which includes the headway distribution and the hysteresis loop. In particular, the additional energy consumption is further studied with the consideration of the CITD effect. Finally,in Section 6,the corresponding conclusions are drawn.
2. Extended car-following model
The OV model is a classic car-following model put forward by Bandoet al.,[3]and its motion equation is shown below:
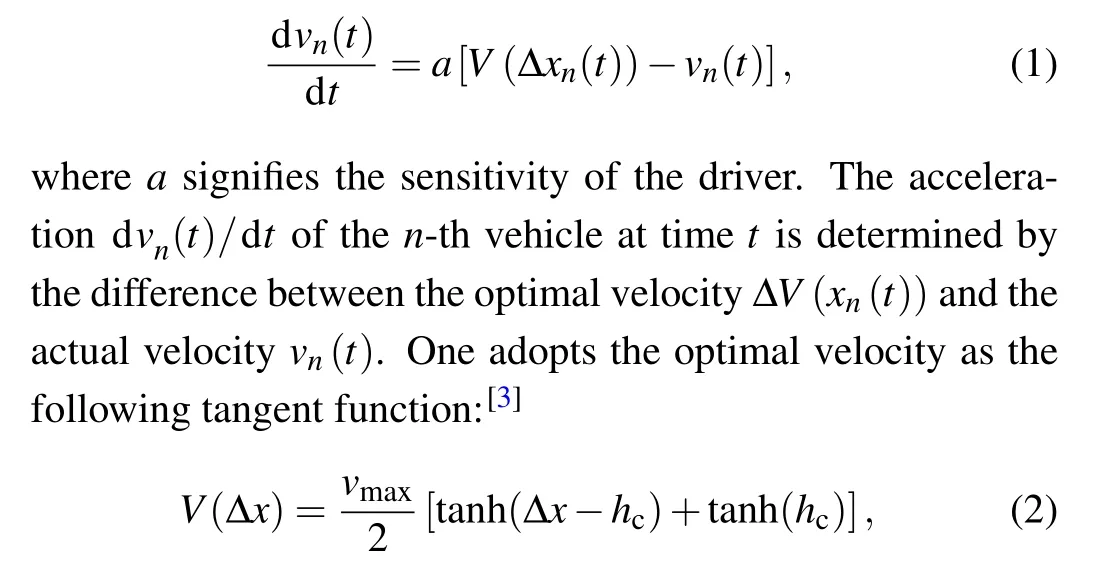
wherehcrepresents the safe distance andvmaxmeans the maximum velocity.
In recent years,the research and application of time-delay feedback control technology in the field of traffic flow have attracted the attention of some scholars.[29–43]In 2011, Ge[29]advanced a modified CM car-following model and its delayed feedback control scheme. In 2013, Jin and Hu[30]introduced a delayed feedback control of displacement and velocity difference based on the OV model. Wanget al.[33]presented a lattice model for the current lattice flow difference delay feedback control. Penget al.[34]built a lattice model via considering the effect of historical density differences. Kaur and Sharma[36]put forward a feedback control model with transitive delay. Zhanget al.[39]raised an extended car-following model in which the continuous self-delay velocity of multiple preceding vehicles was taken into account. Jin and Meng[40]put forward an extended OV model with time-delay feedback control. Liet al.[41]studied an improved car-following model in view of electronic throttle dynamics and the delay of velocity difference. Guanet al.[42]offered a bifurcation control method based on the expected effect and response delay feedback. Recently, Liet al.[43]developed a car-following model by considering the influence of the historical velocity on traffic.Scholars realize that the time-delayed feedback control has great significance and engineering application value in transportation system.
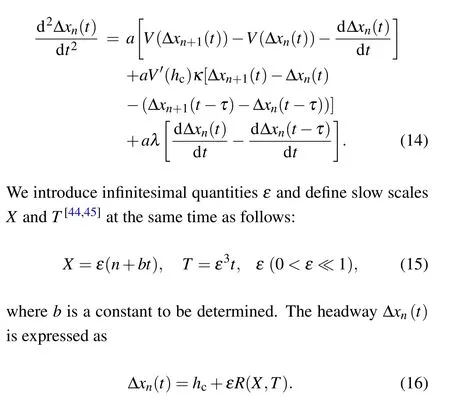
Generally, the driving state of the vehicle in the carfollowing model is often determined by two important factors, namely, vehicle’s headway and velocity, which have a significant influence on subsequent traffic evolution. But the previous models did not consider the CITD effect involving the headway and velocity. Therefore,a patulous car-following model is taken by sharing the CITD effect as whereκ(Δxn(t)-Δxn(t-τ)) andλ[vn(t)-vn(t-τ)] express the delayed effect of headway and velocity,respectively;κandλare the control parameters correspondingly;τis the delayed time which is equal to the inverse ofa. And the new model recovers to the OV model ifκandλare 0. Then, we compare new model with the OV model through theoretical analysis and numerical simulation.

3. Stability analysis
In order to facilitate the subsequent linear analysis, the new model is treated linearly. Using Taylor expansion,we can write the optimal velocity term in Eq.(3)as follows:
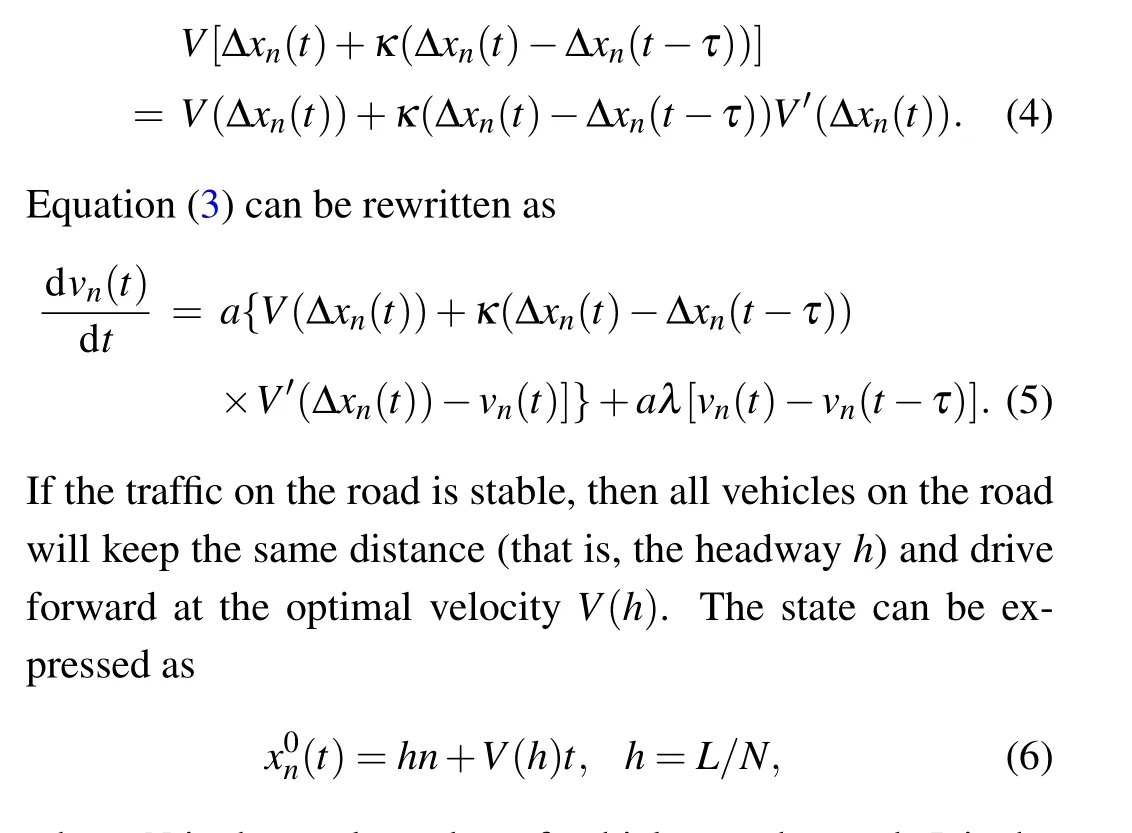
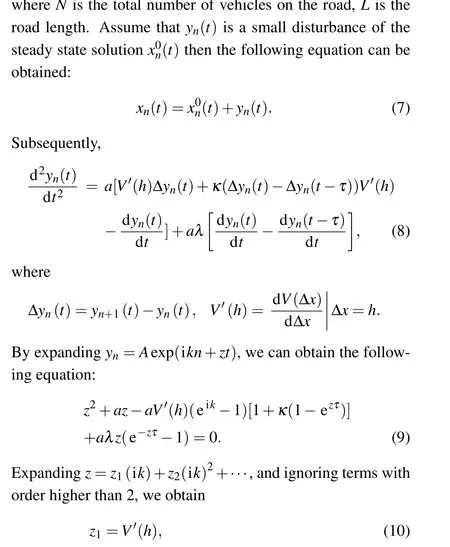
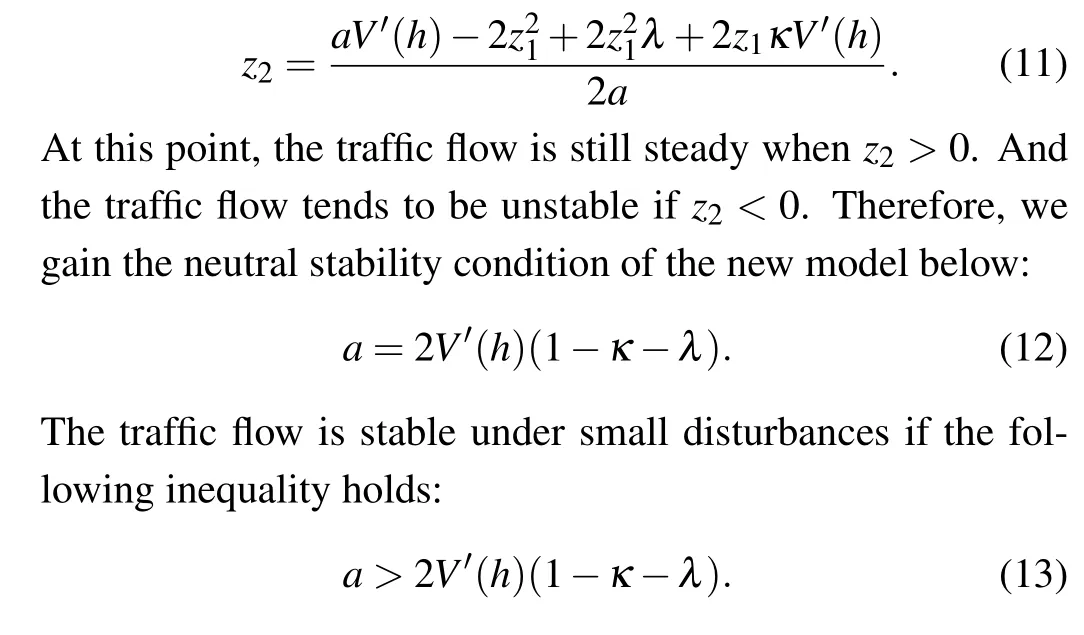
It is obvious that the stable condition is consistent with the OV model[3]whenκ=0 andλ=0. Figure 1 displays the neutral stability line of the relationship between headway and driver sensitivity under different values of control coefficientκandλ(see the solid line). The peak value of each curve represents the critical point(hc,ac)in Fig.1.
The areas above the neutral curve are stable areas without traffic jams, while the areas below the neutral curve are unstable areas. Figure 1(a) describes the situation asκincreases whenλ=0. Evidently, the critical sensitivityacof the new model declines with the increase ofκ,which implies that the stable area expands by considering the headway delayed effect. Furthermore, figure 1(b) displays the cases under different values ofλunder the same control coefficientκ. Apparently, the neutral stability lines show a downward trend whenλgoes up,which means that the stable area is also broadening and the traffic flow also changes in the direction of stability by strengthening the velocity delayed effect. Therefore,the results from linear analysis show that the stability of the transportation system can be significantly enhanced under the CITD effect covering the headway and velocity.
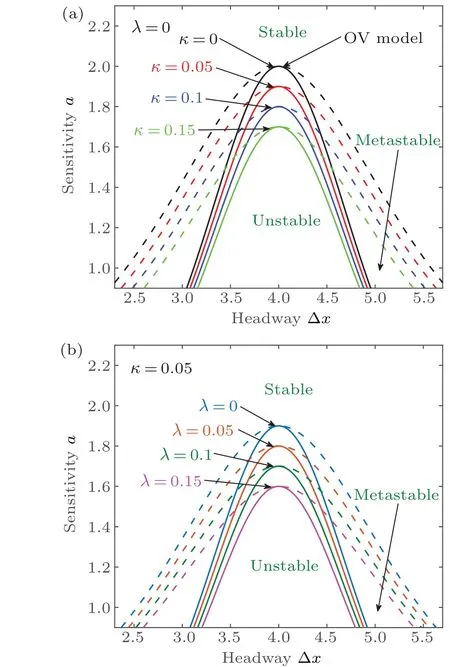
Fig.1. Neutral stability curve and coexistence curve for(a)λ =0 and various values of κ,and(b)κ =0.05 and various values of λ.
4. Nonlinear analysis
In order to study the influence of CITD effect on the evolution process of traffic flow density wave, we conduct the nonlinear analysis and obtain the mKdV equation describing the kink–antikink density wave. Above all, for the convenience of research,equation(5)is rewritten as
Therefore,equation(14)can be expanded to the fifth order ofεas follows:
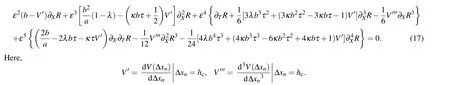
Near the critical point (hc,ac),ac=a(1+ε2). By takingb=V′(hc),ε2andε3can be eliminated in Eq.(17),i.e.,
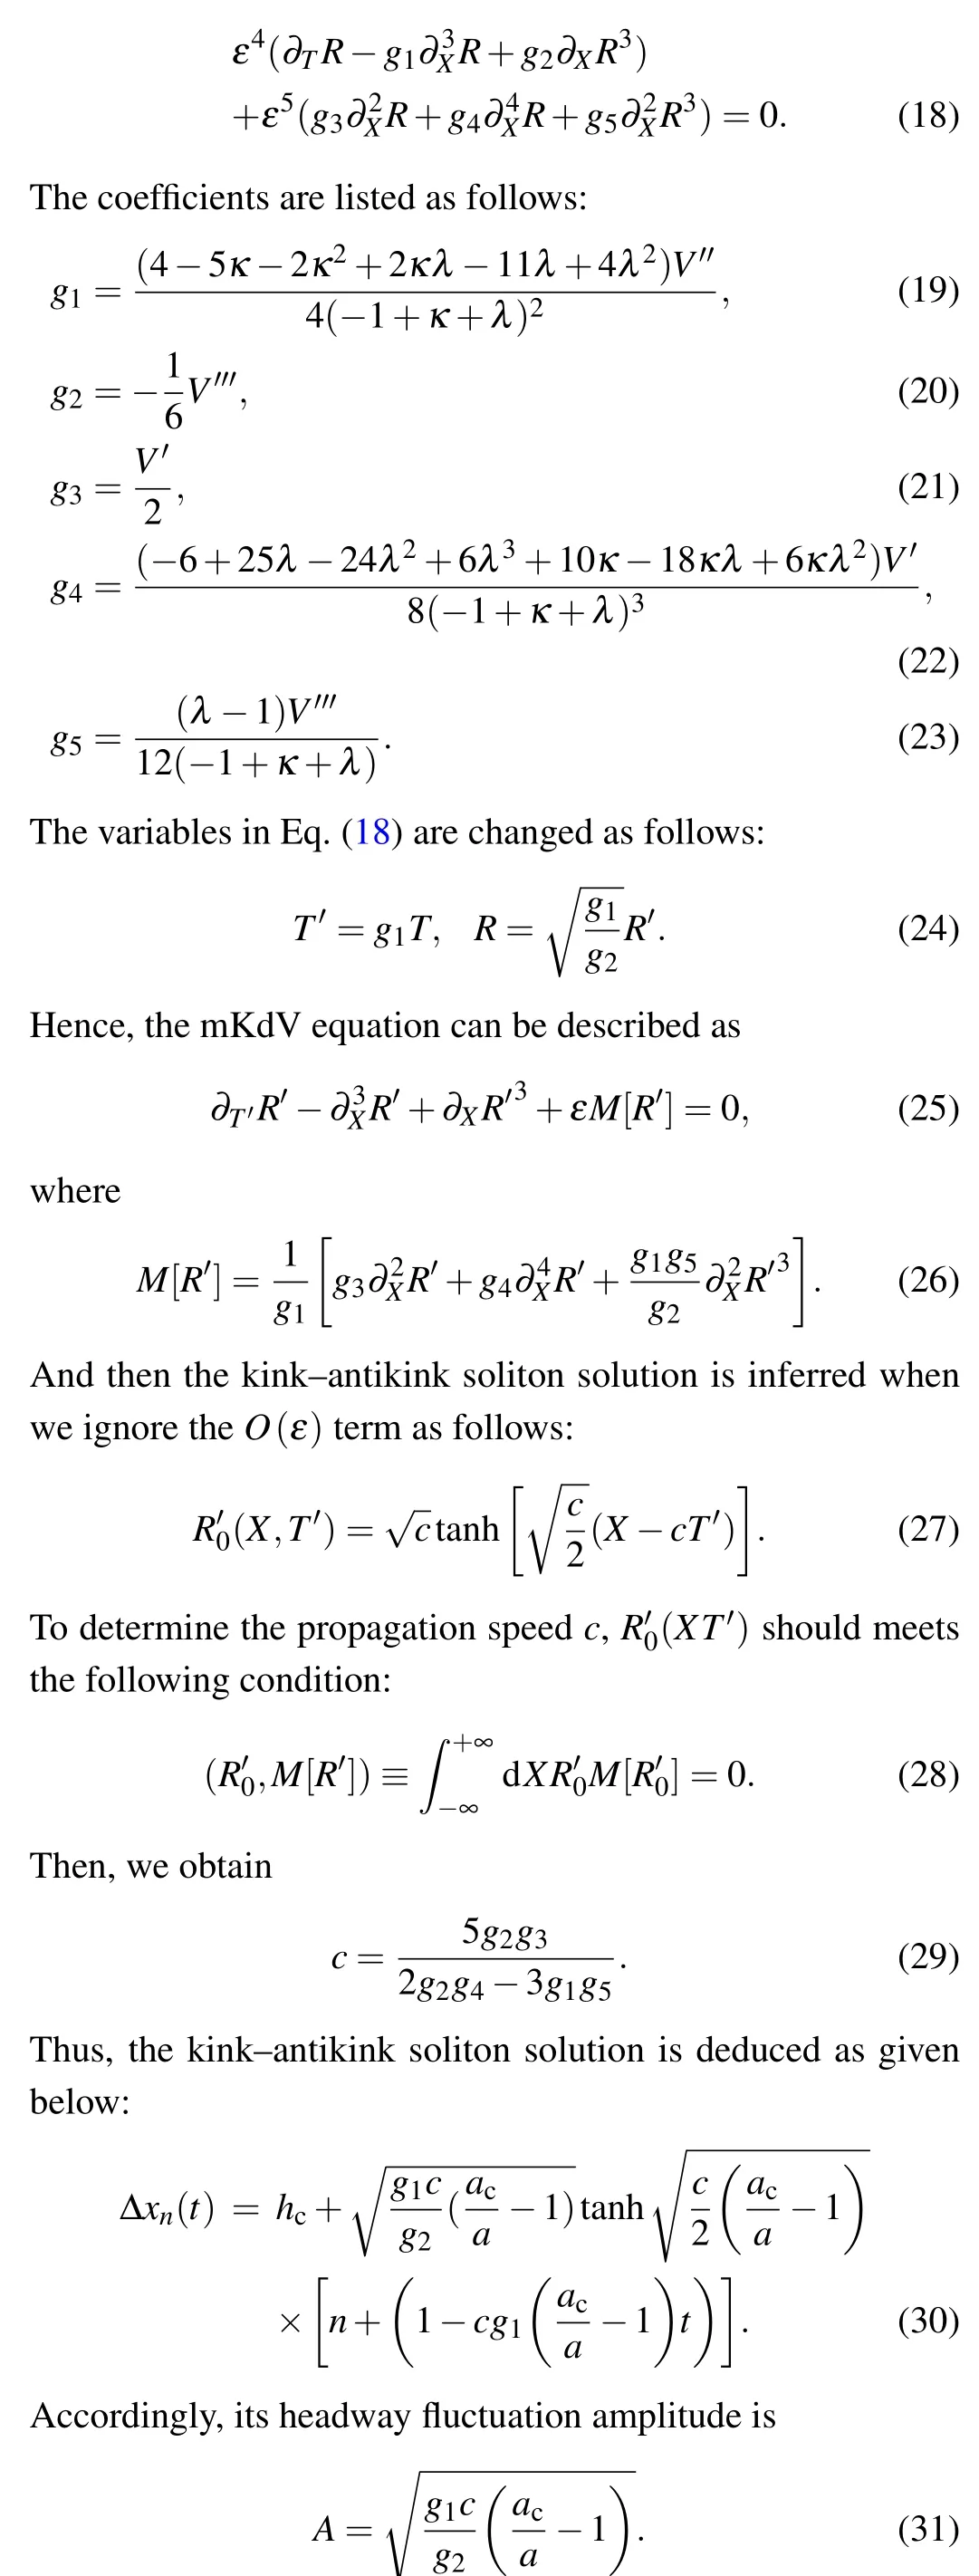
Correspondingly,the coexistence curve can be expressed as

In view of Eq. (32), we can draw the coexisting line (see the dotted line as shown in Fig. 1). Thereout, we can obtain the conclusion similar to that from the linear analysis,namely,the stability of traffic system can be improved more effectively by taking the CITD effect into consideration.
5. Simulation results
In this section, we will conduct numerical simulation to test the CITD effect on the stability of traffic flow. The purpose of the simulation is to examine the ability of uniform traffic flow to resist small disturbances. We rewrite Eq. (3)into difference form for numerical simulation as follows:

5.1. Headway distribution
The headway distribution can well reflect the stability of the traffic system. If the traffic is stable,then the headways of vehicles are similar to each other. And if there was a traffic jam on the road,then the vehicles would remain a stop-and-go state. So the waves of headway will be jumbled. Hence, we can judge the stability of the traffic system from the volatility of the headway distribution curve. Figure 2 shows the headway distribution diagram of 100 cars att=20300 time steps.Among them,figures 2(a)and 2(b)show the results of increasingκandλ,respectively. It can be seen that whenκ=0 andλ=0 (i.e.the OV model), the fluctuation amplitude of the headway distribution curve is the maximum. In addition, asκandλrise,the volatility of the headway distribution curves also weakens. Especially, the amplitude of headway fluctuation tends to 0 whenλ=0.15 andκ=0.05 and the traffic flow reaches steady state.In short,the CITD effect can stabilize the traffic flow.
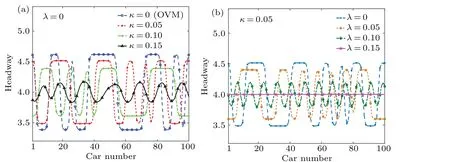
Fig.2. Headway distribution at the 20300th time step for(a)λ =0 and various values of κ,and(b)κ =0.05 and various values of λ.
5.2. Hysteresis phenomenon
Figure 3 describes the hysteresis loop composed of headway and headway difference between adjacent time steps(55th car). The abscissa is the headway Δx55(t). The vertical coordinate is the headway variation of the 55th car between adjacent time steps. Then, the strength of traffic stability can be judged according to the size of the hysteresis loop. The smaller the area of the hysteretic loop, the better the stability is. Figures 3(a)and 3(b)display the results of augmentingκandλ, respectively. We can observe that whenκ=0 andλ=0(i.e.the OV model),the area of the hysteretic loop is the largest. This means that the OV model has the severest hysteresis. With the increase ofκandλ,the area of the hysteresis loop is constantly shrinking. In particular,the hysteresis loop contracts to a point whenλ=0.15 andκ=0.05 and all vehicles’headways keep at 4(m).It shows that the traffic flow is in a steady state at this time. In view of Fig.3,the stability of the traffic flow is improved by sharing the CITD effect covering both headway and velocity.
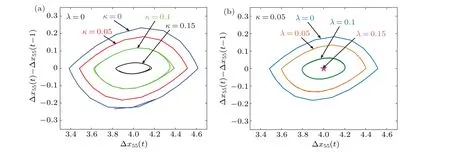
Fig.3. Hysteresis phenomena(55th car’s headway,the headway between adjacent times)for(a)λ =0 and various values of κ,and(b)κ =0.05 and various values of λ.
5.3. Additional energy consumption
The instantaneous energy consumption is described as[46]
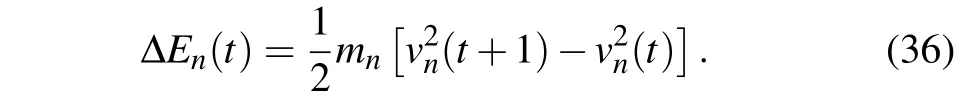
However,the additional energy consumption has not been investigated in the transportation system. In real traffic,the vehicle speed changes little with time for the steady-state traffic flow. The vehicle only needs to maintain a certain stable velocity without frequent braking and acceleration. At this time, the vehicle’s kinetic energy remains stable, and the additional energy consumption is wee. On the other hand, the speed of the vehicle can change greatly with time when traffic jam occurs on the road. Cars need to accelerate frequently in the stop-and-go driving process,which greatly aggrandizes the additional energy consumption. Furthermore,we consider that in reality the substantial increase of vehicle’s energy consumption does not occur during braking, but usually happens during acceleration.[47]Based on this,in order to better reflect and record the additional energy consumption of a certain car in the acceleration process,we propose

whereδtis a variable factor, whenvn(t+1)>vn(t),δt=1,otherwiseδt=0. By addingδt, the additional energy consumption during acceleration can be recorded,while the braking process can be ignored. At the same time, by accumulating time, it can well reflect the total amount of extra energy consumed by a certain car in a period of time. In addition,on the actual road, different types of vehicles have different amounts of extra energy consumed. It is so complicated to study the amounts of energy consumed by different types of cars. Hence,for better calculation and discussion,in this work all treated vehicles are of the same type and their mass magnitude is set as unit mass 1. Therefore, equation (37) can be rewritten as follows:
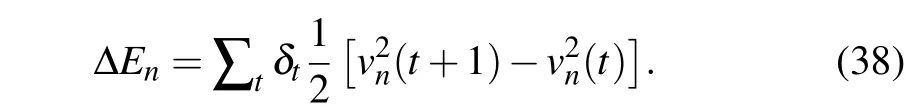
Moreover,in order to better obtain the additional energy consumption of the entire transportation system, we sum up the additional energy consumption of all vehicles(i.e.Nvehicles)as indicated below:

Figure 4 shows the curves of additional energy consumption of all vehicles from the beginning to 20300 time steps whenκandλincrease,respectively. The curves of additional energy consumption fall down withκincreasing whenλ=0 in Fig.4(a),which proves that the headway delayed effect can reduce the additional energy consumption. And on the basis of Fig.4(b),the curves of additional energy consumption also show a descending trend asλaggrandizes whenκis fixed at 0.05. This means that the velocity delayed effect can also cut down the additional energy consumption. Especially whenκ=0.05 andλ=0.15,the additional energy consumption of the entire transportation system tends to 0,which indicates that the traffic flow is already in a steady state in this case. From this experiment it follows that additional energy consumption of overall traffic system is reduced by sharing the CITD effect of headway and velocity under the V2X environment. By means of such traffic optimization,we realize the energy consumption control.
6. Conclusions
In this paper,we present an extended car-following model with the CITD effect covering headway and velocity under the V2X environment. The linear analysis and nonlinear analysis have been executed to explore the stability conditions and the mKdV equation relating to the CITD effect. The numerical simulation experiment further verifies that the CITD effect can alleviate the traffic congestion and improve the stability of traffic flow system. The main conclusions are as follows.
(i)Both the headway delayed effect and the velocity delayed effect can alleviate traffic congestion. When the synergistic function of these two effects is taken into account, the efficiency of the traffic system to reach the steady state can be greatly improved.
(ii)We propose a new method of analyzing the additional energy consumption,which can better illustrate the additional energy consumption of the vehicle during acceleration. It can be found that the additional energy consumption can be effectively controlled macroscopically by considering the CITD effect.
In summary, the synergy of two factors including headway and velocity should be considered at the same time in the car-following model. The car-following model based on the CITD effect can improve the stability of the traffic flow system and reduce additional energy consumption under the V2X environment.
Acknowledgements
Project supported by the National Natural Science Foundation of China(Grant Nos.61963008,61673168,11762004,and 12047567), the Guangxi Natural Science Foundation,China (Grant Nos. 2022GXNSFDA035080 and 2018GXNSFAA281274), the Guangxi Innovation-Driven Development Special Fund Project,China(Grant No.GUIKEAA19254034-3),and the Zhenjiang Science and Technology Project,China(Grant No.GY2020019).

- Chinese Physics B的其它文章
- A nonlocal Boussinesq equation: Multiple-soliton solutions and symmetry analysis
- Correlation and trust mechanism-based rumor propagation model in complex social networks
- Gauss quadrature based finite temperature Lanczos method
- Experimental realization of quantum controlled teleportation of arbitrary two-qubit state via a five-qubit entangled state
- Self-error-rejecting multipartite entanglement purification for electron systems assisted by quantum-dot spins in optical microcavities
- Pseudospin symmetric solutions of the Dirac equation with the modified Rosen–Morse potential using Nikiforov–Uvarov method and supersymmetric quantum mechanics approach