
Impact of composition ratio on the structure and optical properties of(1-x)MnFe2O4/(x)ZnMn2O4 nanocomposite
2022-08-01 05:59ZeinHeibaMohamedBakrMohamedAliAlkathiriSamehAhmedAlhazime
Chinese Physics B 2022年7期
Zein K.Heiba, Mohamed Bakr Mohamed,,†, Ali A.Alkathiri, Sameh I.Ahmed,A A Alhazime
1Department of Physics,Faculty of Science,Ain shams University,Cairo 11566,Egypt
2Physics Department,Faculty of Science,Taibah University,Al-Madina al Munawarah,Saudi Arabia
3Depatment of Physics,College of Science,Taif University,P.O.Box 11099,Taif 21944,Saudi Arabia
Keywords: MFO and ZMO composite,XPS,structure,optical
1. Introduction
Multi-functional nanocomposite materials represented a newly emerging research area for the progressive development of nanotechnology.[1–3]Ferrite materials have a small bandgap therefore they easily converted the visible light energy into chemical energy to support the oxidation and reduction process.[4]Manganese ferrite (MnFe2O4, MFO) is an efficient visible light-responsive nano-photocatalyst with a narrow bandgap of 2.0 eV±0.5 eV.[5]Zinc manganite (ZnMn2O4, ZMO) has a spinel structure and is receiving attention as a result of its probable uses in batteries and supercapacitor fields.[6,7]The optical characteristics of different materials can be altered by changing their size,doped it with suitable materials or coupling it with other compounds.[8,9]For instance, the optical band gap of pure MFO is reduced from 2.46 eV to 2.12 eV and 2.47 eV for the hybridization of MFO/CeO2/SnS2composites.[10]The optical bandgap of MFO was increased as it doped with Zn.[11]The novel microwave-based treatment with MoS2-MFO composite revealed a rapid Cr(VI)reduction in aqueous solution.[12]The recovered MFO/BiVO4heterojunction was very active and stable for tetracycline degradation in the longterm process.[13]MFO/g-C3N4/TiO2nanocomposites under solar light revealed a very high photocatalytic degradation of Methyl Orange dye because of synergistic influence.[14]The coupling of MFO with ZnS in MFO/ZnS nanocomposite enhanced the heating efficiency for magnetic hyperthermia application.[15]The optoelectronic performance of MFO was improved as it decorated with Co3O4nanorods.[16]Core double-shell MFO@rGO@TiO2superparamagnetic photocatalyst represented a promising material for the waste-water treatment procedure.[17]The relatively narrow bandgap of Feor Cr-doped ZMO together with the small dielectric properties nominated the produced materials to applied optoelectronic field.[18,19]In the present study, the influence of alloying between nano MFO and ZMO phases on the produced nanocomposite materials was examined employing Rietveld refinement procedure,x-ray photoelectron spectroscopy(XPS), Fourier-transform infrared spectroscopy (FTIR), and transmission electron microscope(TEM)techniques. Furthermore the effect of alloying on optical characteristics of the resulted nanocomposite was explored using the photoluminescence and ultra-violet(UV)diffused absorption devices.
2. Methods and materials
(1-x)MnFe2O4/xZnMn2O4(x=0,0.2,0.5,0.8,and 1.0)samples were prepared employing co-precipitation procedure Fig. 1. The required amount from zinc acetate, manganese acetate and iron nitrate were dissolved in distilled water and ethylene glycol using a magnetic stirrer and heating at 90°C(3 h). The resulted precursors were further heated at 400°C(2 h) and the powder materials were produced. The x-ray diffraction data (XRD) were carried out using x-ray diffractometer(PANalytical with copper source). The UV diffuse reflectance data were obtained using a double-beam spectrophotometer (Shimadzu UV–VIS-2600) with attached integrating sphere assembly. The photoluminescence emission data were collected using a spectrofluorometer (Jasco FP-6500, Japan,Xenon lamb,150 Watt)technique.FTIR spectrometer(Bruker Tensor 27)technique was used to trace the different vibration bands in different samples. The nano nature of 0.8 sample as an example was explored using a high transmission electron microscope(JEOL JEM-2100,200 keV).Different oxidations states for different elements in the studied materials were explored by using the x-ray photoelectron spectroscopy (XPS,Thermo Scientific XPS, Model: KALPHA surface analysis)technique.

Fig. 1. Preparation schema for MnFe2O4 /ZnMn2O4 nanocomposite system.
The direct optical band gap was calculated using Tauc’s and Beer–Lambert’s formulas[20,21]

Furthermore, the extinction coefficient (k), refractive index(n), real (εr) and imaginary (εi) dielectric constants, dielectric loss(tanδ),the optical conductivities(σopt),linear optical susceptibility(χ(1)), the third-order nonlinear optical susceptibility(χ3),and the nonlinear refractive(n2)can be obtained from[21]

whereA,d,Eg,B,hν,λg,h,c, (D1=[B(hc)n-1d/2.303],D2),λ,andRare the absorbance,thickness,optical band gap,constant,incident photon energy,the wavelength related to the optical gap,Planck’s constant,light velocity,constants represent reflection,wavelength,and reflectance,respectively.
3. Results and discussion
3.1. Crystal structure and phase analysis
The high quality x-ray diffraction patterns measured for(1-x)MnFe2O4/xZnMn2O4(x= 0, 0.2, 0.5, 0.8, and 1.0)are given in Fig. 2(a). Structural analysis applying Rietveld method implanted in the program MAUD[22,23]manifested the presence of two phases for the compositesx=0.2 and 0.5:ZnMn2O4(ZMO)with tetragonal spinel structure(S.G.I 41/a m d), and MnFe2O4(MFO) with cubic spinel structure (Fd-3m), while only singlephase ZMO is found for the samplex=0.8. Figure 2(b)illustrates the resulting fitting for diffraction pattern forx=0.5 and the resulting refined parameters are given in Table 1.
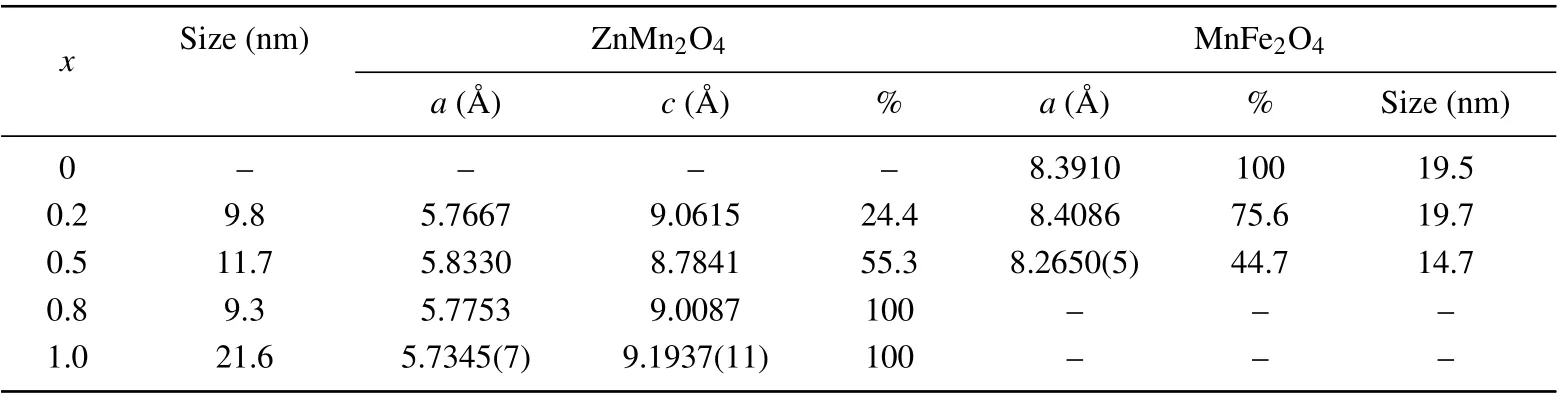
Table 1. The cell parameters (in unit ˚A), average crystallite size (in unit nm), and the phase percentages of the phases developed in the heterostructure nanocomposite (1-x)MnFe2O4/xZnMn2O4 (x=0, 0.2, 0.5, 0.8, 1.0) for different values of x.
The phase percentages of MFO and ZMO phases are different from the nominated values during preparation, which requires the incorporation of the cation of one phase into the lattice of the other phase; this confirmed the result concluded from IR analysis next. Such cation permutation among the octahedral and tetrahedral sites changes the cell parameters of the phases, (see Table 1). The cell parameter (a) of MFO altered irregularly, it slightly rose forx=0.2 and reduced forx=0.5. For ZMO phase,the cell parameter(c)reduced while the parameter(a)slightly rose with the alloying parameter(x).This could be correlated with cation permutation as follows:the ZMO octahedra,figure 2(c)has a base in theab-plane direction with four O-ions of equal bond length with the cation at the center (~1.97 ˚A), and two apex O-atoms along thecaxis with bond length=2.28 ˚A.Insertion of Fe3+ions of electronegativity (1.83) higher than that of Mn3+ions (1.55) results in shortening the longer bond length of the octahedra along thecaxis,i.e., compressing the octahedra along thecaxis. Consequently, the cell parameter (a) rose slightly. The crystallite size is hardly altered upon varied alloying parameter (x) as displayed in Table 1. The TEM image for sample withx=0.8 is displayed in Fig.2(d). It could be noticed that the particle size is in the nano range around 20 nm.

Fig. 2. (a) X-ray diffraction patterns for (1-x) MnFe2O4 + xZnMn2O4 nanocomposite samples, (b) Rietveld refinement pattern fitting for sample with x=0.5,(c)crystal structure of ZnMn2O4 phase,and(d)TEM image for sample with x=0.8.
Infrared absorption (vibrational) spectroscopy is bond specific and commonly employed to characterize transition metal–oxygen species. For this purpose,FTIR spectra for the present system (1-x)MnFe2O4/xZnMn2O4(x=0, 0.2, 0.5,0.8,and 1.0)have been measured,(see Fig.3). The spectrum of the pure sample MFO(x=0.0),has two vibrational bands observed at 552.1 cm-1and 628.3 cm-1which could be assigned to stretching vibrations of metal↔O at octahedral and tetrahedral sites,respectively.[24,25]Forx=0.2 sample,MFO phase is the dominant,(see Table 1),so only MFO vibrational bands appeared at 554.2 cm-1and 636.6 cm-1for octahedral and tetrahedral vibrational bands,respectively;no characteristic bands for ZMO are observed in the spectrum. One can notice in Fig.3 that both bands become flat and shifted to higher wavenumbers compared withx=0.0,indicating that some Zn ions have been incorporated into the MFO lattice in both octahedral and tetrahedral sites. The IR spectrum of pure ZMO(x=1.0) has two vibrational bands located at 506 cm-1and 619 cm-1which are characteristic of tetragonal spinel structure and belong to metal↔O vibrations at octahedral and tetrahedral sites, respectively.[26,27]For the samplex= 0.8,only these two bands of ZMO phase appeared and no bands for MFO phase were observed. Furthermore, as indicated in Fig.3, both vibrational bands are shifted(relative tox=1.0)to lower wavenumbers,481 cm-1and 608 cm-1implying that some Fe ions are incorporated into the ZMO phase in both octahedral and tetrahedral sites. For samplex=0.5,both phases ZMO and MFO are formed with nearly equal percentages,so the vibrational bands of the two phases overlap yielding very flat bands as shown in Fig.3. One can conclude that for the nanocomposite samples, all cations have been permuted among the octahedral and tetrahedral sites of both ZMO and MFO phases.This is confirmed by the IR spectrum of the samplex=0.5 where the vibrational bands become flat due to the occupation of the sites by different cations(Zn,Mn,Fe).
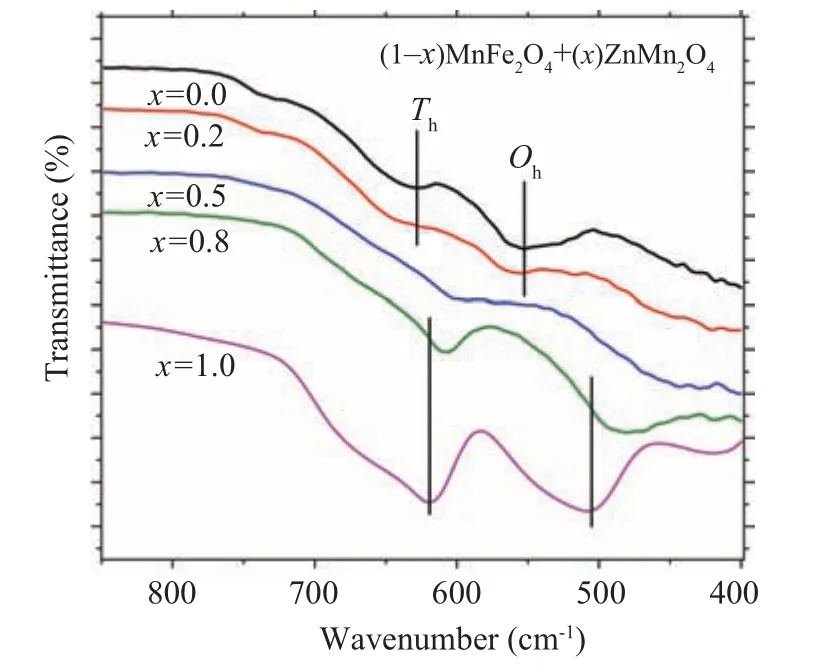
Fig. 3. FTIR spectra for (1-x) MnFe2O4 + xZnMn2O4 nanocomposite samples.
3.2. XPS investigations
For further investigating the cation permutation among the two phases MFO and ZMO,the elements constituting the samples and their oxidation states are examined by measuring the XPS spectra of the samplex=0.5. The XPS Gaussian fitting analyses were performed and illustrated in Fig.4.The fitting of the Zn 2p narrow scan,(see Fig.4(a)),disclosed two peaks at binding energies 1021.3 eV and 1044.3 eV which could be assigned to Zn2+2p3/2and 2p1/2energy levels. The energy difference of 23 eV coincides very well with that in literature.[28]Figure 4(b) displays the high-resolution spectrum of Fe 2p orbitals. The spectrum comprises a peak at 710.8 eV representing the binding energy of Fe3+2p3/2level,which could be decomposed into two subpeaks at 710.35 eV and 712.7 eV assigned to Fe3+at octahedral and tetrahedral sites respectively.[29]Furthermore,two satellite peaks appear at 716.3 eV and 719.5 eV to confirm the presence of Fe3+cations only.[30]The highresolution XPS of Mn 2p could be fitted into four contributions, (see Fig. 4(c): two at the binding energies of 641.1 eV and 642.1 eV represent the energy level Mn 2p3/2 and are assigned to the Mn2+and Mn3+,respectively.[31]The other two at 652.9 eV and 653.8 eV were assigned to Mn 2p1/2energy level. From the ratio of peak areas, the atomic ratio of Mn2+to Mn3+could be calculated to be 0.46 which is consistent with the phase percentage of MFO to ZMO,Table 1, where Mn2+residing at MFO while Mn3+residing at ZMO. Figure 4(d) depicts the O 1s narrowspectrum fitting which comprises three peaks at 529.7,531.4,and 532.1 eV.The first is assigned to O2-–metal bonding,the second is assigned to various reasons like surface OH,chemisorbed oxygen, oxygen ions in low coordination, and oxygen-containing surface contamination.[32,33]The third is attributed to surface bond water.[34]

Fig.4. XPS fitting for(a)Zn,(b)Fe,(c)Mn,and(d)O peaks for 0.5MnFe2O4 +0.5ZnMn2O4 nanocomposite samples.
3.3. Optical characterization
The variation of the diffused absorbance data with the wavelength for(1-x)ZnMn2O4/(x)MnFe2O4nanocomposite samples are displayed in Fig.5.
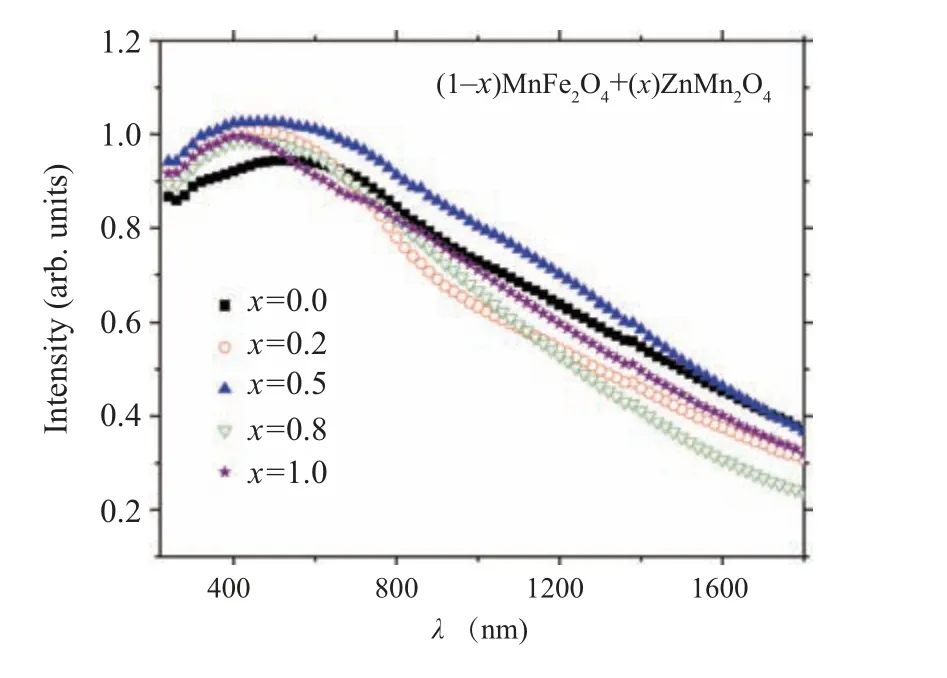
Fig.5. The wavelength dependence of the diffused absorbance for(1-x)MnFe2O4 +xZnMn2O4 nanocomposite samples.
As noticed from the graph the absorbance of ZMO ions is higher than the absorbance of MFO at a low wavelength range and the situation is reversed at the higher wavelength range. The absorbance of the nanocomposite samples is varied depended on the composition of the samples and the measured wavelength range. The sample withx=0.5 exhibited the highest absorbance among all samples. The change in the absorbance may be due to the variation of the charge trapping effect on the sample surface as a result of the shallow energy level impurities.[35]The direct optical band gap energy (Eg)of the nanocomposite samples can be extracted from the linear intercept of(ahv)2as a function ofhvgraph as established in Fig. 6. The obtained optical band gaps of MFO and ZMO samples are 2.68 eV and 2.13 eV, respectively. The obtained optical band gaps are in agreement with that obtained by other research groups, for example, the optical band gap of MFO formed by a facile hydrothermal route is 2.46 eV while theEgof MFO prepared by reverse-micelle synthesis strategy is 2.65 eV.[10,36]TheEgvalue for ZMO sample prepared by the solgel method is 1.28 eV.[37]Furthermore,the optical bandgap of(1-x)MFO/xZMO(x=0.2,0.5,0.8)nanocomposite samples are 2.55,2.54,and 2.63 eV.As noticed from the figure the optical bandgap of the nanocomposite samples is decreased as the amount of ZMO phase (less optical bandgap than MFO)increased in the samples, see Table 1. The band gap of MFO is 2.65 eV and that of ZMO is 2.13 eV, so most probable the band gap of intermediate composites will be in between,so it decreases by adding ZMO.The raising of the optical bandgap in the nanocomposite sample withx=0.8 instead of decreasing is due to the increasing of ZMO amount may be due to the formation of single-phase of ZMO,see Table 1. This increase in the optical band gap may be due to the introduction of Fe ions inside the ZMO matrix (x-ray part) which may alter the optical band gap characteristics of the host matrix. The refractive index(n)reflected the interaction between the photons and electrons in the materials.

Fig. 6. The relation between (A/λ)2 versus photon energy (hν) for(1-x)MnFe2O4 +xZnMn2O4 nanocomposite samples.
Figure 7(a)shows the changing of the refractive index(n)with wavelength for all samples. All samples exhibited a normal dispersion. Thenvalue of ZMO sample is higher than thenvalue of MFO sample. At the low wavelength range, MFO sample has the lowestnvalue while at a higher wavelength range, the sample withx=0.8 has the lowest n value. In the visible range, thenvalues of the nanocomposite samples are larger than the n value of MFO. In addition, thenvalues of the samples withx=0.2 and 0.5 are larger than ZMO sample in the visible range. The enhancement of the refractive index may be due to the change in the electronic structure of the MFO and ZMO materials upon alloying. Furthermore,the improvement of thenvalues is inferred from the improvement of the sensitivity of nanocomposite samples withx=0.2 and 0.5 to the daylight.

Fig.7. The wavelength dependence of(a)refractive index(n)and(b)extinction coefficient (k) for (1-x) MnFe2O4 + xZnMn2O4 nanocomposite samples.
Figure 7(b) displays the variation of the extinction coefficient(k)against wavelength for all nanocomposite samples.As noticed from the figure the behavior ofkvalues in all samples are similar where thekvalue increased with increasing the wavelength until it reached its highest value then it decreased again. Sample withx=0.5 in the(1-x)MFO/xZMO nanocomposite system has the highestkvalue while the sample withx=0.8 has the lowest value.
The wavelength-dependent of the dielectric constant(real and imaginary) and dielectric loss for (1-x)MFO/xZMO nanocomposite samples is represented in Fig. 8. As revealed from Fig.8(a), the real part of the dielectric constant(εr)has the highest value at a low wavelength range for all samples them it decreased with increasing the wavelength similar to the refractive index behavior. The low dielectric constants at a higher wavelength range restrain the electromagnetic energy propagation that contributes to the conductivity. Furthermore,the free carriers are activated and shared the conduction.On the other hand, the dielectric constant (εi) and dielectric loss (tanδ) increased with increasing the wavelength until it reaches the maximum value then it decreased with increasing the wavelength similar to thekvalue behavior. In addition,nanocomposite withx=0.5 has the highestεr,εi, and tanδvalues as compared with other samples.

Fig. 8. The wavelength dependence of the (a) real part (εr), (b) imaginary part (εi) of dielectric constant and (c) tanδ for (1-x) MnFe2O4 +xZnMn2O4 nanocomposite samples.
The variation of the optical conductivity (σopt) for all nanocomposite samples with photon energy is revealed in Fig. 9. Theσoptvalues in all samples were increased as the photon energy increased. Theσoptvalue for the nanocomposite sample withx=0.5 has the highest value among the other samples. The changes inχ(1),n2, andχ(3)values with the wavelength for all (1-x)ZnMn2O4/(x)MnFe2O4nanocomposite samples are represented in Fig. 10. All the three parameters exhibited a similar behavior,whereχ(1),n2,andχ(3)values are decreased with increase the wavelength. All samples haveχ(1),n2, andχ(3)values larger than MFO sample.Sample withx=0.5 has the highestχ(1),n2, andχ(3)values as compared with other samples. This result indicates the nanocomposite sample withx=0.5 has a good nonlinear optical behavior in all wavelength range.

Fig. 9. The variation of the optical conductivity for (1-x)MnFe2O4 +xZnMn2O4 nanocomposite samples with photon energy.
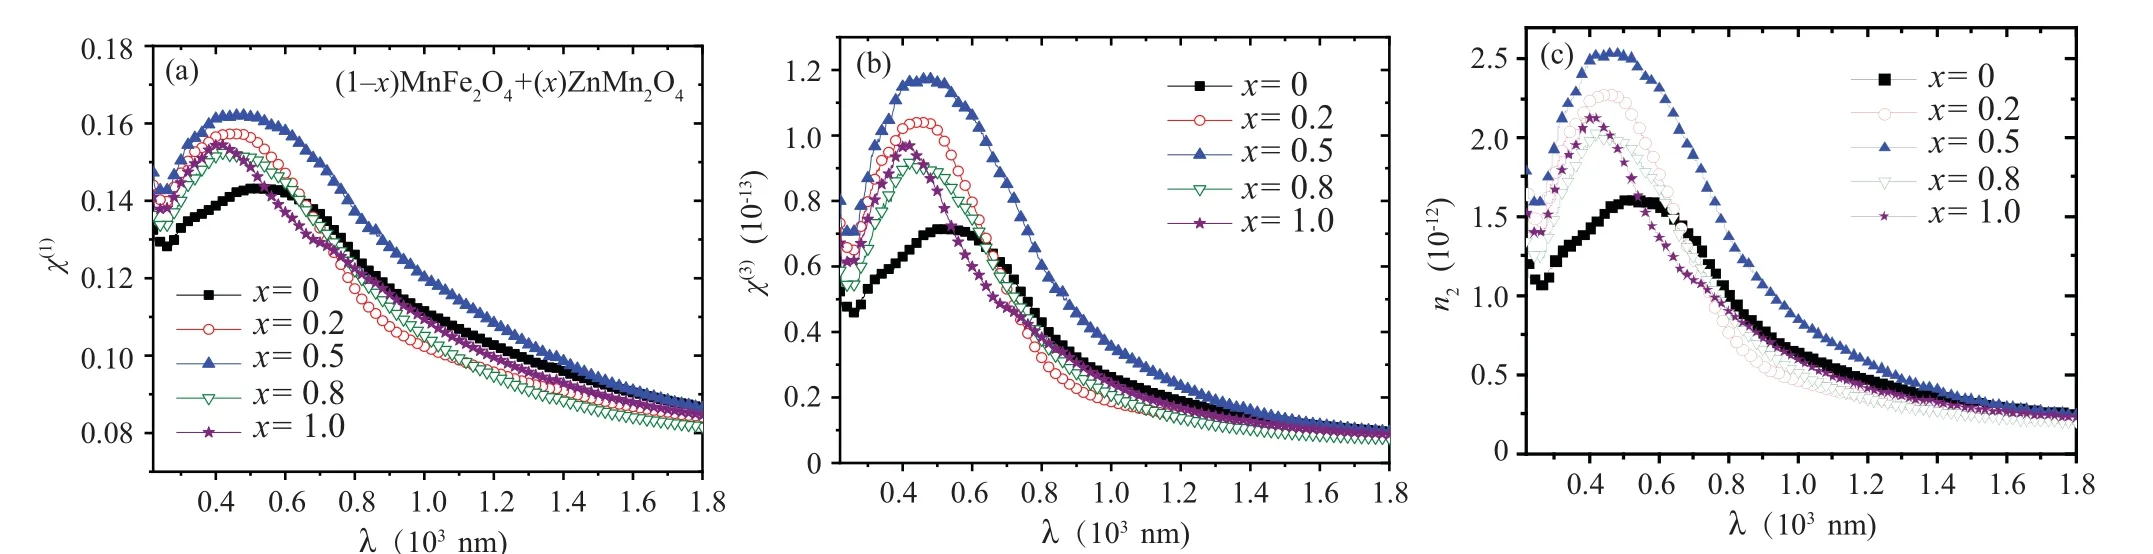
Fig.10. The Relation between(a)χ1,(b)χ3,(c)n2,and wavelength for(1-x)MnFe2O4 +xZnMn2O4 nanocomposite samples.
3.4. Photoluminescence(PL)emissions
Figure 11 reveals the photoluminescence (PL) data for(1-x)MFO/xZMO samples at room temperature by using 350-nm excitation wavelength. The PL intensity of the ZMO sample is higher than the PL intensity of the MFO sample.Furthermore, the PL intensities of the nanocomposite samples are between the PL intensities of MFO and ZMO samples. Sample withx= 0.2 has the lowest intensity while the sample withx= 0.5 exhibited the highest PL intensity.Similar results were obtained where the PL intensity reduced upon doping or forming composites: for ZnS upon coupling with MFO,[39]for intermediate nanocomposites of MnS@ZnS system,[38]and for ZMO upon doping with Fe[18]or Cr.[19]In contrast Patadeet al. found that as MFO doped with Zn, the PL intensity increased.[11]The variation of the PL intensity may result from changing of the recombination rate between the photo-induced electrons (e) and holes (h+) pairs created in the different samples which are depended on the trap levels produced in the bandgap upon alloying.[40,41]The reduction in the PL intensity of the nanocomposite samples may nominate them to be applied in the photocatalytic area. By using Gaussian fitting the PL of each sample can be divided into sub emission peaks. Moreover,the possible transition of electrons between different levels is also provided in Fig. 12. As noticed from the graph and Table 2 that the PL spectra of all samples except nanocomposite samples withx=0.5 and 0.8 are formed from two violets, blue and green colors. Samples withx=0.5 andx=0.8 emitted(two violets,blue)and(violet,blue,green)colors,respectively. The MFO formed by the co-precipitation procedure emitted a green color.[11]The disorder in the lattice or interstitial oxygen defects formed in the samples formed a green emission.[42]

Fig.11. The Gaussian fitting for photoluminescence measurements under 350 nm for(1-x)MnFe2O4 +xZnMn2O4 nanocomposite samples.

Table 2. PL peak positions for the nanocomposite(1-x)MnFe2O4 +xZnMn2O4 for different values of x.
4. Conclusions
Nanocomposites (1-x)MnFe2O4/xZnMn2O4withx=0.2 and 0.5 have ZnMn2O4(ZMO) with tetragonal spinel structure and MnFe2O4(MFO) with cubic spinel structure,while only single-phase ZMO is found for the sample withx= 0.8. The cell parameter (a) of MFO changed irregularly, for ZMO phase, the cell parameter (c) reduced while(a)slightly increased with the alloying parameter(x). The IR analysis and the variation in the lattice parameters confirmed permutation all cation among the octahedral and tetrahedral sites of the two phases in the intermediate samples. The XPS analysis revealed that Mn2+residing at MFO while Mn3+residing at ZMO.Sample withx=0.5 exhibited the highest optical absorbance among all samples. The obtained optical band gaps of MFO and ZMO samples are 2.68 eV and 2.13 eV,respectively; and of nanocomposite samples,x=0.2, 0.5, and 0.8 are 2.55, 2.54, and 2.63 eV respectively. Relative to the pure sample ZMO and MFO, the variation in refractive index of the nanocomposite samples with (x) is dependent on the wavelength region, except forx=0.5 sample which has the highest(n)value for the wholeλrange. Also,sample withx=0.5 disclosed the highestεr,εi,tanδ,σopt,and PL intensity values and a good nonlinear optical behavior as compared with other samples. The PL spectra of all samples exceptx=0.5 and 0.8 are formed from two violets, blue and green colors.Sample withx=0.5 and 0.8 emitted (two violets, blue) and(violet,blue,green)colors,respectively.
Acknowledgment
The authors acknowledge Taif University Research Supporting Project number (TURSP-2020/66), Taif University,Taif,Saudi Arabia.

- Chinese Physics B的其它文章
- Real non-Hermitian energy spectra without any symmetry
- Propagation and modulational instability of Rossby waves in stratified fluids
- Effect of observation time on source identification of diffusion in complex networks
- Topological phase transition in cavity optomechanical system with periodical modulation
- Practical security analysis of continuous-variable quantum key distribution with an unbalanced heterodyne detector
- Photon blockade in a cavity–atom optomechanical system