
New experimental measurement of natSe(n,γ)cross section between 1 eV to 1 keV at the CSNS Back-n facility
2022-08-31 09:54XinRongHu胡新荣LongXiangLiu刘龙祥WeiJiang蒋伟JieRen任杰GongTaoFan范功涛HongWeiWang王宏伟XiGuangCao曹喜光LongLongSong宋龙龙YingDuLiu刘应都YueZhang张岳XinXiangLi李鑫祥ZiRuiHao郝子锐PanKuang匡攀XiaoHeWang王小鹤JiFengHu胡继峰BingJiang姜炳DeXi
Chinese Physics B 2022年8期
Xin-Rong Hu(胡新荣) Long-Xiang Liu(刘龙祥) Wei Jiang(蒋伟) Jie Ren(任杰)Gong-Tao Fan(范功涛) Hong-Wei Wang(王宏伟) Xi-Guang Cao(曹喜光)Long-Long Song(宋龙龙) Ying-Du Liu(刘应都) Yue Zhang(张岳) Xin-Xiang Li(李鑫祥)Zi-Rui Hao(郝子锐) Pan Kuang(匡攀) Xiao-He Wang(王小鹤) Ji-Feng Hu(胡继峰)Bing Jiang(姜炳) De-Xin Wang(王德鑫) Suyalatu Zhang(张苏雅拉吐) Zhen-Dong An(安振东)Yu-Ting Wang(王玉廷)0 Chun-Wang Ma(马春旺)0 Jian-Jun He(何建军) Jun Su(苏俊)Li-Yong Zhang(张立勇) Yu-Xuan Yang(杨宇萱) Sheng Jin(金晟) and Kai-Jie Chen(陈开杰)
1Shanghai Institute of Applied Physics,Chinese Academy of Sciences,Shanghai 201800,China
2University of Chinese Academy of Sciences,Beijing 100049,China
3Shanghai Advanced Research Institute,Chinese Academy of Sciences,Shanghai 201210,China
4Institute of High Energy Physics,Chinese Academy of Sciences,Beijing 100049,China
5Spallation Neutron Source Science Center,Dongguan 523803,China
6Key Laboratory of Nuclear Data,China Institute of Atomic Energy,Beijing 102413,China
7Xiangtan University,Xiangtan 411105,China
8Institute of Nuclear Physics,Inner Mongolia University for the Nationalities,Tongliao 028000,China
9Sun Yat-sen University,Zhuhai 510275,China
10Henan Normal University,Xinxiang 453007,China
11Beijing Normal University,Beijing 100875,China
12School of Physics and Microelectronics,Zhengzhou University,Zhengzhou 450052,China
13ShanghaiTech University,Shanghai 200120,China
Keywords: natSe (n,γ) cross section, CSNS Back-n facility, C6D6 detectors, resolved resonance region, Rmatrix
1. Introduction
Most of the elements heavier than iron in the universe are mainly formed by the slow neutron capture process (s-process)[1,2]and the rapid neutron capture process (rprocess).[3]which account for about 50% of the whole stable elements respectively.[4]The rest of elements heavier than iron,about 1%,are produced by the capture of charged particles(p,γ)and the photonuclear reaction(γ,n),which is called p-process, and eventually produces the stable proton rich pnuclei.[5]The study of these nuclides and the accurate measurement of Maxwellian averaged cross section(MACS)of related nuclides for neutron capture reactions are of great significance in nuclear astrophysics.[6]The s-process mainly occurs in asymptotic giant branch(AGB)stars,in which the neutron density is low. The unstable sub-nuclei of the s-process form stable isobars throughβ-decay, and then continue to form new nuclide by means of additional neutron capture processes.Therefore,the slow neutron capture process takes place mainly along theβstable line. The r-process mainly occurs in supernova explosion or neutron star mergers. Due to the extreme neutron densities (∼1020cm−3) and short time scales(∼10 s),[7]very neutron rich nuclei are formed, which eventually decay through a series of beta decays.
Se is one of the key elements in nuclear astrophysics research. Isotopes of Se are in the path of slow neutron capture process. The (n,γ) cross sections of Se isotopes, help to determine the abundance of the related elements in the universe.The slow neutron capture process in the Se-region is presented in Fig. 1. The accurate measurements of the neutron capture cross sections of Se isotopes play an essential role in the reaction network of the nuclear astrophysics. According to the different properties of Se isotopes, measurements of neutron capture cross section of Se isotopes follow different methods.79Se, with a half-life of 295 ky, is one of the long-lived fission products (LLFPs) for which neutron capture cross section is important from the viewpoint of nuclear power.[8]Besides,79Se is an important branching point in the s-process path. However,there are no direct measurement neutron capture cross section data because it is difficult to obtain samples of79Se. The79Se (n,γ) cross section was constrained by its reverse reaction of80Se(γ,n)by the laser Compton scattering gamma source(LCS-γ)in 2009.[9]The neutron capture cross section of the other six stable isotopes can be directly measured via(n,γ)reaction. The natural abundances of the stable Se isotopes are 0.89%, 9.37%, 7.63%, 23.77%, 49.61%, and 8.73%for74Se,76Se,77Se,78Se,80Se,and82Se,respectively.In which,74Se is a p-nucleus,synthesized by the p-process,and its abundance is only 0.86%;76,77,78,80Se isotopes are mainly produced by the s-process, while82Se is produced by the rprocess.
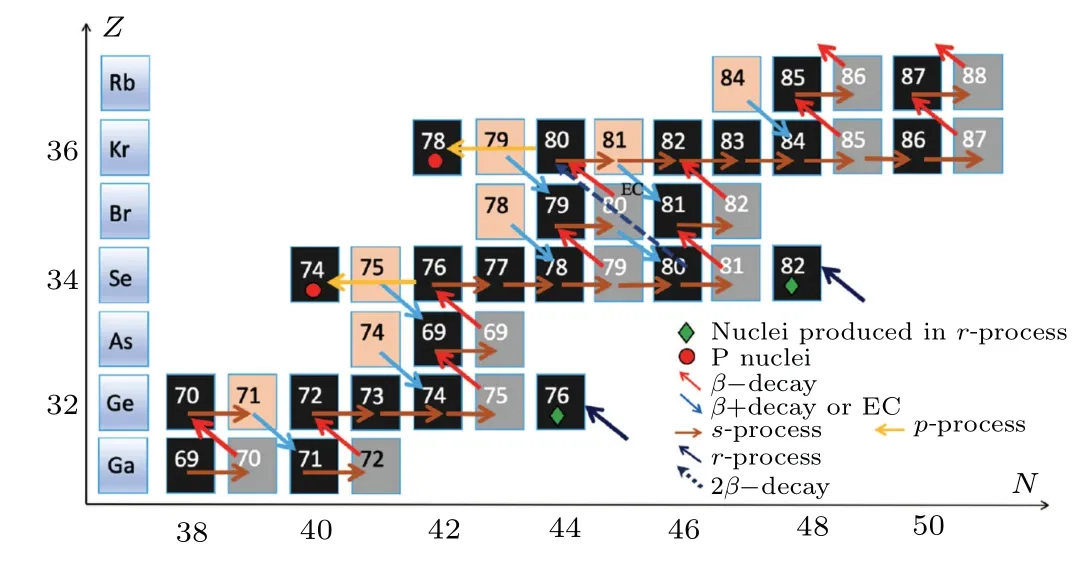
Fig.1.Synthetic network diagram of nuclei near Se isotopes.The black boxes represent stable nuclei, the orange boxes represent unstable nuclei that can undergo β+decay,and the gray boxes represent β−decay nuclei; The red arrows represent β−decay, the blue arrows represent β+ decay, the dark yellow arrows represent s-process, the yellow arrows represent p-process,and the dark blue arrows represent r-process.
Until now, there has not been enough experimental neutron capture cross sections for the selenium element in the 1 eV–1 keV resolved resonance region, except keV-region’s MACS for76Se[10]and78Se[11]isotopes. Recently,Babiano-Suarezet al.[12]measured the80Se (n,γ) cross section at n TOF in 2020,gave some resonance peak in the energy range from 0.1 keV to 100 keV but withoutR-matrix analysis. This work is the first experimental measurement of neutron capture cross section of natural selenium in the energy region between 1 eV and 1 keV at Back-n facility in CSNS. The experimental methods and data processing are analyzed in detail below.Finally,the neutron capture resonance parameters ofnatSe are also given.
2. Experimental setup
2.1. The Back-n facility
The neutron time-of-flight facility Back-n is one of the neutron beam lines in China Spallation Neutron Source(CSNS), which can provide continuous neutron energy spectrum in the energy range from 0.1 eV to 200 MeV.CSNS is the first spallation neutron source in China.[13]Here,neutrons are produced by a pulse proton beam with an energy of 1.6 GeV and a repetition frequency of 25 Hz, bombarding a tungsten–tantalum (W–Ta) target. The proton pulse of CSNS can be divided into three operation modes: i)the narrow beam bunch with the proton bunch width of 3.7 ns; ii) the single bunch mode,the bunch time structure is parabolic shape with bunch width of 60 ns;iii)the double-bunch mode,which consists of two single-bunch protons with a spacing of 410 ns. The measurement of neutron capture cross section in the resonance energy region is carried out under the double-bunch mode. The Back-n white neutron source is built at the back-scattering direction of the proton beam, which mainly focuses on nuclear data measurements and detector calibration. This beamline has two experiment stations ES1 and ES2 with the distances of 55 m and 76 m from the spallation target to each station,respectively. ES1 mainly studies the (n, light charge particle(lcp)) reaction cross section, and ES2 is mainly for the measurement of(n,γ),(n,tot),and(n,f)reaction cross sections.Our measurement is carried out at ES2. More detailed information on the Back-n facility can be found in Refs.[14–19].
2.2. The C6D6 detectors
Four deuterated benzene(C6D6)liquid scintillator detectors were used for theγ-ray detection. The C6D6detectors were placed upstream of the neutron beam sample to reduce the scattering neutron background. The main advantages of these detectors are a fast time response, with pulse width of the order 10 ns, and a very low sensitivity to scattered neutrons,which are widely used for(n,γ)cross section measurements up to now. The shell of the scintillator is made of aluminum due to its low capture rate,with a diameter and length of 130 mm and 76.2 mm,respectively. The distance between the detector center to the sample centre is about 150 mm,and the distance from the neutron beam centre to the centre of the front face of the detector is about 80 mm.[20]Figure 2 shows the Geant4 geometry of the sample and detectors implemented for this experiment.
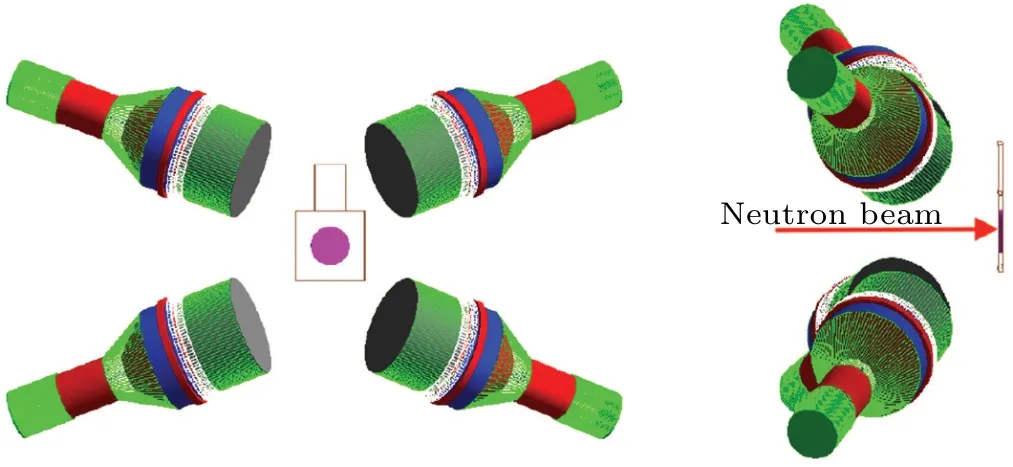
Fig.2. A schematic view of the detectors and sample setup used for this experiment by Geant4 simulation.
In the neutron capture cross section measurements, the amplitudes of the anode signals of the C6D6detectors range from 0.01 V to 3 V. Signals from the C6D6detectors are delivered to flash ADCs, which can digitize the signals into a full waveform with a 1 GS/s sampling rate and 12 bits resolution.[21]The incident neutron energy was determined by the time-of-flight(TOF)technique. The neutron energyEnis given by Eq. (1) and the corresponding neutron resolution is presented by Eq.(2),[24]
where the neutron flight lengthL=L0+∆L(En),L0is the geometric distance from the spallation target to the experimental sample, and ∆L(En) is the equivalent change in moderation length associated with the incident neutron energy.Tfis the neutron time of flight, given byTf=tn−tγ+L/c, wheretnandtγare the start time of the neutron capture signal and the start time of the gamma flash recorded by the data acquisition(DAQ)system,respectively;cis the speed of light.
Besides,the neutron flux was measured by using a silicon monitor;and the silicon monitor consists of a thin6LiF conversion layer and eight silicon detectors outside the neutron beam(Li–Si monitor)to count the number of neutrons by detecting alpha particles and3H through the reaction6Li (n,α)3H.[22]It is worth mentioning that with this detection system we have measured the neutron capture cross section of197Au[28]andnatEr[29]successfully,which validated the performance of the detection system and the processing methodology.
2.3. Samples
ThenatSe sample consisted of selenium monomers in powder form with a purity of 99.99%. In addition,the natural carbon sample and empty holder were used for the neutron scattering background and surroundingsγ-ray background subtraction, thenatPb sample for in-beamγ-ray background.Data were also recorded with a197Au sample for normalizing the cross section using 4.9 eV resonance for the saturated resonance method.[23]Table 1 shows the properties of the samples used in the experiment. ThenatSe sample was measured for 80 hours with a proton power between 22.8 kW and 23.4 kW.Then the gold sample and carbon sample were measured for 12 hours respectively, and finally the empty target was measured for 10 hours with a proton power 31.2–33.4 kW.
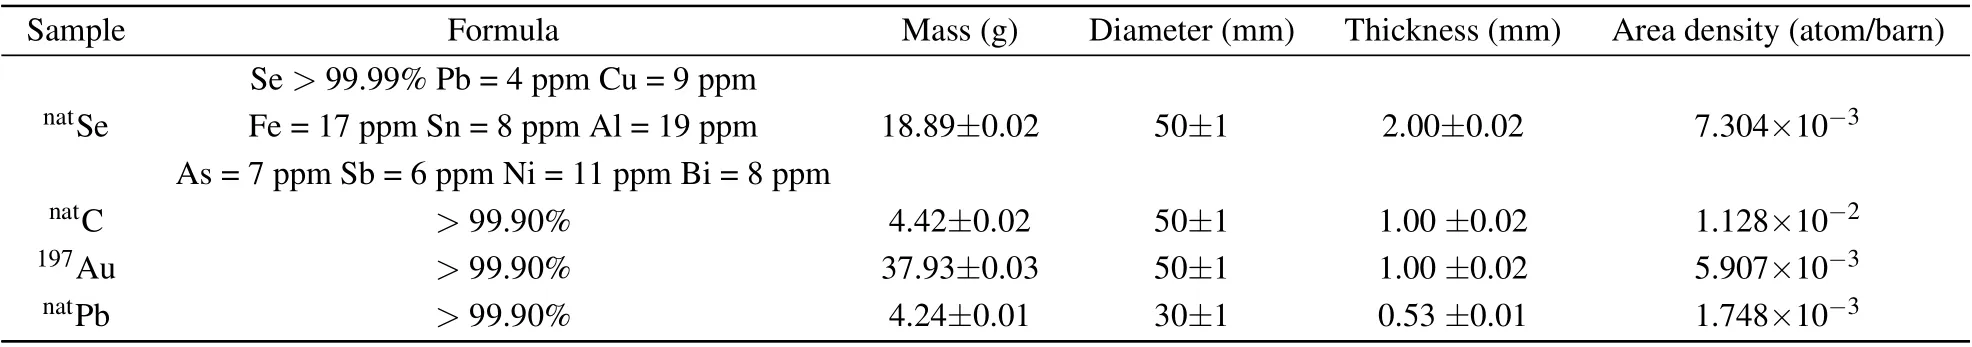
Table 1. Properties of the samples used in the measurement.
3. Data analysis
3.1. Pluse height weighting technique
The C6D6detection system is one of the total energy detection system that is widely used for neutron capture cross section measurements. In 1963,Moxon and Rae[25]first proposed the principle of the pulse height weighting technology(PHWT),then Macklin and Gibbons[26]for the first time used this method to measure the neutron capture cross section in 1967. PHWT has been developed for decades and has become a mature neutron capture cross section measurement method. According to this technique,two conditions must be met. First,the detection efficiency to gamma-rays has to be so low that at most only one gamma ray is detected in a capture event. Second,the detection efficiency is directly proportional to the energy of the gamma,εγ=k·Eγ. Owing toεγ ≪1 andEc=En+Sn,the capture efficiencyεccan be written as[27]
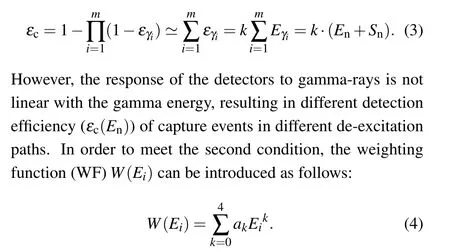
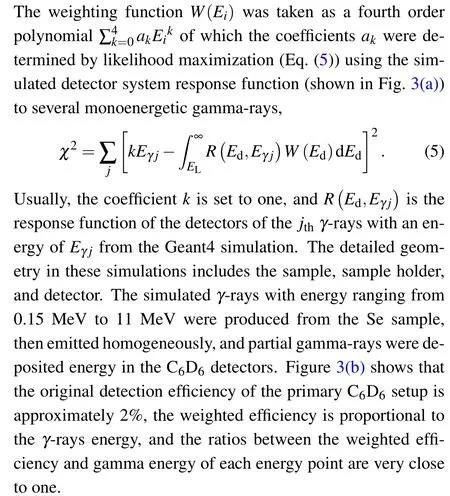
Fig.3. (a)The response function of the C6D6 detectors of natSe simulated by Geant4 with energy broadening. (b)The original efficiency of the C6D6 detectors in the top tile,the weighted efficiency of the detectors shown in the middle tile,and the ratio between weighted efficiency and the corresponding γ energy in the bottom tile, which is very close to one.
3.2. Determination of the capture yield
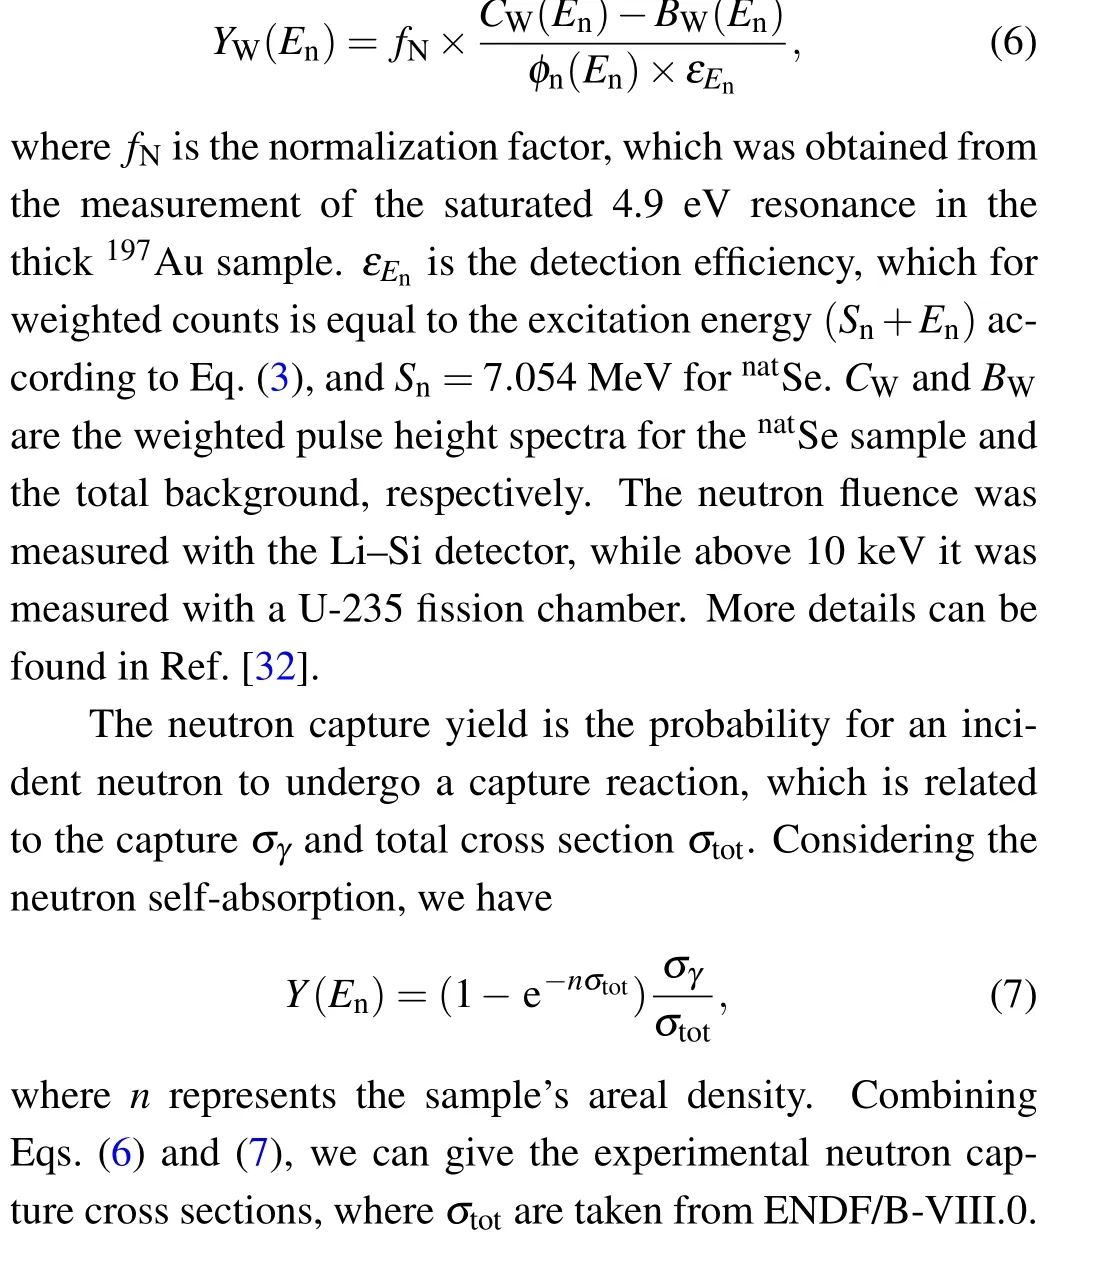
The experimental capture yieldYW[30,31]has been extracted dividing the weighted countsCW, after subtraction of the total backgroundBW,by the incident neutron fluenceφn:
3.3. Background estimation
A number of background contributions to the observed counts were identified and are shown in Fig.4 along with the measured spectrum of thenatSe sample. Their contributions were the ambient background subtracted by the empty holder,neutron scattering background from sample subtracted by the carbon sample,and in-beamγ-ray background deduced by the lead sample. The whole samples have been normalized by the Li–Si monitor shown in Fig.4. Because thenatPb sample has high gamma scattering cross section and low neutron scattering cross section,it was used for in-beam gamma calibration.It can be seen that the in-beam gamma mainly contributes to the energy region above 100 eV.The background contribution in the low energy band from thenatPb sample was less than the empty sample background contributions as shown in Fig. 4.The total backgroundB(En) was expressed as following formula:
whereB0is the time-independent background that mainly comes from the natural environment,Bem(En) is the sampleindependent background originating from the neutron beam flux with anything other than thenatSe sample,Bns(En)is the background caused by the neutron scattered from the sample,Bγs(En)is the background attributed to in-beamγ-rays scattering from the thenatSe sample;andηis the ratio of the product of the neutron elastic scattering cross section and the number of nuclei per unit area of thenatSe sample to that of the carbon sample.
3.4. Uncertainty analysis
The experimental uncertainty of this work comes from the recent experiment conditions and data analysis. According to the Back-n collaboration’s work,[32]the uncertainty of the neutron energy spectrum varies between 2.3%and 4.5%above 0.15 MeV and less than 8%below 0.15 MeV.The uncertainty from the proton beam power was recorded during the measurement,contributing an error of 2.0%. Uncertainty in data analysis mainly concluded the PHWT method,normalization and background subtraction. The system uncertainty of PHWT was 2.0%–3.0% according to Tainet al.[33]The systematic uncertainties from different sources contributing to the resulting yield normalization are summarized in Table 2. Owing to the diameter of samples(50 mm)larger than the neutron flux diameter (30 mm), the uncertainty caused by the relative position Se/Au is negligible. The uncertainty of the normalized factor of the gold sample at the saturated resonance energy of 4.9 eV is about 1%. According to J.Renet al.,[34]there is an obvious in-beam gamma background at time-of-flight between 20µs and 400µs,namely,the keV energy region. The whole uncertainties are presented in Table 2.
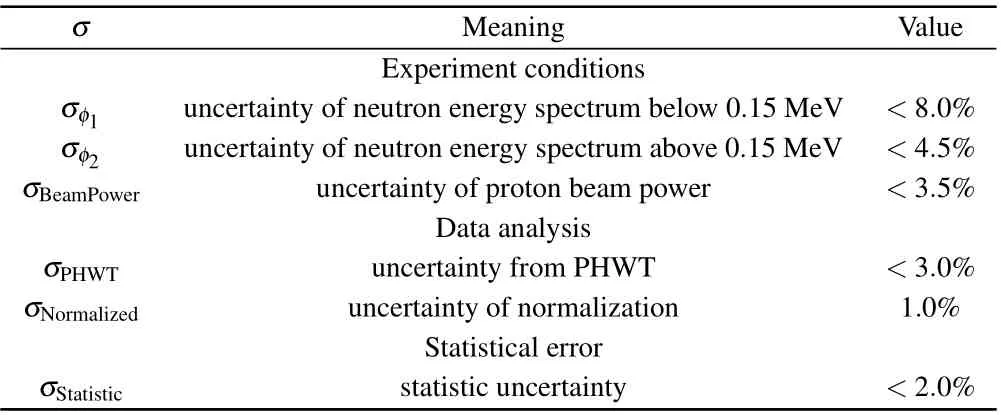
Table 2. The statistic uncertainty and systematic uncertainties of this experiment.
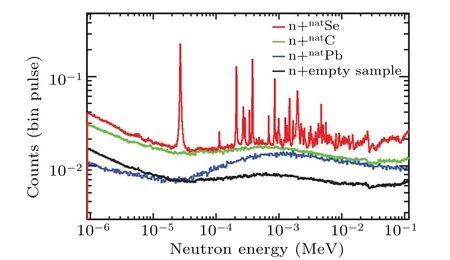
Fig. 4. The measured natSe spectrum together with the various measured scaled background components has been normalized by a Li–Si monitor;and the count rates are expressed in a width-independent logarithmic equidistant binning.
4. Result and discussion
It is worth mentioning that the neutron capture cross sections of natural Se can be calculated by weighting the cross sections of Se isotopes according to their abundances.Figure 5 shows the neutron capture cross sections ofnatSe and the contributions of Se isotopes in the energy region of 1 eV–100 keV respectively. The Se isotopes capture cross sections are taken from the ENDF/B-VIII.0 evaluation database.[35]We also plot the existing experimental data ofnatSe neutron capture cross section in Fig.5. In Fig.5 one can see that the current experimental cross sections for neutron capture in Se isotopes are seriously deficient,and there are only few experimental results in the energy range below 100 keV.
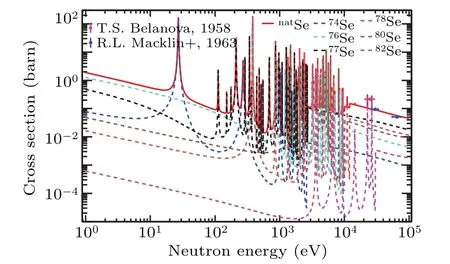
Fig.5. The neutron caption cross section of natSe is calculated by weighting the different isotopes cross sections with their abundances, where the red solid line represents the natSe(n,γ)cross section and the dashed lines are the contributions of each isotope capture cross section. The magenta and blue solid dots represent the existing experimental data.
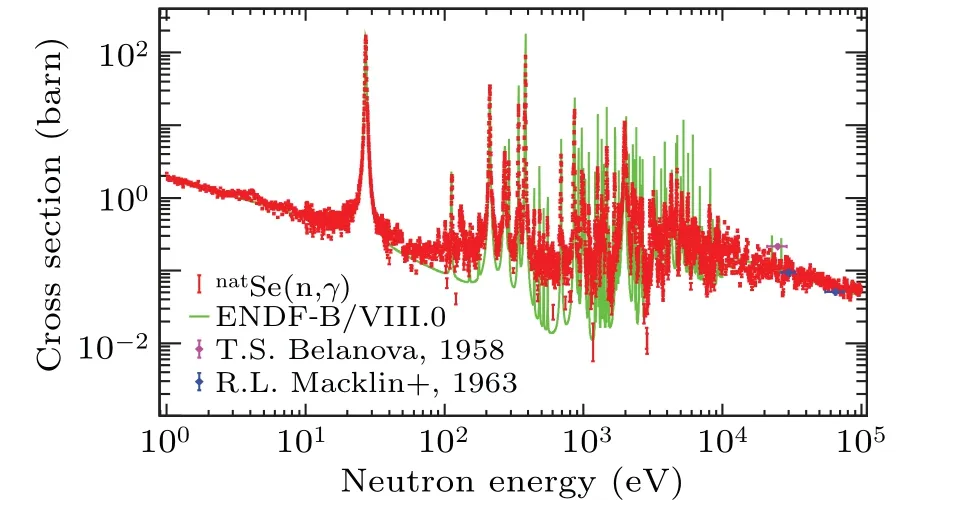
Fig.6. The neutron capture cross section of natSe in the energy region from 1 eV to 100 keV.

Fig. 7. The neutron capture cross section of natSe in the unresolved resonance region from 10 keV to 100 keV.
This work measured the neutron capture cross section ofnatSe in the 1 eV to 100 keV energy region, as shown in Fig. 6, where the red dots are the current experimental data and can roughly match the evaluated data ENDF/B-VIII.0[35](green solid line). Figure 7 shows the neutron capture cross section ofnatSe in the unresolved resonance region(URR)of 10–100 keV,where the evaluation data JEFF-3.3.[37]shows a large number of resonance peaks in this energy region,which differs significantly from our experimental data. Compared with the ENDF/B-VIII.0 data, our results are in better agreement with the evaluated data JENDL-4.0,[36]which also verify the reasonableness of the experimental data. And in this region,there are only three previous experimental data points from R. L. Mackinet al.[39]and T. S. Belanova.[40]Considering there being a large in-beam gamma background,[34]it is difficult to subtract completely the whole background limited to the current experiment conditions. On the other hand,the white neutron source(WNS)used the double-bunch mode of proton pulse, which limits the neutron energy resolution in the energy region of above 1 keV. For the above reasons,there are large errors in the experimental data in the resolved resonance region (RRR) above 1 keV, and unfortunately the resonance analysis cannot be performed in this region. This work focuses on the analysis of the resonance parameters ofnatSe in the 1 eV–1 keV energy region. Among them, the experimental results in the 100 eV to 1 keV energy region are compared with the ENDF/B-VIII.0 evaluation data as shown in Fig. 8, and overall, the experimental data can match the evaluation data well. The individual peak positions that are not matched, e.g.,at 130 eV,are brought about by the neutron energy spectrum[28]structure.
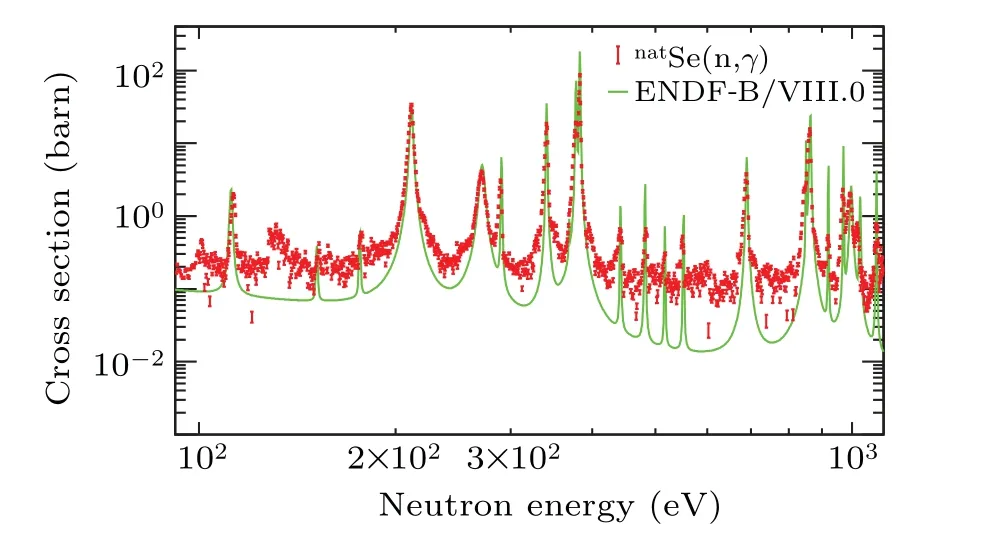
Fig.8. The neutron capture cross section of natSe in resonance regions of 0.1–1 keV.

Fig.9. The resolved resonance range of 1 eV to 1050 eV analyzed in this work. The pink points are the experimental data,and the black line is the R-matrix fit performed with SAMMY.
Neutron resonances up to about 1.05 keV neutron energy were identified and analyzed using the multilevelR-matrix code SAMMY.[38]The fitting procedure applied in the Reich–Moore approximation to find the“best fit”values of resonance parameters and the associated parameter covariance matrix was based Bayes’s theorem. In the above 1050 eV, due to the limited energy resolution of the detection system, theRmatrix analysis was not performed. The fit included multiple scattering and self-shielding corrections, and Doppler broadening with an effective temperature of 300 K using the free gas model(FGM).Owing to many energy broadenings, the measured resonance widths were larger than the natural widths;and only the capture kernel could be determined. It is related to the resonance area via[41]
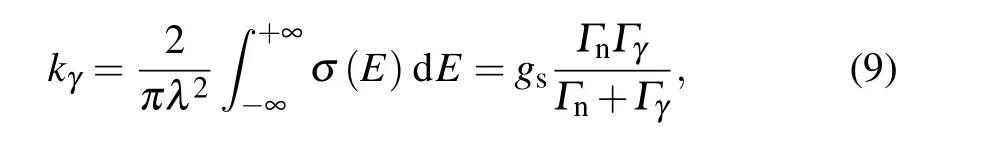
whereλdenotes the de Broglie wavelength at the resonance energy, andΓn,Γγrepresent the neutron and gamma partial widths, respectively. The statistical spin factorgs=(2J+1)/(2S+1)(2I+1) is determined by the resonance spinJ, the neutron spinS=1/2, and the spinIof the target nucleus. And the resonance spinJ=I+S+lrelates to the neutron orbital angular momentuml,i.e.,l=0 corresponding to s-wave neutron,l=1 to p-wave neutron. The resonance fits up to 1050 eV are shown in Fig. 9, which match the experimental data well. At last,we extracted the corresponding resonance parameters,i.e.,the neutron width(Γn)and gamma partial width (Γγ) seen in Table 3. We get three resonances for74Se contribution at 27.1 eV, 270.8 eV, and 1018 eV; and most of the resonances are of77Se nuclei’s contribution.Since some of the nuclei77Se weighed resonance cross sections are relatively low, introducing increased background errors, the authors recommend measuring the neutron capture cross section of77Se isotope separately and extracting the corresponding resonance parameters.

Table 3. The resonance parameters above 27 eV obtained by this work. Quantum number I,l and Jπ are taken from ENDF/B-VIII.0,and ER represents the ENDF/B-VIII.0 evaluated resonance energy.
5. Conclusion
For the first time, thenatSe neutron capture cross section in the 1 eV–100 keV energy region has been measured at the Back-n facility of CSNS by using the four C6D6liquid scintillator detectors. A detailed description of data analysis with PHWT and system uncertainty evaluation are given. The cross sections in the 10–100 keV energy are a good agreement with the JENDL-4.0 and ENDF/B-VIII.0 evaluated data,which verify the correctness of the experimental method and data processing. Data in the 1 keV–10 keV energy range exist larger errors due to the large in-beam gamma background and the limitation of neutron energy discrimination at current experimental conditions. The data of the 1 eV–1050 eV were analyzed in detail and theRmatrix program was used to provide the isotope contribution of the natural selenium resonance shape and the corresponding resonance parameters. The result shows that74Se and77Se isotopes have greater contributions on the resonance peaks of natural selenium in the 1–1050 eV energy region.
Data availability
The data that support the findings of this study are openly available in Science Data Bank at http://doi.org/10.11922/sciencedb.j00113.00019.
Acknowledgements
The authors sincerely appreciate the efforts of the staff of the CSNS and Back-n collaboration as well as Prof. Gui-Lin Zhang for his useful suggestion on data analysis. This work was supported by the National Natural Science Foundation of China (Grant Nos. 11875311, 11905274, 11705156,11605097, and U2032146) and the Strategic Priority Research Program of Chinese Academy of Sciences (Grant No.XDB34030000).
- Chinese Physics B的其它文章
- Direct measurement of two-qubit phononic entangled states via optomechanical interactions
- Inertial focusing and rotating characteristics of elliptical and rectangular particle pairs in channel flow
- Achieving ultracold Bose–Fermi mixture of 87Rb and 40K with dual dark magnetic-optical-trap
- Oscillation properties of matter–wave bright solitons in harmonic potentials
- Synchronously scrambled diffuse image encryption method based on a new cosine chaotic map
- Power-law statistics of synchronous transition in inhibitory neuronal networks