
Peripapillary vessel density and retinal nerve fiber layer thickness changes in early diabetes retinopathy
2022-09-14 06:50XiangNingWangXuanCaiTingTingLiDaLongQiangWu
INTRODUCTION
Diabetic retinopathy (DR) is a potentially fatal complication with diabetes mellitus (DM) and the primary cause of blindness worldwide
. Previous studies have shown that early diagnosis of type 2 diabetes mellitus (T2DM) and screening for retinopathy is associated with a lower incidence and severity of retinopathy
. However, when retinal lesions become clinically evident, it is impossible to reverse the injury, and the likelihood of DR progression increases
. The present DR management is focused on the late stages, where retinal systems and vision acuity have also been compromised
. Thus, understanding the pathogenesis of neurovascular impairments could lead to novel and efficient preventive strategies. As a result, diagnosis and tracking slight neurovascular changes that are in the early stages of DR are essential.
The tomography/OCTA volumes of optical coherence were obtained covering a 6×6 mm
retinal region and were based on the optic disk. Every volume of 6×6 mm
consisted of 512A scans for the B-scan (24 mm space between adjacent A-shapes) and 512B-scan spaces for scanning by voltage(24 mm spaces between adjacent B-shapes). To detect the motion contrast for OCTA, the optical microangiography(OMAGC) algorithm was used. Both OCTA photography was carried out by professional ophthalmic photographers, who, if possible, repeated the image acquisition to ensure photographs with intense OCT signal penetration and minimal motion artifacts. Scans with an signal-to-noise ratio (SNR) >8 decibels(dB) were considered good quality. The quality ratings for the scans were expressed as SNR in dB over a spectrum of 1 (poor quality) to 10 (excellent quality). Only photographs with a score of ≥8 were considered.
Of these neuronal modifications, the thinning of the retinal nerve fiber layer (RNFL) is an essential feature of the inner retinal layers and is speculated as to the earliest improvement in DR neurodegenerative lesions. RNFL loss leads to defects in various ophthalmological tests, including electroretinograms,contrast sensitivity, dark adaptation, and microperimetry.Optical coherence tomography angiography (OCT-A) is a noninvasive and reproducible imaging procedure that was recently used to study macular and peripapillary vascular structures with unlikely details and clarification
. Early variations in the peripapillary vessel anatomy and vessel density (VD)of the radial peripapillary plexus have been linked to RNFL thinning in patients with DM but without DR
.
The new technique, swept-source OCT (SS-OCT), improves the imaging depth and scanning speed that facilitates anterior segment assessment with corneal graft inspection,
, it allows a precise qualitative and quantitative assessment of vascular improvements in the fundus and presents various application prospects. Additionally, Garway-Heath
constructed a clinical map that relates visual field test points to the regions of the optic nerve head (ONH). The map is valuable in the clinical diagnosis of glaucoma patients and suspects and the research of the connection between retinal light sensitivity and ONH structure. Therefore, we used swept-source optical coherence tomography angiography (SS-OCTA) technology and Garway-Heath map-based ONH measurement software to explore the peripapillary VD, capillary vessel density (CVD), and RNFL thickness changes in early DR.
SUBJECTS AND METHODS
The study was approved by the Shanghai Sixth People’s Hospital Institutional Review Board. All the protocols followed the principles of Helsinki Declaration,and informed consent was obtained prior to participation in the study. The study was registered in the Chinese clinical trial registry (http://www.chictr.org.cn/, Registration number:ChiCTR1900028607). Between October 2020 and March 2021, diabetic patients were recruited from the Shanghai Diabetes Center at the Shanghai Sixth People’s Hospital Affiliated University. Healthy adults were recruited from the same hospital at the same time.
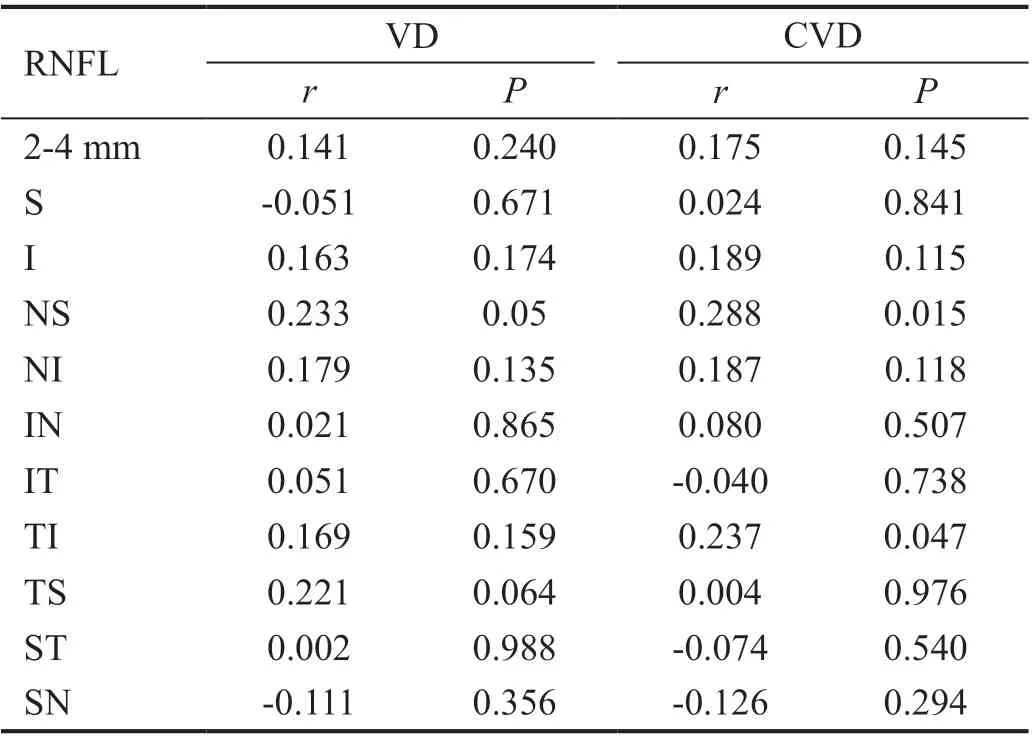
Pearson’s correlation analysis was used to calculate the correlation between RNFL thickness and peripapillary VD and CVD (Table 3 and Figure 5). Furthermore, in diabetic patients,the average RNFL thickness and the mean peripapillary VD and CVD were positively correlated but not significantly(
=0.141,
=0.240;
=0.175,
=0.145). In the correlation analysis of each region, the RNFL thickness in the NS region was positively correlated with peripapillary VD and CVD(
=0.233,
=0.05;
=0.288,
=0.015; Table 3), while in the TI region, the RNFL thickness was positively correlated with peripapillary CVD (
=0.237,
=0.047; Table 3).
All participants underwent ophthalmological analysis, including health history, visual acuity evaluation, biomicroscopy of the anterior segment using a slit lamp, ophthalmoscopy of the posterior segment, wide-field color fundus photography using Optos California (Optos plc, Dunfermline, UK), and Spectralis SD-OCT scans (Spectralis HRA+OCT; Heidelberg Engineering, Heidelberg, Germany). Based on the widefield color fundus photography and the International Clinical Diabetic Retinopathy Disease Severity Scale
, two senior graders (Long D and Cai X) graded each subject’s DR as no DR, mild to moderate, or severe non-proliferative diabetic retinopathy (NPDR), or proliferative diabetic retinopathy(PDR). Each subject had one eye chosen as the research object,and if both eyes matched the eligibility criteria, the eye with higher visual acuity or a lower refractive error was chosen. All the participants were at least 18-year-old, had a logMAR visual acuity of at least 0.5 log units, and a refractive error of no more than -3.00 diopters (D) or +3 D-equivalent spheres. The exclusion criteria were as follows: 1) unable to give informed consent or consent to a full examination; 2) glaucoma, cup/disc(C/D)>0.4, or intraocular pressure >21 mm Hg; 3) pregnant or nursing; 4) active eye infections (such as blepharitis, keratitis,scleritis, conjunctivitis,
); 5) history of ocular disorders that affecting the neural and vascular structures of the eye (ocular trauma, amblyopia, retinal vein occlusion, retinal detachment,macular disease, multiple sclerosis, Alzheimer disease,hypertensive retinopathy,
), and history of ocular procedures other than cataract surgery (laser, intravitreal injections, and vitreoretinal surgery); 6) degree of DR classification greater than moderate NPDR; 7) presence of diabetic macular edema(DME).
为保障淄博市森林防火指挥系统正常运转,确保全市森林防火指挥系统畅通、高效,市森林防火指挥部办公室于11月1日对森林防火通讯指挥系统进行调试,与各区县及市直林场逐一进行信号测试,反复查测通信盲区,重点调试了火情监测、无线通讯等项目,强化各单位之间的连通共享,为实现“纵向贯通、横向互连、实时感知、精确指挥”的一体化指挥体系夯实基础。调试结束后,市森林公安局局长王尊庆对调试情况进行了讲评,对做好下一步防火值班、督导检查、宣传教育、培训演练等工作进行安排部署,并提出了具体要求。
The SSOCT/OCTA device was designed for the central wavelength laser (VG200S; SVision Imager, Henan, China) of 1050 nm with a scan rate of 200 000 A-scans/s. The device was equipped with an eye monitoring tool based on an integrated confocal laser ophthalmoscope for the removal of objects of eye movement. The axial and lateral resolutions were 5 and 13 μm,respectively. The depth of the scan was 3 mm.
Recent studies on DR pathogenesis found that neuronal dysfunction and neurodegeneration are closely associated with microvascular dysfunction and that neurovascular unit degeneration could be regarded as an essential component of DR pathology
. In addition, evidence from diabetic donors’and diabetic animal models’ retinas demonstrated that retinal neuronal cell degeneration or apoptosis develops early in diabetes
.
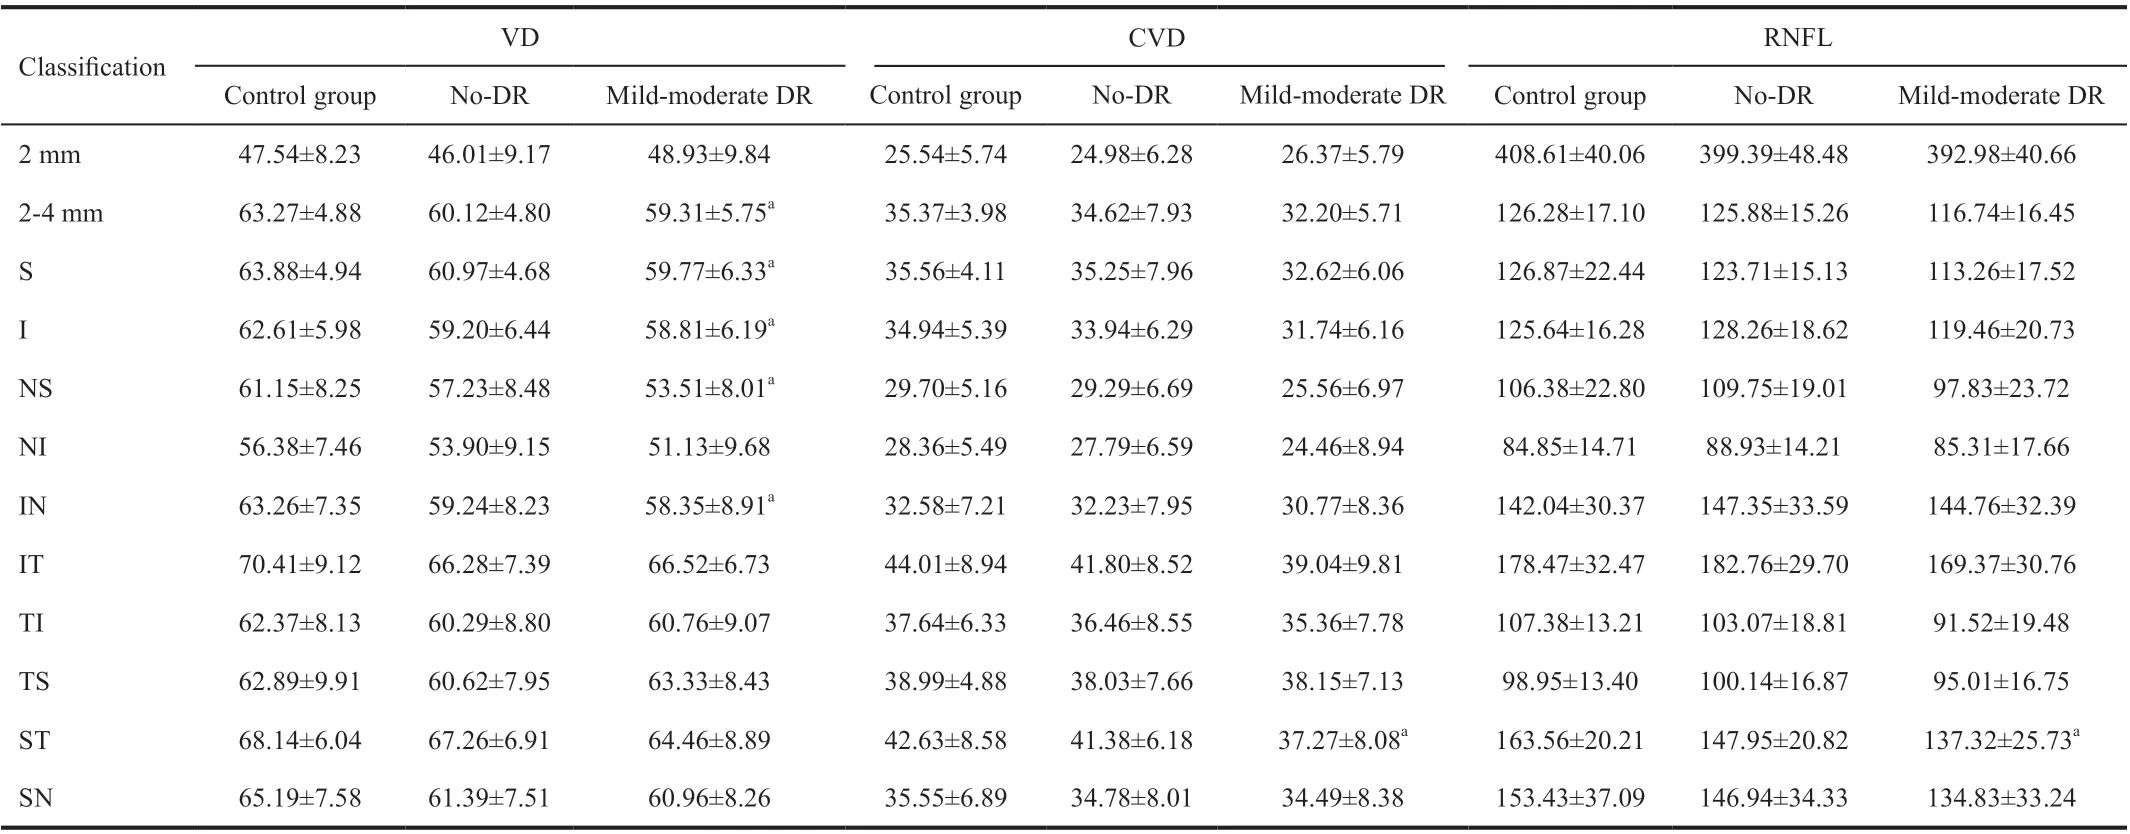
In order to analyze the VD quantitatively in different regions, non-parametric Kruskal-Wallis with Bonferroni’s post hoc test was applied. The statistical results are displayed in Table 2 and Figure 2. In the central ring, the mean VD of the control, no-DR, and mild-moderate NPDR groups was 47.54±8.23, 46.01±9.17, 48.93±9.84, with no significant differences between the groups (
=0.466). In the 2-4 mm circle, significant differences were detected among the three groups (
=0.006). VD in the no-DR and mild-moderate NPDR groups was significantly lower than that in the normal group, but no significant difference was observed between the no-DR and mild-moderate NPDR groups. In the eight regions of 2-4-mm circle, differences were observed in the superior,inferior, NS, and IN quadrants (
=0.007, 0.026, 0.007, and 0.039). Among these, the VD of the mild-moderate NPDR group was lower than that of the control group (
<0.05);however, the difference between the mild-moderate NPDR
no-DR and no-DR
control groups were not significant(
>0.05).
The ONH program installed in the machine assessed the data automatically. The ONH was a 4 mm diameter ring. The middle was a 2 mm circle, and the 2-4 mm circle was separated using nerve fiber flux (NFF) cartographies in eight areas (Garway-Heath
scheme). The eight regions include nasal superior (NS), nasal inferior (NI), inferior nasal (IN), inferior temporal (IT), temporal inferior (TI),temporal superior (TS), superior temporal (ST), and superior nasal (SN). The built-in program was utilized to assess each pattern of the average retinal VD of the inner retina (from ILM-5 mm to IPL/INL+(INL/OPL-IPL/INL)/2) was measured(version1.31.6; VG200D, SVision Imaging Ltd, Henan Province, China). The density of peripapillary CVD was then calculated using the procedure of removing massive blood vessels. Simultaneously, the corresponding RNFL thickness was also calculated (Figure 1).
All data analyses were carried out using the SPSS version 19.0 program (IBM Co., Chicago, IL, USA).The data are presented as the mean±standard deviation (SD)for continuous and categorical variables. One-way variation analysis (ANOVA) was conducted to compare the continuous variables with Bonferroni post hoc tests, independent
-test or Mann-Whitney
test.
test was used to compare the proportions between groups. Pearson’s correlation and multivariable linear regression analysis investigated the correlation between retinal neurodegeneration and intrinsic risk factors. The two-tailed
-values were recorded. To evaluate statistical significance, a 0.05-type I error level was used.
Diabetic microangiopathy is also known as retinal ischemia.One of the lesions in early DR, retinal capillary damage, is not fully formed into a local, visible non-perfusion region but manifests as decreased retinal blood flow density (RVD). It also found that the RVD of eyes with severe NPDR and PDR were significantly lower than those with mild NPDR and the normal control group, and the RVD of the eyes with DME was more significantly reduced
. In the eyes of NPDR without DME, the RVD decreased significantly with the severity of the disease
. Decreased VD in patients with non-DR and mild DR indicated a loss of papillary or lack of perfusion in the early stages of the disease
. In diabetic patients without DR, the superficial and deep decreased compared to healthy participants
. Li
analyzed the VD of 97 DM patients and 48 controls and found that VD was decreased in the diabetic patient group. According to the anatomy, the capillaries in the inner layer of the retina are continuously branched from the central retinal artery that runs from the center of the optic disc. The retinal capillaries are distributed in layers, with the thickest next to the optic disc. Thus, it is speculated that when the retinal ischemic disease shows decreased RVD in the macular area at the end of the blood supply, the peripapillary blood supply should also decrease.The present study demonstrated that the peripapillary VD in diabetic patients decreased, and after removing the influencing factors of large blood vessels, CVD was also decreased.
RESULTS
Based on the inclusion/exclusion criteria, the study included 104 participants (32 controls on health and 72 diabetes patients; 45 males and 59 females),of which 32 comprised the control group, 34 were T2DM without DR (no-DR group), and 38 were mild-moderate DR.The sample participants’ demographic characteristics are summarized in Table 1.
The mean age of the subjects in the three groups was 57.46±9.39y, 63.59±9.69y, and 58.15±10.38y, respectively;the difference was significant among the groups (
=0.112;Table 1). No statistically significant differences were identified in patients’ sex (
=0.953), laterality (
=0.734), visual acuity(
=0.421), and mean spherical equivalent (
=0.685) among three groups. Among the diabetic patients, the comparison[duration of diabetes, fasting blood glucose (FBG), hemoglobin A1c (HbA1c), and glycated albumin] showed that only FBG was significantly different between the mild-moderate NPDR and no-DR groups (
=-2.004,
=0.049).
The repeatability test was carried out for 12 patients with a mean (SD) age of 59.46±6.24 (range: 50-74)y.Among these participants, six had diabetes. The intraclass correlation coefficient (ICC) scores were 0.89 for VD, 0.91 for CVD, and 0.92 for RNFL.
湖南省制图数据的制作很长一段时间都采用先通过GIS软件制作地形数据,再通过制图软件导入地形数据用以制作制图数据这一模式。这种模式减少了格式转换次数,制图数据修改时库体数据不需要返回到原始库体修改。由于制图软件可根据制图规则模板快速生产制图数据,因此制图数据也随着建库数据而自动更新,但建库与出图仍分开进行,这种模式也称为半一体化模式。
F2=3.90×10⁵+3.91×10⁵+1.95×10⁵+1.95×10⁵+2.58×10⁵+2.58×105=16.87×10⁵N


“云南少数民族传统体育发展成就展”将在临沧开展 云南省第十一届少数民族传统体育运动会将于12月4日至13日在临沧举行,期间,云南民族博物馆将推出特展——“云南少数民族传统体育发展成就展”,该展览主要展示云南少数民族传统体育的发展脉络和云南在少数民族传统体育事业方面的工作成就,使观众深切感受到少数民族传统体育项目的魅力。
表2数据显示,国内女性主义翻译研究的主要被引文献多集中于该理论的引介与阐发初期,此间发刊的论文篇数不多,但被引率极高,影响极大。在被引前十的文献中,有9篇属于理论分析文章,被引合计2 077频次,篇均被引230.78次,几乎构成了国内女性主义翻译研究的理论基石,奠定了作者自身在该研究领域的理论话语地位。比如,被引频次最多的一篇是蒋骁华的《女性主义对翻译理论的影响》[3],364次被引中有158条期刊论文引证,说明该文献在同类研究中具有重要的理论基础性、影响力和导向性。
A similar finding was observed in RNFL. The RNFL thickness did not differ significantly in mild-moderate NPDR
no-DR and no-DR
control groups (
>0.05). However, the RNFL thickness in the mild-moderate NPDR group was significantly lower than that in the control group in the ST quadrants(
=0.030; Table 2 and Figure 4).
首先将本文方法所需数据量与文献[5]中基于矩阵分析的方法、文献[10]中基于GFFT的方法和文献[11]中基于Gröbner基改进的GFFT方法进行对比,m取值为3~8,仍然选取与图4中相同的6种RS码进行研究,且每种RS码对应误比特率分别为0.02、0.01、0.005、0.002、0.001和0.0004.本文方法在各种条件下所需数据量可由式(32)获得;对于文献[5]中方法,其分析矩阵必须满足行数大于列数,因此所需数据量至少为m2n2;基于GFFT的方法至少需要50组完整码字,相应的数据量为50mn.最终,得到对比结果如表4所示.可以看出,相同条件下本文方法所需数据量更小.
Furthermore, we estimated the changes in peripapillary CVD after removing large blood vessels. The sectored analyses of each CVD in the ONH grid are shown in Table 2 and Figure 3.In the 2-4 mm circle, the mean CVD did not differ significantly among the control, no-DR, and mild-moderate NPDR groups(
=0.117). In the eight regions of the 2-4 mm circle, no significant differences were detected in the ST quadrants(
=0.018). In addition, the CVD of the mild-moderate NPDR group decreased significantly compared to the control group(
<0.05).
著名哲学家黄克剑先生提出教育的终极目标——生命化教育:人的道德的自我完善,心灵的自我督责,人格的自我提升,境界的自我超越。大家知道,孩子的认识是立体的、全面的,但是在传统课堂中,学科是孤立、自成体系的。基于此,在中学语文教学中,抓住课堂主阵地,利用网络信息技术,充分利用校内外资源,探索与实践“一课双师”语文教学模式,开阔学生视野、扩散学生思维、发展学生能力,促进教育资源的均衡发展,提高中学语文教学质量,实现生命化教育。
DISCUSSION
This study was based on the Garway-Heath map to explore the changes in peripapillary VD, CVD, and RNFL thickness in the early stage of DR. Consequently, we found that functional and structural impairments had already begun in the early stages of DR. Correlation research analysis demonstrated a correlation between neural and vascular structures.


Garway-Heath
produced a clinically useful map that related the visual field test points to ONH regions. The map in this analysis was asymmetric, representing the location of the ONH above the horizontal meridian. Paracentral and arcuate regions of the visual field are defined by sectors in proximity to the poles of the ONH in the map. Subsequently, a peripapillary RNFL thickness map was used in the study by Tan
.to derive nerve fiber trajectories in the peripapillary region,and an over nerve fiber tracking algorithm was presented. The study devised a system to construct the NFF map and quantify it by track and sector in any test subject. On peripapillary OCT scans, the NFF tracks and sectors matched the typical nerve fiber trajectory over a wide area, potentially allowing efficient detection of focal damage and precise quantification of regional loss
. Therefore, in the current study, the measurement based on the ONH topographic map accurately detected the neural and vascular structural changes in early DR.
4)采用云计算方式进行数据处理。随着导航应用的进一步深入,数据量越来越庞大,数据关系更加复杂,应采用云计算的方式快速处理和提供信息。
These results were in line with the above theoretical speculation,
, the VD in the mild-moderate DR was significantly lower than in the normal control group, thereby suggesting that clinical examination should focus on whether the VD of DM patients can detect meaningful ischemic manifestations at the early stage.
When the large retinal vessels around the disc were removed,we found that in the ST area, the peripapillary CVD and RNFL thickness in the mild-moderate NPDR group was lower than that in the normal group, indicating a positive correlation.From an anatomical point of view, the macular area and the surrounding retina converge toward the optic disc in arcs on the upper and lower sides of the macular optic disc axis, and hence, the optic nerve and blood vessels in the supratemporal and infratemporal positions of the optic disc are denser than those in other parts
. After removing the large blood vessels, the changes in blood flow around the supply disc were observed accurately, and significant changes were detected in the blood vessels and nerves around the optic disc of DR,which were investigated further.
The superficial capillary layer at the optic disc, especially the radial peripapillary capillaries (RPC) blood vessels, run parallel to the direction of the nerve axons. The blood vessels are straight and lacking a large amount of intervascular anastomosis; also, the tolerance to hypoxia and injury was poor. However, the dense nerves in the superior and IT quadrants lead to high oxygen demand, thereby effectuating the cause of structural changes in the optic nerve that is susceptible to hyperglycemia
.
The current results do not show how the progression of DR(DME and PDR) affects the peripapillary VD. Since macular edema distorts OCTA segmentation (which is critical for accurate measurements) and falsely increases peripapillary RNFL thickness, these factors are pre-specified as exclusion criteria
. In addition, panretinal photocoagulation and focal laser therapy are linked to declining RNFL thickness independently
. Therefore, if we recruited such patients, we would introduce uncontrollable confusion.
Nevertheless, the present study has a few limitations. First, this was a cross-sectional observational study. Thus, the association between improvements in peripapillary VD and development in the early-stage DR could be explained by longitudinal analysis. Second, the sample size was limited and insignificant to draw reasonable conclusions. Third, with the built-in program of the computer, we analyzed the microvasculature using a 4×4 mm
scan pattern. The RPC that supplies an RNFL blood flow extends to 8 mm from the optical disk temporal tip.Thus, a wide area for scanning the modifications of the VD could be useful
.
In conclusion,
the measurement based on the ONH topographic map may be more accurate than the traditional four-classification method. The peripapillary VD, CVD, and RNFL decreased in early DR, the changes in RNFL thickness were correlated with the CVD and/or VD in some regions. The current study provides mechanistic insight into DR, demonstrating functional and structural impairments around the optic disc in early DR and a correlation between these conditions. Furthermore, to validate the usefulness of peripapillary outcomes as biomarkers of early DR, longitudinal studies are warranted.
Supported by College-level Project Fund of Shanghai Jiao Tong University Affiliated Sixth People’s Hospital (No.ynlc201909).
None;
None;
None;
None;
None.
1 Lee R, Wong TY, Sabanayagam C. Epidemiology of diabetic retinopathy, diabetic macular edema and related vision loss.
(
) 2015;2:17.
2 Olafsdottir E, Andersson DK, Dedorsson I, Svardsudd K, Jansson SP,Stefansson E. Early detection of type 2 diabetes mellitus and screening for retinopathy are associated with reduced prevalence and severity of retinopathy.
2016:94(3): 232-239.
3 Kim K, Kim ES, Yu SY. Longitudinal relationship between retinal diabetic neurodegeneration and progression of diabetic retinopathy in patients with type 2 diabetes.
2018;196:165-172.
4 Duh EJ, Sun JK, Stitt AW. Diabetic retinopathy: current understanding,mechanisms, and treatment strategies.
2017;2(14):e93751.
5 Simó R, Stitt AW, Gardner TW. Neurodegeneration in diabetic retinopathy: does it really matter?
2018;61(9):1902-1912.6 Antonetti DA, Klein R, Gardner TW. Diabetic retinopathy.
2012;366(13):1227-1239.
7 Nian S, Lo ACY, Mi YJ, Ren K, Yang D. Neurovascular unit in diabetic retinopathy: pathophysiological roles and potential therapeutical targets.
(
) 2021;8(1):15.
8 Gardner TW, Davila JR. The neurovascular unit and the pathophysiologic basis of diabetic retinopathy.
2017;255(1):1-6.
9 Simó R, Simó-Servat O, Bogdanov P, Hernández C. Neurovascular unit: a new target for treating early stages of diabetic retinopathy.
2021;13(8):1320.
10 Yang JH, Kwak HW, Kim TG, Han JS, Moon SW, Yu SY. Retinal neurodegeneration in type II diabetic otsuka long-Evans tokushima fatty rats.
2013;54(6):3844-3851.
11 Li ST, Wang XN, Du XH, Wu Q. Comparison of spectral-domain optical coherence tomography for intra-retinal layers thickness measurements between healthy and diabetic eyes among Chinese adults.
2017;12(5):e0177515.
12 Altmann C, Schmidt MHH. The role of microglia in diabetic retinopathy:inflammation, microvasculature defects and neurodegeneration.
2018;19(1):E110.
13 Spaide RF, Klancnik JM Jr, Cooney MJ. Retinal vascular layers imaged by fluorescein angiography and optical coherence tomography angiography.
2015;133(1):45-50.
14 Spaide RF, Fujimoto JG, Waheed NK, Sadda SR, Staurenghi G.Optical coherence tomography angiography.
2018;64:1-55.
15 Vujosevic S, Muraca A, Gatti V, Masoero L, Brambilla M, Cannillo B, Villani E, Nucci P, De Cillà S. Peripapillary microvascular and neural changes in diabetes mellitus: an OCT-angiography study.
2018;59(12):5074-5081.
16 Garway-Heath DF, Poinoosawmy D, Fitzke FW, Hitchings RA.Mapping the visual field to the optic disc in normal tension glaucoma eyes.
2000:107(10): 1809-1815.
17 Wilkinson CP, Ferris FL III, Klein RE, Lee PP, Agardh CD, Davis M, Dills D, Kampik A, Pararajasegaram R, Verdaguer JT,. Proposed international clinical diabetic retinopathy and diabetic macular edema disease severity scales.
2003;110(9):1677-1682.
18 Tan O, Liu L, Liu L, Huang D. Nerve fiber flux analysis using widefield swept-source optical coherence tomography.
2018;7(1):16.
19 Kim AY, Chu ZD, Shahidzadeh A, Wang RK, Puliafito CA, Kashani AH. Quantifying microvascular density and morphology in diabetic retinopathy using spectral-domain optical coherence tomography angiography.
2016;57(9):OCT362-OCT370.
20 Sambhav K, Abu-Amero KK, Chalam KV. Deep capillary macular perfusion indices obtained with OCT angiography correlate with degree of nonproliferative diabetic retinopathy.
2017;27(6):716-729.
21 Forte R, Haulani H, Jürgens I. Quantitative and qualitative analysis of the three capillary plexuses and choriocapillaris in patients with type 1 and type 2 diabetes mellitus without clinical signs of diabetic retinopathy: a prospective pilot study.
2020;40(2):333-344.
22 Dimitrova G, Chihara E, Takahashi H, Amano H, Okazaki K.Quantitative retinal optical coherence tomography angiography in patients with diabetes without diabetic retinopathy.
2017;58(1):190-196.
23 Li ZJ, Alzogool M, Xiao JH, Zhang S, Zeng P, Lan YQ. Optical coherence tomography angiography findings of neurovascular changes in type 2 diabetes mellitus patients without clinical diabetic retinopathy.
2018;55(10):1075-1082.
24 Yu PK, Balaratnasingam C, Xu J, Morgan WH,
Label-free density measurements of radial peripapillary capillaries in the human retina.
2015;10(8):e0135151.
25 Campbell JP, Zhang M, Hwang TS, Bailey ST, Wilson DJ, Jia Y, Huang D. Detailed vascular anatomy of the human retina by projection-resolved optical coherence tomography angiography.
2017;7:42201.
26 Yang HS, Woo JE, Kim MH, Kim DY, Yoon YH. Co-evaluation of peripapillary RNFL thickness and retinal thickness in patients with diabetic macular edema: RNFL misinterpretation and its adjustment.
2017;12(1):e0170341.
27 Lee HJ, Kang TS, Kwak BS, Jo YJ, Kim JY. Long-term effect of panretinal photocoagulation on spectral domain optical coherence tomography measurements in diabetic retinopathy.
2017;42(8):1169-1173.
28 Huang T, Li XL, Xie J, Zhang L, Zhang GR, Zhang AP, Chen XT, Cui Y, Meng QL. Long-term retinal neurovascular and choroidal changes after panretinal photocoagulation in diabetic retinopathy.
(
) 2021;8:752538.
29 Reddy SV, Husain D. Panretinal photocoagulation: a review of complications.
2018;33(1):83-88.
30 Mammo Z, Heisler M, Balaratnasingam C,
Quantitative optical coherence tomography angiography of radial peripapillary capillaries in glaucoma, glaucoma suspect, and normal eyes.
2016;170:41-49.
猜你喜欢
电脑爱好者(2020年19期)2020-10-20
书屋(2020年9期)2020-09-23
校园英语·下旬(2019年8期)2019-10-07
软件导刊(2018年3期)2018-03-26
新民周刊(2016年2期)2016-03-07
新民周刊(2015年50期)2015-12-29
新民周刊(2015年44期)2015-09-10
新民周刊(2015年38期)2015-09-10
科技与创新(2014年11期)2014-08-21
商场现代化(2009年16期)2009-06-22
 International Journal of Ophthalmology2022年9期
- International Journal of Ophthalmology的其它文章
- Clinical analysis of bilateral acute depigmentation of the iris: first reported case in China
- Interferon-gamma release assays in tuberculous uveitis:a comprehensive review
- Ocular stem cells: a narrative review of current clinical trials
- Different compression sutures combined with intracameral air injection for acute corneal hydrops
- Comparison of intravitreal aflibercept and dexamethasone implant in the treatment of macular edema associated with diabetic retinopathy or retinal vein occlusion: a Meta-analysis and systematic review
- Reproducibility of macular perfusion parameters in nonproliferative diabetic retinopathy patients by two different OCTA sweep modes