
A single dual-mode gas sensor for early safety warning of Li-ion batteries: Micro-scale Li dendrite and electrolyte leakage
2022-11-21 09:28WenjunYan闫文君ZhishenJin金志燊ZhengyangLin林政扬ShiyuZhou周诗瑜YonghaiDu杜永海YulongChen陈宇龙andHoupanZhou周后盘
Chinese Physics B 2022年11期
Wenjun Yan(闫文君) Zhishen Jin(金志燊) Zhengyang Lin(林政扬) Shiyu Zhou(周诗瑜)Yonghai Du(杜永海) Yulong Chen(陈宇龙) and Houpan Zhou(周后盘)
1School of Automation,Hangzhou Dianzi University,Hangzhou 310018,China
2Provincial Key Laboratory of Advanced Chemical Engineering Manufacture Technology,College of Chemical and Biological Engineering,Zhejiang University,Hangzhou 310027,China
3Institute of Microelectronics,University of Macau,Avenida da Universidade,Taipa,Macau,China
Li dendrites and electrolyte leakage are common causes of Li-ion battery failure. H2, generated by Li dendrites,and electrolyte vapors have been regarded as gas markers of the early safety warning of Li-ion batteries. SnO2-based gas sensors, widely used for a variety of applications, are promising for the early safety detection of Li-ion batteries, which are necessary and urgently required for the development of Li-ion battery systems. However,the traditional SnO2 sensor,with a single signal,cannot demonstrate intelligent multi-gas recognition. Here,a single dual-mode(direct and alternating current modes)SnO2 sensor demonstrates clear discrimination of electrolyte vapors and H2,released in different states of Li-ion batteries,together with principal component analysis(PCA)analysis. This work provides insight into the intelligent technology of single gas sensors.
Keywords: gas sensors,single dual-mode,multivariable sensors,Li-batteries,early safety warning
1. Introduction
To alleviate ever-growing energy consumption, electrochemical energy storage technology has been a topic of wide concern in recent years.[1,2]In particular,lithium(Li)-ion batteries (LIBs) have dominated both electronics and automotive applications due to their high energy density and reduced cost.[1,2]Unfortunately, LIB safety issues have emerged due to the flammable organic electrolytes and the intrinsic thermal properties during charge and discharge,which could result in explosion and casualties.[3–6]For the development of largescale LIB energy storage equipment,effective safety warnings,as early as possible,are necessary and urgently required.
The current battery management system (BMS) is regarded as a crucial LIB protection system, which can detect the voltage, state of charge (SOC), and external surface temperature of the battery cell. However, the BMS is unable to detect LIB safety issues in the early stages.[1,4]For example,the external voltage of a leaking battery could be kept at almost the same level as that of a pristine battery for several hours.[4]As reported, special gas detection of LIBs could detect LIB safety issues at an earlier stage.[1,4]In particular, H2, generated by the reaction of Li dendrites with a polymer binder,could be captured first, and over 10 min earlier than smoke and fire,in cases of LIB failure.[1]Furthermore,LIB failure is often associated with electrolyte leakage.[6,7]The main components of the LIBs’electrolyte are volatile and redox neutral solvents, such as dimethyl carbonate(DMC), diethyl carbonate(DEC),ethyl methyl carbonate(EMC)and propylene carbonate(PC).[4,8]
As is well known, semiconductor sensors have been widely used for various hazardous and flammable gases in the internet of things (IoT) due to their high sensitivity, simple mechanism and real-time response.[9,10]However, selectivity has always been the bottleneck of semiconductor gas sensors,and further limits the recognizability and intelligentization of individual sensors. Combining sensors into arrays is a common method used to mitigate the poor selectivity of sensors,with up to thousands of individual sensors.[11]Obviously,sensor arrays cannot fulfill the convenience of sensors well.
Recently, new multivariable gas sensors have been reported.[12,13]These multivariable sensors involve a sensing material and a multivariable transducer,to provide diverse and independent responses to different gases and to provide multigas recognition and rejection of interferences.[14,15]The measurable response signals of chemi-electrical sensors include current, capacitance, and resistance/impedance. In contrast to the single signal of DC resistive sensors, AC impedance sensors can provide a multidimensional response over a fitted frequency range, which results from the further extraction of parameters, including the dielectric constant, charge transfer resistance, double-layer capacitance and diffusion constant,and are attracting increasing attention.[6,16–18]AC sensors are characterized not only by low cost and a simple device configuration,but also by different frequencies producing various signals.[6]
Herein,we use DC–AC dual mode to detect organic electrolytes and H2possibly venting from the failed LIBs, taking a SnO2-based sensor as an example. Multi-sensing parameters extracted from the DC current,as well as AC impedance,and the corresponding phase angle,dissipation factor and frequency data,are comprehensively analyzed. According to the principal component analysis (PCA) of multi-sensing parameters, clear discrimination of electrolyte vapors(DEC,DMC,and PC)and H2is proved,which could improve the accuracy and reliability of the LIBs’early safety warning system.
2. Experimental details
2.1. Material preparation and characterization
The SnO2-based sensing material here was prepared by following Ref. [19]. Typically, 500 g of as-received SnO2micro-powder(2–5 μm in diameter,Jinxin Advanced Materials,China)was mixed with 1425 g deionized water under magnetic stirring, followed by addition of 75 g triethanolamine(Usolf Chemical, China)as a dispersant. Stirring and dispersion continued for 10 mins. Next,the mixture was ball-milled(WG-1L,Vgreen Nanometer Technology,China)for 2 h with balls 300 μm in diameter to produce a uniform dispersion. Finally, 1 g of tetraamminepalladium nitrate (H12N6O6Pd, Aladdin, China) was added to 12 g of the as-obtained dispersion. Consequently,the acquired stable nano-dispersion,with a solid content of 15%,was the Pd-dopped SnO2material utilized for this work.
The morphologies of the as-prepared material were characterized using scanning electron microscopy (SEM, FEI Nanosem 430).Powder x-ray diffraction(XRD)analyses were performed on a Bruker D8 Advance diffractometer with CuKαradiation(λ ≈1.54 ˚A).
2.2. Gas sensing experiment design
A schematic of the bare sensor device with a pair of interdigital electrodes(IDEs)integrating a microheater is shown in Fig. S1a (supporting information). The microheater was fabricated based on silicon micro-electromechanical system(MEMS) technology, reported in our previous work.[20]The fabrication details are also described in the supporting information.The typical relationship of the heating temperature vs.the applied voltage of the microheater is shown in Fig. S1b.The complete sensor device was fabricated by facile dropcoating. Afterwards, the device was heated and maintained at 300°C for 7 days to promote SnO2deposition and device aging to obtain reliable testing data.
The gas sensing tests were performed using a homemade system with an 8-L test chamber, as reported in our previous work.[21]For the analyte sensing test,a fitting concentration of the analyte(standard H2gas of 10×10-6mol/mol,and DMC,DEC and PC vapor) was injected into the chamber. All the sensing tests were taken at ambient temperature of about 25°C and 40%relative humidity,adjusted by an air conditioner and a humidifier. The heating temperature of the microheater was precisely controlled using a bias voltage applied by a Keithley 2602B source-meter. The sensor DC and AC signals were collected by a Keithley 2602B source-meter and a Keysight 1732C LCR meter, respectively. Principal component analysis(PCA)was calculated using the inbuilt library function of Python.
3. Results and discussion
3.1. Material analysis
The SEM image in Fig. 1(a) shows the homogeneity of the as-prepared SnO2powder. The XRD pattern of the asprepared SnO2is shown in Fig. 1(b). Due to the tiny Pd additive, no obvious Pd peaks are detected. All the peaks are assigned to SnO2of tetragonal rutile (JCPDS No. 41-1445).The obvious peaks at 2θ= 26.7°, 33.9°, and 38°correspond to the (110), (101), and (200) planes of SnO2, respectively.Furthermore, the SnO2grain size is~30–40 nm, calculated according to the XRD data.
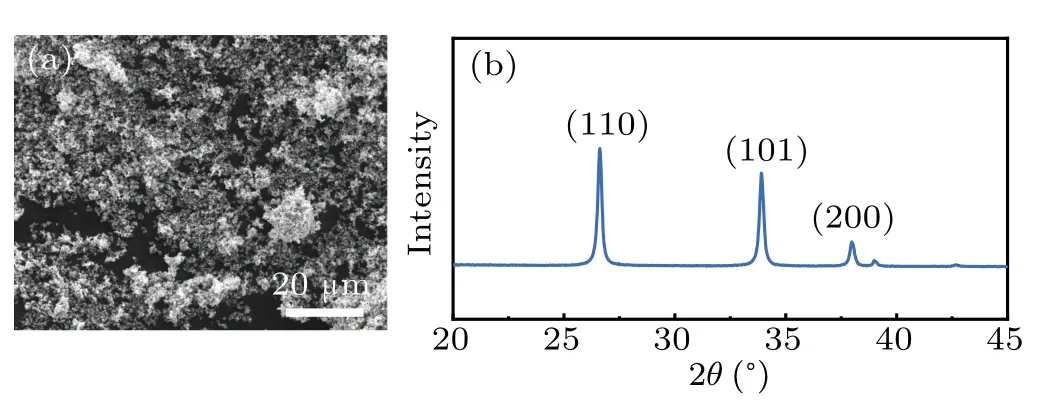
Fig.1.(a)An SEM image,and(b)the XRD pattern of the as-prepared SnO2 powder.
3.2. Gas sensing characteristics
We chose DEC,DMC,PC and H2as analyte gases,which are mainly produced by failed Li batteries. And the gas sensing performances were investigated via the DC current signal,AC impedance,θand D signals at different frequencies. A similar AC signal response of an IDE sensor device has been reported in our previous work.[22]Figure 2 shows the relative DC and AC signal variations of one sensor device to various analyte concentrations(200,160,120,80,40,and 20 ppm of DEC,DMC,and PC,respectively;200,150,100,50,10,and 5 ppm of H2).

Fig.2. Continuous response characteristics to different gases. DC current relative change(I/I0)to a)DEC,(b)DMC,(c)PC and(d)H2. AC impedance relative change(Z0/Z)at the frequency of 100 Hz to(e)DEC,(f)DMC,(g)PC,and(h)H2.AC impedance relative change(Z0/Z)and θ relative change(θ0/θ) at the frequency of 1 kHz to (i) DEC, (j) DMC, and (k) PC. AC impedance relative change (Z0/Z), θ relative change (θ0/θ), and D relative change(D/D0)at the frequency of 10 kHz to l)DEC,(m)DMC,(n)PC,and(o)H2. Here, I0 (Z0, θ0 and D0)and I (Z, θ and D)are the sensor DC current(AC impedance,phase angle,and dissipation factor)in ambient air and the real-time value in analyte gas,respectively.
Under DC mode,upon exposure to each analyte,the sensor current increases rapidly, and then decreases back to the original baseline when the analyte is off. DEC, DMC, PC and H2are all electron donors. Each of the analytes adsorbed on the n-type SnO2surface could contribute electrons to the conduction band of SnO2, leading to an increase in the concentrations of the majority of electron carriers, consequently increasing the current of the SnO2device.
Under AC mode at the frequency of 100 Hz, only an impedance response could be detected for each analyte. Notably, at AC frequency of 1 kHz, both impedance and phase angle (θ) responses to DEC, DMC, and PC are obvious, but no responses to H2. At AC frequency of 10 kHz, all the impedance,θ, and dissipation factor (D) responses to DEC,DMC, and PC are excellent, while only an impedance response to H2could be detected. Interestingly, the sensor impedance decreases quickly when exposed to each analyte,at different AC frequencies, and then quickly increases back to the original baseline when the analyte is off. Moreover,the phase angle has the same response and recovery trend, while theDhas the opposite response and recovery trend to each analyte. A detailed explanation will be given in the following section.
Figure S2 shows that the gas response values increase as each analyte concentration increases. According to reported electrochemical gas sensors,the response could be empirically linearly expressed as[23]

whereCrepresents the analyte concentration,andaandbare constants, depending on the type of gas sensor and sensing material. Figure 3 displays linear plots of logarithms of the response value as a function of the logarithms of each analyte concentration under different modes,except for the impedance response to H2at 10 kHz. A similar linear relationship is seen in a previous report.[24]The relative parameters(slope, intercept, andR2) of each fitting equation are summarized in Table 1.
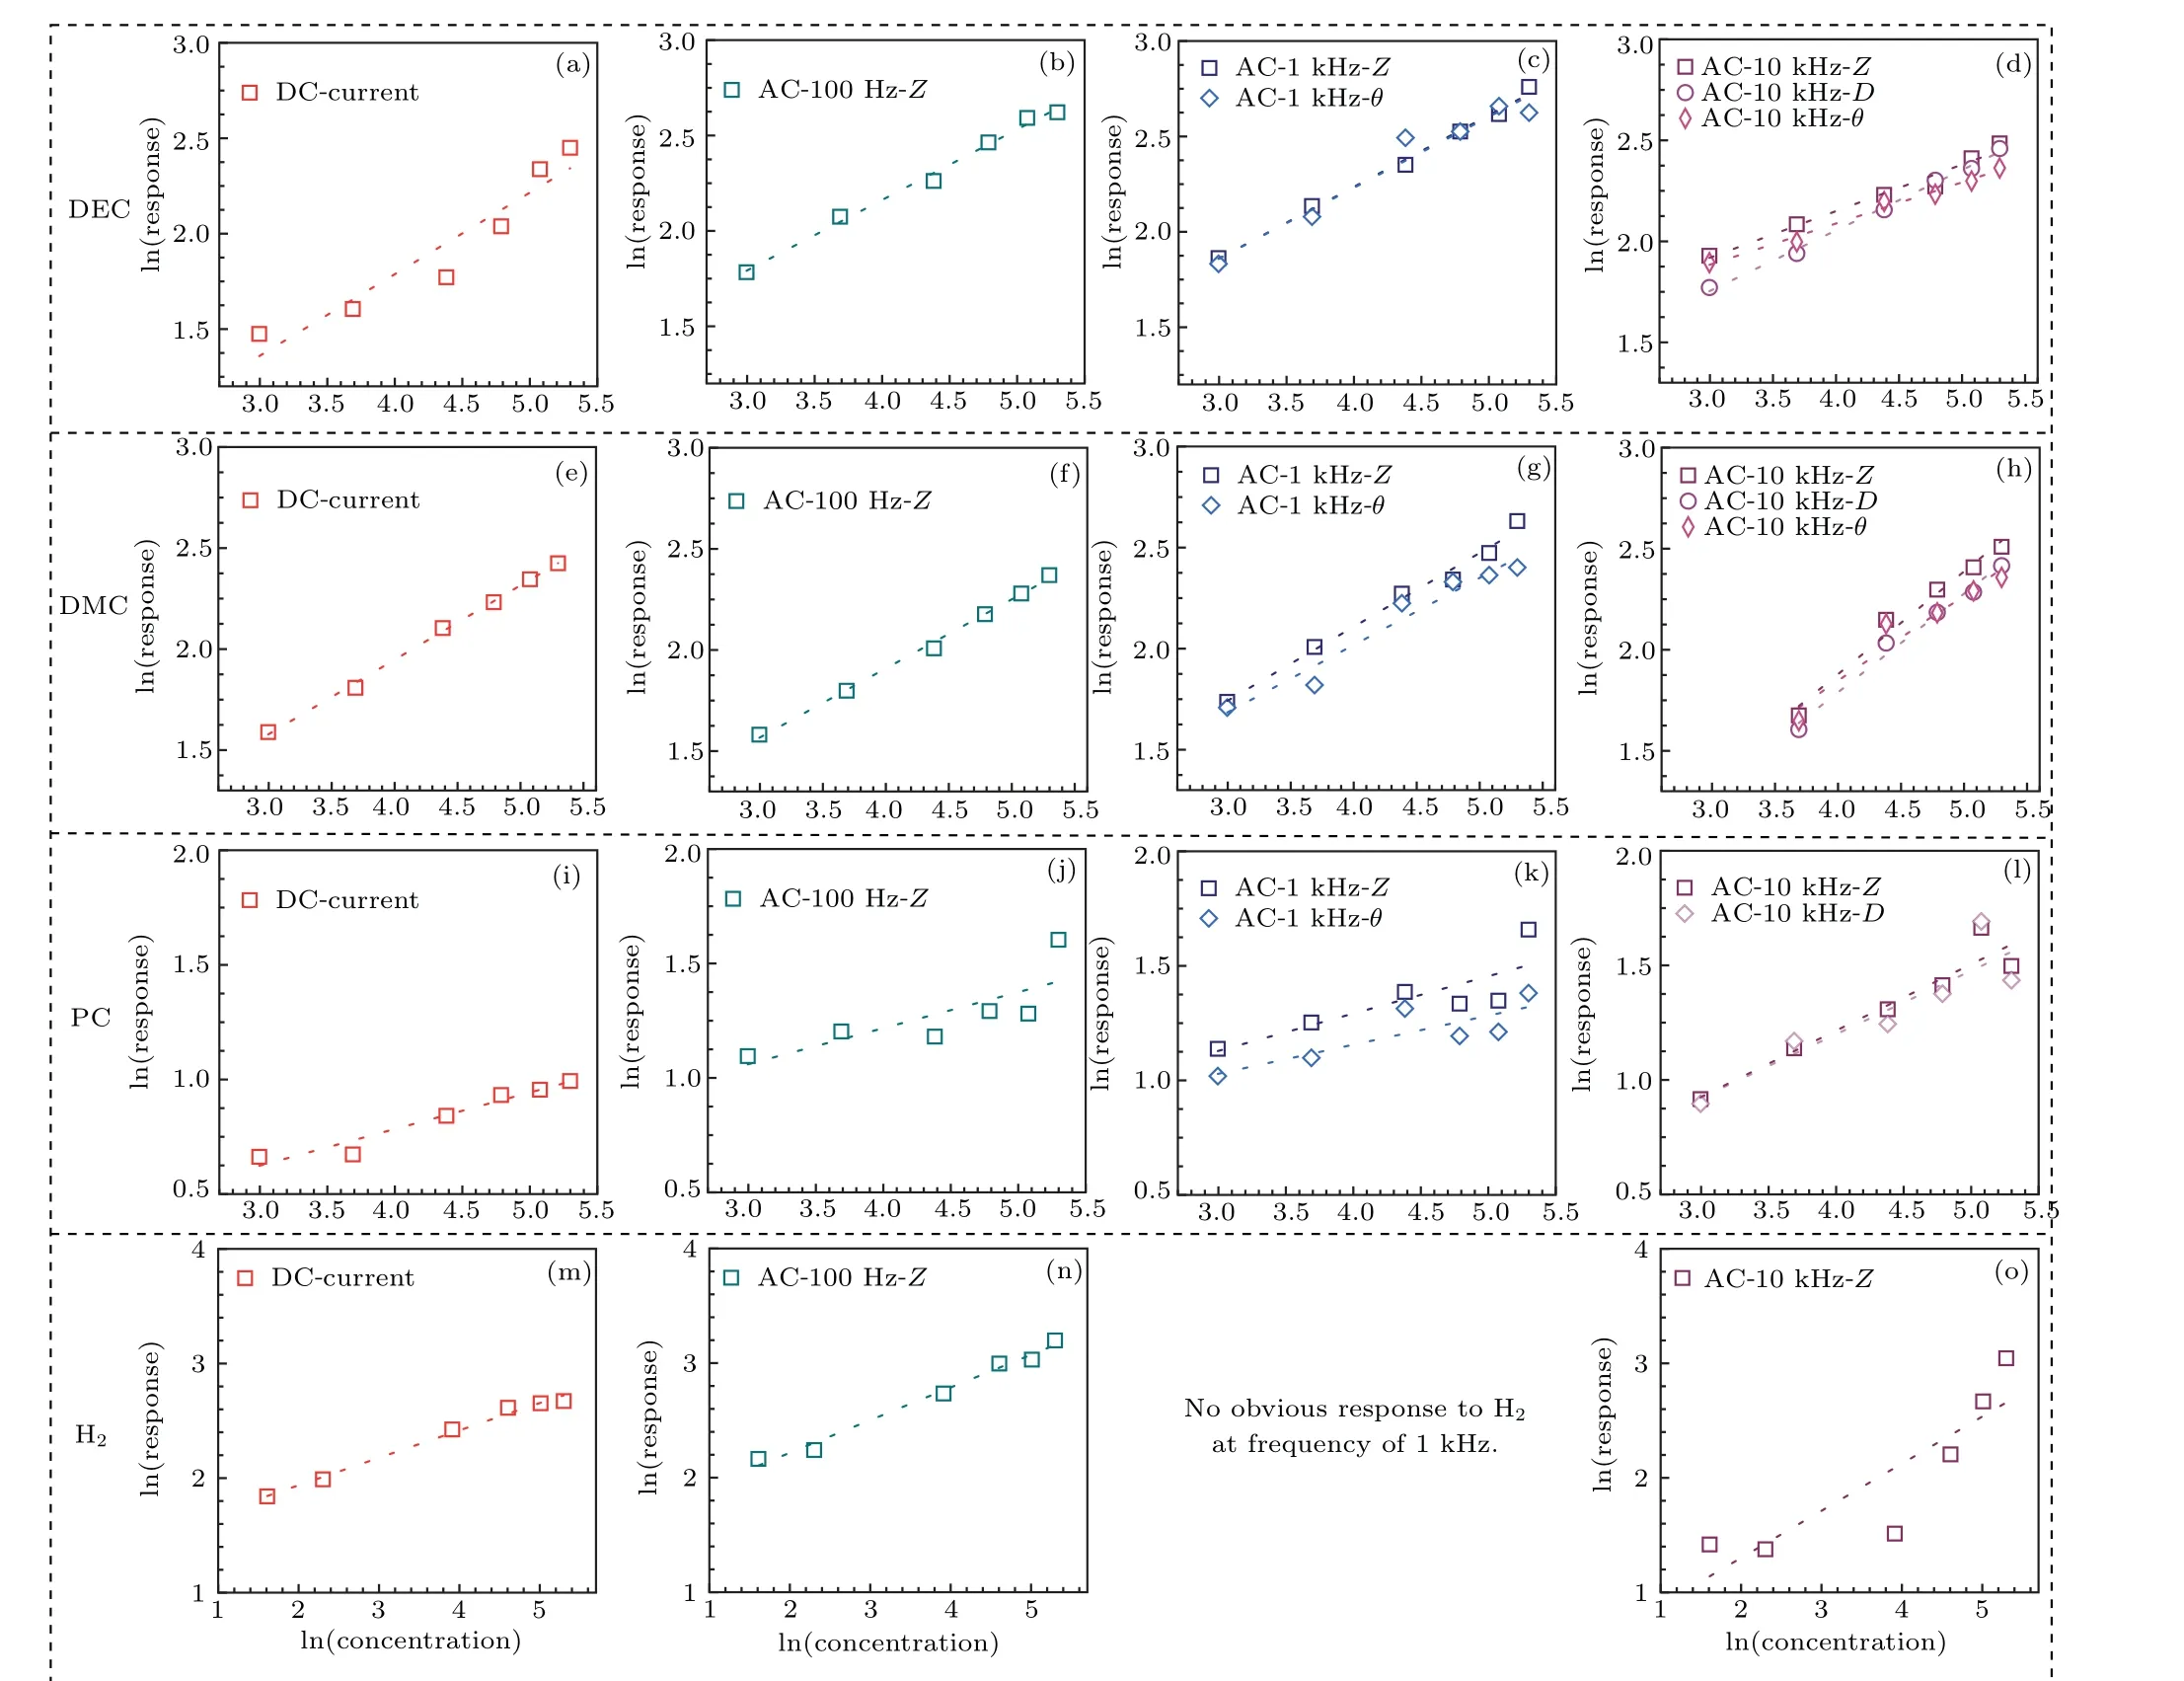
Fig.3. The relationship of response values vs. concentration in logarithmic terms for different gases. DEC:(a)DC current, (b)AC impedance at the frequency of 100 Hz,(c)AC impedance and θ at the frequency of 1 kHz,(d)AC impedance,θ and D at the frequency of 10 kHz. DMC:(e)DC current,(f) AC impedance at the frequency of 100 Hz, (g) AC impedance and θ at the frequency of 1 kHz, (h) AC impedance, θ and D at the frequency of 10 kHz. PC:(i)DC current, (j)AC impedance at the frequency of 100 Hz, (k)AC impedance and θ at the frequency of 1 kHz, (l)AC impedance, θ and D at the frequency of 10 kHz. H2: (m)DC current,(n)AC impedance at the frequency of 100 Hz,(o)AC impedance,θ and D at the frequency of 10 kHz. The symbols are response values;the lines are the fitting of response values vs. concentration.

Table 1. Slope,intercept,and R2 values of the fitting equations of response vs. concentration for different gases under DC and AC dual modes.
Moreover,a comparison of response values to different analytes(200 ppm DEC,DMC,PC,and H2)under different modes is shown in Fig. 4. Obviously, for different signal modes, the selectivity of the sensor to the various analytes is different. The different selectivity enables various analyte recognition using one device.

Fig.4. A comparison of response values towards different gases under DC and AC modes(200 ppm DEC,DMC,PC and H2).
In contrast to the operating principle of the DC current mode, the AC responses (includingZ0/Z,θ0/θ, andD/D0)are closely related to not only the conductivity of the sensing layer,but also the permittivity of the sensing material and analytes.[12]The equivalent circuit of the SnO2sensor with IDEs could be simply regarded as a typical Randles circuit,as depicted in Fig.5.Here,R1andC1represent the time-constant resistance and capacitance of the SnO2layer,respectively.The parallel circuit element(R2‖C2)corresponds to the resistance and capacitance of gas-dependent interfaces,which dominate the AC responses of the device.[12,25]The Warburg impedance,ascribed asZw,is as a result of the gas diffusion process,and only observed in the low-frequency regime(<10 kHz).[25–27]The imaginary and real parts of impedance can be described by
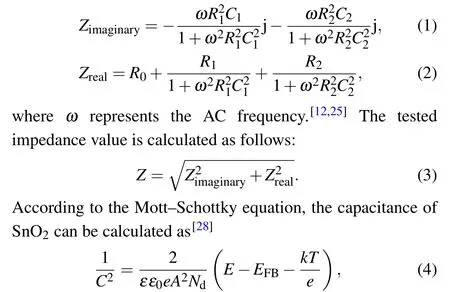
whereεis the relative permittivity (dielectric constant),ε0is the vacuum permittivity,eis the electron charge,Ndis the majority carrier concentration,Eis the applied electrical potential,kis the Boltzmann constant,andTis the absolute temperature.
The phase angle (θ) can be calculated by the following equation:

Upon exposure to the analytes of electron donors, under AC modes, electrons will contribute to the SnO2surface due to analyte adsorption,and will result in a decrease in the gasdependent interface resistanceR2. Beyond this,changes in the dielectric properties of analyte-dependent interfaces in a fixed frequency could also contribute to the impedance responses,according to Eqs. (1)–(4). The permittivities of DEC, DMC,PC and H2are 2.805, 3.107, 64.92 and 1, respectively.[29]Based on reports, the gas-dependent interface capacitanceC2mainly relies on the dielectric constants of analytes.[25,30]Hence,C2has no significant effect on the AC responses of SnO2to DEC and DMC, due to their low permittivities. But for PC with high permittivity,C2generates an obvious AC response improvement,except for theθresponse at 10 kHz.
Fig. 5. The AC equivalent circuit of the SnO2 sensor. R0 represents phase constant contact resistance. The parallel circuit element(R1‖C1)represents capacitance and resistance of the SnO2 sensing layer. The parallel element(R2 ‖C2) is the equivalent resistance and capacitance of the analyte-gasdependent interface. The Warburg impedance is described as the Zw.
Furthermore, the only detectedZresponse to each analyte at 100 Hz indicates that electronic resistance properties of gas-dependent interfaces mainly controls the sensing response. When the frequency increased to 1 kHz, an obvious capacitance effect appears, resulting in the detectedZandθresponse;when the frequency further increased to 10 kHz,an additionalDresponse could be detected with more capacitance effect(Figs.2–3).
Interestingly, the impedance response of H2at 100 Hz was increased dramatically compared to the DC current response, although the permittivity of H2is also small. According to previous reports, it is proposed that the chemical species induced by H2adsorption enhances the AC impedance response at the low frequency of 100 Hz, via generation of a polarization potential in the H2–SnO2interface.[12,31,32]When the AC frequency increases to 1 kHz, no AC impedancerelated parameter responses to H2could be detected. A similar sharp response decrement with the frequency increasing has previously been reported.[31,32]When the AC frequency further increases to 10 kHz,quick diffusion of H2plays an important role,with more capacitor effects(Zw)due to the small molecular size, resulting in a non-linear impedance response to concentration.
3.3. Principal component analysis
PCA is a commonly used effective method in exploratory data analysis and classification. In the present work, differences in the various parameter responses to each analyte provide the possibility of multi-gas recognition based on one device. Utilizing Python and the PCA function in the Sklearn Library,the database was projected into a 2D plane.Visualization in a two-dimensional graph in Fig.6 reveals that the electrolyte vapors and H2are actually and clearly discriminated.The mathematic derivation in the PCA code is attached in the supporting information. The cumulative variance of the principal components of over 97%(PC1 90.48%and PC2 6.52%)indicates that the major information is maintained from the raw database.

Fig.6. (a)PCA-assisted classification and regression of electrolyte vapors(red dots)and H2(black dots). (b)Nine characteristic values of the covariance matrix for PCA.
4. Conclusions
In summary, smart and clear classification of electrolyte vapors and H2has been realized using a single common SnO2sensor,by combining DC current signals and AC impedancerelated signals.Due to the dielectric properties of analytes,the SnO2sensing layer, and the analyte adsorption on the SnO2surface, diverse sensing parameters were obtained under DC and AC dual test modes, which enable the single sensor to build signature-difference patterns for tested gases via PCA analysis. The accurate distinction of electrolyte vapors and H2would contribute to the monitoring of the operating conditions of LIBs. This robust method for the classification and recognition of various chemical vapors using an individual device paves the way toward applications in intelligent identification of multi-gas with very few sensors.
Acknowledgements
This research was supported by the Zhejiang Science and Technology Foundation(Grant No.LQ20F040006).
The authors acknowledge L. M. for help with the SEM and XRD characterizations. Yan W.J.acknowledges the 2011 Zhejiang Regional Collaborative Innovation Center for Smart City.

- Chinese Physics B的其它文章
- A design of resonant cavity with an improved coupling-adjusting mechanism for the W-band EPR spectrometer
- Photoreflectance system based on vacuum ultraviolet laser at 177.3 nm
- Topological photonic states in gyromagnetic photonic crystals:Physics,properties,and applications
- Structure of continuous matrix product operator for transverse field Ising model: An analytic and numerical study
- Riemann–Hilbert approach and N double-pole solutions for a nonlinear Schr¨odinger-type equation
- Diffusion dynamics in branched spherical structure