
英国诺福克郡,盖伍德流域生态系统服务的估价
2011-12-08 06:02谢韵
湖南师范大学自然科学学报 2011年1期
谢 韵
(东英吉利大学环境科学系,诺里奇,英国,NR4 7TJ)
英国诺福克郡,盖伍德流域生态系统服务的估价
谢 韵*
(东英吉利大学环境科学系,诺里奇,英国,NR4 7TJ)
盖伍德河是一条稍长于13 km的河,起始于诺福克的乡村,从金斯林流向北海的港口流出.为评价盖伍德河流域内池塘生态系统服务价值的变化情况,采用地理资讯系统比较了该流域内历史的和现在的地图以找出过去50年内的变化,然后通过实地考察来验证地理资讯系统的结果;在文章末尾说明了本研究中所面临的一些困难.分析结果表明近50年来该流域池塘受到的影响是正面的,然而在该流域中也有一些池塘的质量是相对贫乏的.
池塘;变化;评价;生态系统服务
Sustainable Urban and Rural Fringe(SURF)is an EU-funded project,aims to realize the value of the urban fringe,the areas of landscape which link urban and rural environments,and then manage a sustainable urban fringe.Urban fringes are recognised as valuable place which can provide a high quality environment.In Norfolk, this project is focused on the Gaywood RiverValley eastof KingsLynn from September2009 to August2012.In order to help serve the town's Growth Point status,Department for Environment Food and RuralAffairs(DEFRA)has recently selected the Gaywood Valley SURF as one of four national pilot projects for assessing the use of an Ecosystem Services approach as a means of planning and agreeing future changes.Gaywood River is little more than 13 km's long from its sources in rural Norfolk to its entry into the North Sea through the port of King's Lynn.King's Lynn as a town and the Gaywood Catchment in particular are at risk from flooding.The problems in King'sLynn are not unique.During high tide no water can flow out and at same time if it is the time of high rainfall,King'sLynn is at a high risk of flooding.In the lower reaches,much of the Gaywood River itself has been straightened and deepened to help the water to flow quickly off the surrounding far mland.This adds to the potential risk of large volumes ofwater arriving at King'sLynn quickly during high rain fall.In the history of Gaywood River catchment,there aretwo serious floods occurred.One is in the 1930s and the second time is the 1970s,the area surround Gaywood had suffered heavy loss in these two t imes.The area of Gaywood hydrometric catchmentwill be showed in figure 1.

Figure 1 Gaywood Hydrometric Catchment
The Gaywood Valley SURF project has six subprojects,flood-risk management,economic part,landscape transfor mation,and so forth.Thismanuscript focuseson the area of valuation ecosystem services(VES)of in Gaywood River catchment.While pond isone of the most valuable features in this area,the focusof thiswork ismoved to evaluate the changes of ecosystem services of ponds during the past years.Ponds cannot only benefit environment,but also contribute to human in many aspects.Moreover,in the case of Gaywood River,flood control can be compatible with ponds.Because most of ponds had an inflow but no outflow;additionally,ponds have certain water storage capacity,they contribute to the flood mitigation when the flood occurred.In this project area,there are almost 100 ponds;therefore,this area has a great deal of value.Although,ponds have great ecologic function and recognized social and economic uses,pond ecosystems are threatened by both climate change and human activities. That is to say,this great value might be changed a lot in the past years.
1 M ethodology
1.1 Geographic I nformation System s
GIS is a very importantmethod used in thisproject,especially,map selection and comparison are the key features in this study.In the aspect ofmap choosing,the modern map we used is called Ordnance Survey(OS)Maste rMap,the nationalmapping agency for Great Britain.OSMaste rMap is a definitive,consistent and maintained framework for the referencing of geographical information in Great Britain.It was created by the ordnance Survey and has been maintained since 2001.OSMasterMap is a modern production;it is easy to shift the map from lines to colorfulmap and vice verse.In order to show the land cover type directly,symbology definition called land code was imported into OSMaste rMap.Different land cover types have different land codes,then added different colors in land codes.In order to show the situation in detail,each land cover type is categorised by several other cover type.In this study the land codes and the corresponding symbolswill be showed in the table 1[1].
From table 1,it is clear that“”stand for inland water,both river and ponds in the study area.That is to say,this symbol is the most important element in this study.Therefore,it is easy to make sure the land cover types and the location of ponds.The figure 2 shows the project area in the OSMaste rMap.
In te rms of historic map,we choose a website which named digimap(http://edina.ac.uk/digimap/)as a source of historic maps.The best option for historic map is the 1st imperial edition(1948—1977).The scale for thismap is 1∶10 560.
ArcGIS is the sof tware used for comparing maps and measuring the changes in the past years.The figure 3 shows the changes in the past 50 years.Area which fulfilled with symbol like“”is the pond which has larger size than before.In contrast,the area“”represents that place is the pond which is decreased or disappeared.
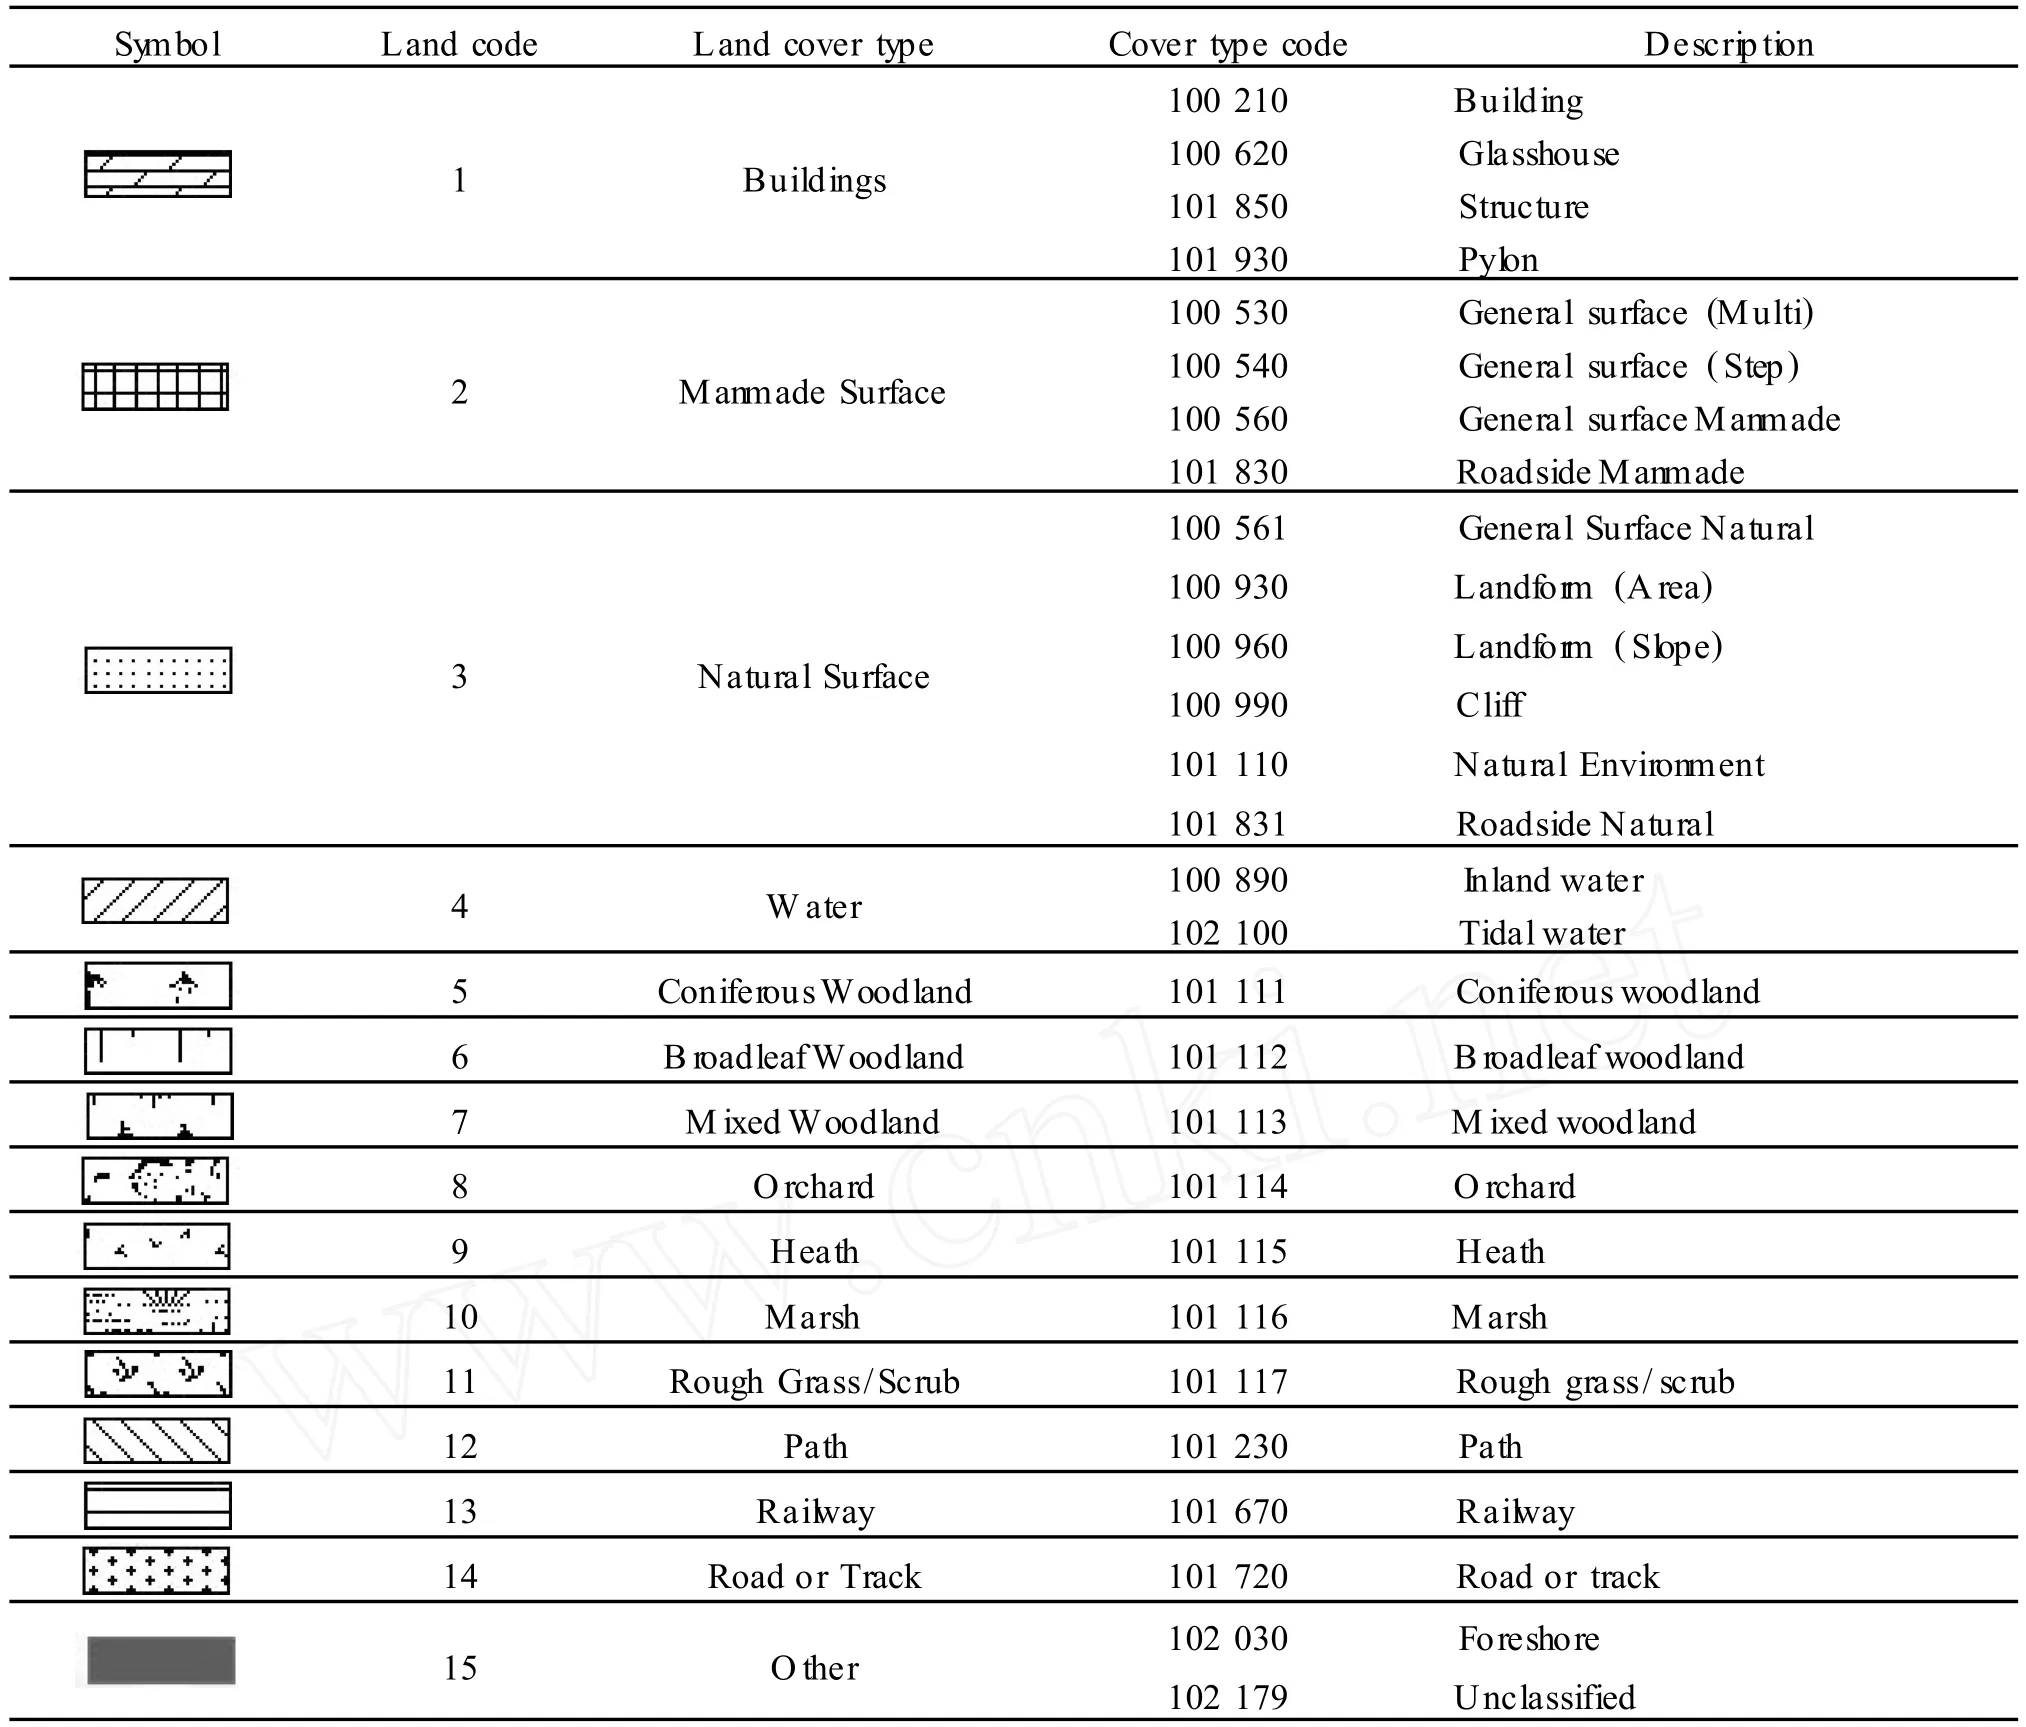
Table 1 Relationship be tween colors and land codes
1.2 Ecosystem Service Approach(ESA)
This project is using Ecosystem ServicesApproach to analysis the situation in the Gaywood River.Ecosystem services approach is associated with human's life in many aspects.Meanwhile,valuation of ecosystem services is important because such valuesmay influence public opinions and policy decisions.
Ecosystem Service Approach is the primary method used in this project.Ecosystem services contribute to human beings in two aspects;one is generating income of people,the other is preventing the risk of both natural risk and man-made hazard.In the past 50 years,with the changes of land uses,ecosystem services have significant changes in Gaywood River catchment.In order to assess the extent that changes benefit people,it is necessary to valuing all aspects of ecosystem services.The Millennium Ecosystem Assess ment(MEA)(2005)has adopted a particular typology and framework to cover ecosystem services.They are based on four categories of services:supporting services,provisioning services,regulating services,and cultural services.Meanwhile,each type has its own subhead of services.Table 2 shows the detail of common subtitles in all the four categorises[2].
In practice,table 2 also can be used as the checklist for the conditions of all the ponds in the study area. VES is the processof assessing the contribution of ecosystem services to meeting a particular goal or goals.The valuation is given in monetary terms as benefits in pounds per hectare per year(£·hm-2·a-1)using the following equation:
TotalValue(V)of Ecosystem ServicesESin£·hm-2·a-1for ecosystem typekisV(ESk),

In ter ms of value in various elements,“Valuation England's Terrestrial Ecosystem Services”providesmonetary values for ecosystem services across England's terrestrial ecosystems.Different land uses have different values.The report coversmost of value in Gaywood River catchment.By usingArcGIS,it is easy to know the size ofponds lostor grow.Then municipal value and size of certain land uses,the total value can be calculated.
1.3 Uncerta inty
GIS is a very useful tool because it can handle spatial data in ways that are precise,rapid,and sophisticated. However,in ter ms of data gathering,there are still some problems.Uncertainty is one of the serious problems people should pay attention;meanwhile,uncertainty is also inevitable.
In this project,historic map and currentmap do not line up perfectly.Scale and out of date are the two main reasons caused this phenomenon.On one hand,scale has significant effects on the quality of map matching.Scale and resolution are intimately related because there is a lower l imit to the size of an objectof an object that can be usefully shown on a papermap.A convenient rule of thumb is that positionsmeasured from maps are subject to error of up to 0.5mm at the scale of themap.Multiplying this by the scale of themap gives the corresponding distance on the ground.The table 3 below shows the relationship between scale and resolution for some common map scales[3].

Table 2 MA categories of Ecosystem Services and examples(DEFRA,2007)

Table 3 Scale and resolution for some common map scales(Goodchild.et al,1993)
Asmentioned before,the scale of selected maps is 1∶10 560;so the min imum resolution is 10 560×0.5 mm, or 5.28 m.That is to say,the error between 5 meters to 10 meters is available.
One the other hand,out of date is also a reason to illustrate the uncertainty.Like all measurements,spatial data have levels of accuracy that are limited by the measuring devices used.The map we used as a comparison is from year 1958,put it s imply,it is from 50 years ago.In that time of period,the mapping technology is not very precise.Consequently,the historic map has certain errors.
2 Data analysis and discussion
2.1 Results
In ter ms of land uses,there is a significant change of ponds,almost all the ponds have proportion of area changed to other land cover type like woodland,farmland,grassland,and vice verse.
The following two maps show the overall conversion in the catchment.Figure 4 is the lost area ponds;put it briefly,the area which was a pond or a part of pond in years ago,but disappeared or reduced to a smaller size in some year between 1958 and 2000.In thismap,“”represents the lost or reductive ponds.Because of the limitation of the picture size,lost or reductive ponds are too small to notice.Each number in the picture stands for a reductive size pond.Symbol like“”in the figure 5 outlines the shape ofpondsorpartsof pondswhich convert from other land cover types.Number on each pond is the“Object ID”for each area.Object ID is the own number for one specific object in one layer in the OSMaste rMap.It is helpful for distinguishing each pond in the GISmap.Whilst the table 4 illustrates the real situation of the ecosystem services in three kindsof land use which around ponds and the situation of ponds by field work.

Figure 4 The overall situation of lost or reductive ponds

Figure 5 New ponds or extension parts of ponds

Table 4 The overall situation of ponds in Gaywood River Catchment
W ith the infor mation supported by GIS and verify by field work,there are four kinds of land cover types in the pond zone,including ponds.The relevant prices for different ecosystem services are listed in the table 5.Most of the values are from“A Valuation of England Terrestrial Ecosystem Services”[4].
From the table 5,the annual value of ES forwoodland,far mland,grassland and pond is£1 078.18 hm-2· a-1,£456.43 hm-2·a-1,£290.44 hm-2·a-1,and£1 245.64 hm-2·a-1,respectively.In the table 5, prices are not comprehensive cover all services;and even prices have been showed in the table,there are still some uncertainties around them when doing the valuation.The results for them are not very accurate.This manuscript will explain these vacant data in the later paragraphs.
By comparing two maps and verifying by field work,some results can be found.First of all,the current total value in this area is easy to be calculated.The annual value of ES for ponds is£1 245.64 hm-2·a-1.The area of ponds,the overall size of inland water,is 467 434 m2.
So the total valueV(ESP)ofESfor ponds is:

That is to say,the total annual value for all the ponds in this study area is£58 225.45/a.Because it is impossible to know the exact yearwhich pond or part of pond is lost or gained,the unit for value is pounds per year. Noticeably,four objects in the study area are changed to artificialwater body such as pool.Artificialwater body is completely different from ponds,especially in the aspectof biodiversity and flood prevention.Additionally,in terms of recreation they have much higher values than ponds.In these circumstances,the artificialwater body can not be treated as ponds.That is to say,it is not feasible to use the same value on the artificialwater body.In the calculation,the size of artificialwater body was subtracted from the overall size.Furthermore,use the same formula,the changed value of ponds change to woodland,farmland and grassland is£-800.37/a,£-20 115.78/a,and£-1 000.93/a,respectively.The negative numbermeans the value of Ecosystem Service in this area losing certain value every year since the ponds changed to woodland,far mland or grassland.Moreover,and the changed value for woodland,farmland,and grassland change to ponds is£1 543.21/a,£28 222.36/a,and£1 251.18/a.It is clear from the data above that the annual net profit increased in this area.

Table 5 The value of ecosystem services in different land cover type
2.2 Big changes
The biggest landscape changes occurred in Bawsey Warren which located in the south west of the Gaywood River catchment.In this area,ponds did not exist in 1958;they are completely converted from other land cover types:woodland and grassland.The Object ID for these ponds,from left to right,is 821,891,896,907,953, and 527,respectively.Noticeably,these ponds are the six top biggest size water bodies in the study area.The size for them is 178 555 m2(821),94 322 m2(891),7 843 m2(896),28 129 m2(907),10 951 m2(953),and 45 255 m2(527).Additionally,only pond 891 has a s mallwater body in 1958.In otherwords,almost all thesewaterholding areas did not exist in 50 years ago.This site located be tween larger areasofwoodland and a substantial area of restored mineralworkings atBawsey to the south(Norfolk County Council,2010).The big changes area which enclosed by black line is in the left bottom of the map showed in figure 6.
The origin of ponds is diverse,as they can be created by a wide range of natural processes and human activi-ties.In the cases ofBawseyWarren,the occurrence of ponds is mainly because of quarry.The British Industrial Sand pits atLeziate(also known asBawsey orBawseyWarren)occupy a very large area;in this place,sands are of great purified and are therefore used in glass industry[5].The history of quarry can be traced to 1830s.“People had got great quantities of grey sand in Bawsey,and then they sent sands to the glass in various parts of the Kingdom in 1830”[6].Even now,quarry is ongoing in this area,thisprocess is definitely har mful to the quality of these ponds.The silica sands are quarried extensively around Bawsey formanufacture of glass.Due to the reason of quarry,a great deal of sand was taken out,and then water(e.g.rain and flood)has flowed into the low-lying areas to make a pond.This area should be under protection regardless of the cause of formation.Although they are the six biggest ponds in GIS data,the actual size of them ismuch smaller than that in the OSMaste rMap.Quality is also one of the most important issues forprevail valuation.Water qualitiesof them are found to be poor based on the data from field work.Moreover,the qualitiesof buffer zone around these ponds are also bad,some places even do not have buffer.In these circumstances,government should investmore money in this area.

Figure 6 The big changes area
Human behaviors are themain reasons caused depression of quality of ponds inBawsey.However,in this area,some otherponds also need protection.Ponds are potentially vulnerable to degradation caused by awide range of factors.In the study area,many ponds surrounded by far mland;more seriously,some of them are too small to discover during the field survey.In order to protect the great value,pond monitoring and management should be carried out.
2.3 Analysis Gaps
2.3.1 GIS data Data quality is a key component of any spatial data used in a GIS.In ter ms of spatial data,a great number of components of data quality can be identified,including accuracy,precision,consistency and completeness aswell as a number of d imensions,including space,time and theme[7].This study also has some problems.First of all,the historic map can not reflecty the situation perfectly.This ismainly because of the colormonotony,historic map just use s imple symbols and black lines to outline boundaries of different land types.Itmakes much harder for ensuring the land uses in years ago.Further more,the historicmap do not line up perfectlywith the current situation.So measuring changed size is not accurate by comparing historic and current maps.Finally,OS Maste rMap has also some deficiencies.In this study,information from OSMaste rMap is not up to data.Few ponds are significant smaller than that in the map;and shape is also changed.This demerit enlarged real value formostof ponds in this study area.
2.3.2 Valuation Value for each ES is a very important factor in this study.There are two kinds of goods:mar-ket and non-market,both of them have certain values.Market goods,namely,they have marketed prices.So,it is easy to calculate.For the non-market goods,there are severalways to measure the environmental impacts into monetary value.Noticeably,most services are non-market goods,so the valuation of them can not be the exactly the same with reality.W illingness To Pay(WTP)is the main method to value non-market products.Conversely,without an actualmarket place,statedWTP may not equate to whatwould actually be paid.Although there are many methods to value ecosystem services,some values are still hard to be worked out,such as values from supporting services.Supporting services can be argued that the value of supporting services is infinite as without them there would be no other servicesof final benefits[4].Valuation in supporting services has theworstperformance.Supporting service is necessary for the production of all other ecosystem services.These services provide an‘infrastructure’service that is necessary in some way to realise all of the final benefits.This does not mean that supporting services should not be considered aspartof an overall Ecosystem Approach nor should it be taken to suggest that the benefits accrued by these services have no value to society.On contrast,without supporting services,other services will not exist anymore.However,because this kind of service is very abstract and do not benefit people directly, it is hard to value them.At thismoment,the relevance of these services is typically realized through the other ecosystem services;therefore,it is hard to assess them.The thinking as to whether supporting services can be incorporated into an Ecosystem ServicesApproach is still at an early stage[8].In addition,there are still other problems to be solved when doing the valuation,like lacking infor mation ofmarket price.
3 Conclusion
This study is using GIS for the spatial visualization of different land cover types surrounded ponds,then using valuation ecosystem services as an approach to assess the value that ponds created.Step one:compare historic and currentmaps to figure out changes in the Gaywood River catchment;Step two:fieldwork to check the correctnessof changes;Step three:evaluate changesofponds in the past 50 years.In thisproject,GIS as a support tool andVES as an assess ment have great contributions.
Analytical results illustrate the current situation in Gaywood River Catchment,and also reflect the benefits from ponds in monetary ter ms.In the year of 2000,all the ponds in the study created 58 225.45 pounds.That is to say,pondsper se have great value in ecologic terms.However,the analyticalprocess also demonstrates that both GIS and ESA have certain drawbacks in the current stage.
[1] W ILL IAMS P J,B IGGS J,BARR C J M.1998:Lowland ponds survey final peport[M].Oxford:Department of the Environment,Transport and the Region,1996.
[2] DEFRA.An introduction guide to valuing ecosystem services[M].London:DEFRA,2007.
[3] GOODCH ILD M F,PARKS B O,STEYAERT L T.Environmental modeling with GIS[M].New York:Oxford University, 1993.
[4] O'GORMAN S,BANN C.Valuing england's terrestrial ecosystem services a report to defra[R].2008.
[5] Norfolk County Council[EB/OL].2010-07-05/2010-07-18.http://norfolk.jdi-consult.net/ldf/readdoc.php?docid= 7&chapter=3#topofdoc.
[6] NEWBY P,BR ISTOW M.Genuki:Norfolk:Genealogy[EB/OL].2004-06-20/2010-07-12.http://oringins.org.uk/genuki/ NFK/places/b/bawsey/white1845.sh tml.
[7] GOODCH ILD M F,MAGU I RE D J,RH IND D W.Geographical infor mation systems:principles,techniques,management and applications[M].New Jersey:JohnW iley and Sons,2005.
[8] RANGANATHAN J,RAUDSEPP-HEARNE C,LUCAS N.Ecosystem services:a guide for decision makers[M].London: DEFRA,2008.
Valuation of Ecosystem Services in the Gaywood Valley,Norfolk
X IE Yun*①
(Department of Environmental Sciences,University of EastAnglia,Norwich,United Kingdom,NR4 7TJ)
The Gaywood is a river littlemore than 13 km's long from its source in ruralNorfolk to its entry into the North Sea through the port of KingsLynn.In order to evaluate the ecosystem services changes of ponds in Gaywood River catchment,Geographic Information Systems(GIS)was used to compare historic map and currentmap to find out the changes in the past 50 years.In addition,some field work was conducted to verify the resultsof GIS.Moreover,some challengesof this studywere illustrated in the end.The main findings derived from the analysis suggest that the effects on ponds in this area are positive in the past 50 years.However,the quality of some ponds in the river catchment is relatively poor.
ponds;changes;valuation;ecosystem services
P941.78
A
1000-2537(2011)01-0086-10
2010-10-26
*通讯作者,E-mail:xy1990060120@hotmail.com
(编辑 王 健)
猜你喜欢
中国水土保持(2022年6期)2022-06-08
中国水土保持(2021年7期)2021-07-08
——庆祝湖南农业大学草业科学系建系20 周年
作物研究(2021年2期)2021-04-26
中国水土保持(2021年12期)2021-04-11
儿童故事画报(2020年6期)2020-08-31
基础医学与临床(2018年1期)2018-02-13
水利规划与设计(2018年1期)2018-01-31
科学中国人(2017年36期)2017-06-09
小天使·一年级语数英综合(2016年7期)2016-05-14
小天使·一年级语数英综合(2015年8期)2015-07-06
