Proximate and ultimate factors that promote aggregated breeding in the Western Sandpiper
2011-12-25 06:39MatthewJohnsonJeffreyWalters
Zoological Research 2011年2期
Matthew Johnson, Jeffrey R Walters
(Department of Biological Sciences, Virginia Polytechnic Institute and State University, Blacksburg, VA 24061, USA)
Proximate and ultimate factors that promote aggregated breeding in the Western Sandpiper
Matthew Johnson*, Jeffrey R Walters
(Department of Biological Sciences, Virginia Polytechnic Institute and State University, Blacksburg, VA 24061, USA)
We report that Western Sandpipers (Calidris mauri) on Alaska’s Yukon-Kuskokwim River Delta exhibited aggregated breeding behavior at a relatively small spatial scale. Prior to clutch initiation, males performing song flight displays on a 36 ha plot were aggregated as were subsequent initial nesting attempts on the plot. We tested three hypotheses commonly invoked to explain aggregated breeding in territorial species (social mate choice, predation, and material resources hypotheses), and found support for the material resources hypothesis, as dispersed individuals were more often associated with tundra habitat patches, and aggregated individuals nested more often in undulating-tundra habitat patches compared to patch availability. The pattern of habitat occupancy conformed to an ideal despotic distribution with aggregated nesting birds in undulating-tundra patches experiencing lower reproductive success. On our study plot, older, more aggressive males solicited females more often, and defended larger, more dispersed sites in tundra habitat patches, compared to younger, less aggressive males that were aggregated in undulating-tundra habitat patches. Breeding aggregations are often concentrated on or near a critical resource. In contrast, Western Sandpiper breeding aggregations occur when dominant and/or older individuals exclude younger, subordinate individuals from preferred habitat. Although many taxa of non-colonial birds have been reported to aggregate breeding territories, this is the first quantitative report of aggregated breeding behavior in a non-colonial monogamous shorebird species prior to hatch.
Calidris mauri;Space use; Reproduction; Despotic distribution; Material resources hypothesis
Breeding aggregations have been observed in numerous aquatic and terrestrial animals including fish (Itzkowitz, 1978), insects (Muller, 1998; Sumpter & Broomhead, 2000), reptiles (Stamps, 1988), primates(Treves, 2000), and birds (Stamps, 1988; Muller et al, 1997). Presumably, animals aggregate when the benefits of doing so exceed the costs of social interaction. The benefits of joining a breeding aggregation may be either resource-based, where (in birds) individuals select habitats that offer foraging opportunities or safe nesting sites (natural selection), or driven by sexual interactions and mate choice (sexual selection hypotheses, Tarof & Ratcliffe, 2004; Tarof et al, 2005). Mechanistic and evolutionary processes that result in avian breeding aggregations have most often been studied among colonial nesting species where nesting and is the primary activity within the aggregation, and among lekking species where only mate choice and reproduction occur (reviewed by Bradbury & Gibson, 1983, Brown & Brown, 2001). Among colonial nesting species, potential costs of nesting in close proximity to conspecifics (increased levels of: resource competition, intraspecific brood parasitism, nest predation, and parasite transmission) appears to be offset by direct benefits including increased food finding efficiency (material resources hypothesis, Kiester & Slatkin, 1974; information center hypothesis, Wittenburger & Hunt, 1985), reduced predation due to group defense or the dilution effect (predation hypothesis, Hamilton, 1971), or increased opportunities for extra-pair copulations (hidden lek hypothesis, Wagner, 1997). Among lekking species, theory on the evolution and maintenance of aggregative behavior suggests individuals aggregate in response to: the patchy distribution of ecological factors (e.g. display sites or predators, material resources and predation hypotheses), the patchy distribution of conspecifics (males cluster in areas where females tend to be found, low-quality males cluster around high-quality males), or because females prefer aggregations of males (social mate choice hypothesis; Allee, 1951; Darling, 1952).
Aggregation of multi-purpose breeding territories is another common form of spatial structure in animals, and occurs when individuals establish territories in close proximity to conspecifics which results in clusters of territories in apparently homogeneous breeding habitat (Tarof & Ratcliffe, 2004). Study of breeding aggregations among socially monogamous avian species (>90% worlds’ species; Lack, 1968) has revealed that the spatial distribution of breeding activities is most often correlated with optimal displaying/nesting habitat, areas with high food availability, low predation risk, and species specific foraging and reproductive strategies (material resources, predation, and hidden lek hypotheses; reviewed by Hildén(1965), Cody (1985) and Morse (1989); but see Tarof & Ratcliffe (2004)). Monogamous avian breeding aggregations offer a manageable natural system for testing alternative hypotheses explaining the relative influence of social and environmental factors on the spatial distribution and behavior of individuals. Avian breeding behavior is typically observable, aggregations can be measured accurately and habitat characteristics can be quantified with reasonable effort. Shorebirds (Charadriiformes) exhibit some of the most elaborate and overt breeding displays of any avian group (Miller, 1985). The 24 species of sandpiper in the subfamily Calidridinae (Charadriiformes, Scolopacidae) exhibit every described mating system, with territoriality and mating strategy sometimes varying within a species (Oring, 1982). Studies of intra- and inter-specific variation in calidridine sandpiper social systems have contributed greatly to understanding the evolution of social behavior (Pitelka et al, 1974; Miller, 1979; Oring, 1982; Oring & Lank, 1985). The study of calidridine sandpiper spatial structure offers an opportunity to extend our understanding of how ecological and social factors affect the distribution of breeding animals.
During six years of study in Western Alaska (1999−2001, 2003−2005), we observed apparent aggregation of initial nesting attempts by a territorial calidridine sandpiper, the Western Sandpiper (Calidris mauri, Fig. 1). Western Sandpipers are socially and genetically monogamous (i.e., extra-pair paternity is rare) and exhibit biparental care of eggs and young (Holmes, 1971, 1973; Blomqvist et al, 2002). After arriving on the breeding grounds, males establish territories on upland tundra habitat that are defended against conspecifics, from which territorial males advertise for mates using species-specific displays (Brown, 1962; Holmes, 1971). Territories range from 0.2−0.3 ha, and males often defend display territories in close proximity to one another. Territorial males regularly engage in chases and intense fighting; however, after some clutches are completed, it is not uncommon for unpaired males to display over nesting habitat in which females have previously initiated nests (Holmes, 1971; Lanctot et al, 2000). Breeding displays are often performed with one or more other males simultaneously, but not in a duetting fashion (Lanctot et al, 2000). Adult Western Sandpipers obtain some food in the vicinity of their nests but more commonly forage in separate feeding areas along the shores of lakes, rivers, and sloughs, and in low-lying marshes (Holmes, 1971; Lanctot et al, 2000).
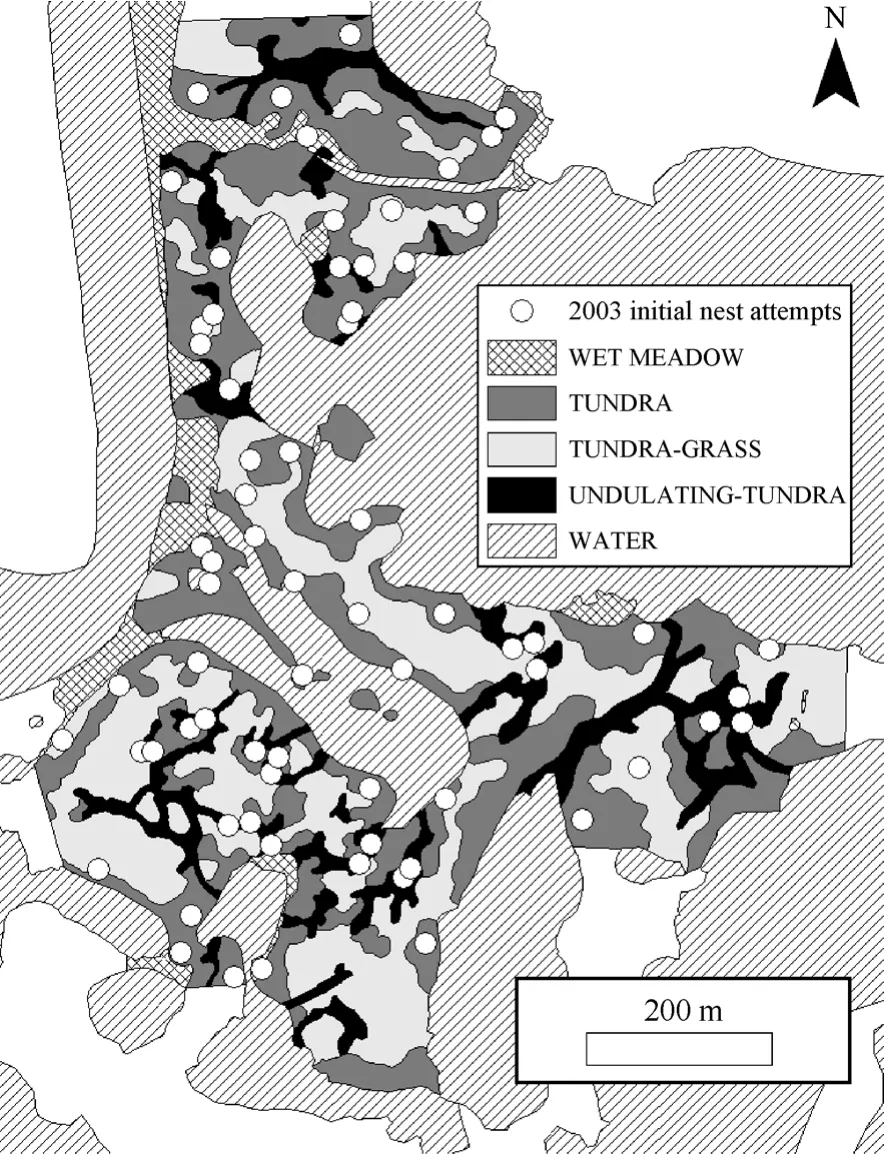
Fig. 1 Habitat map and initial nesting attempts of Western Sandpipers (2003) at the Yukon Delta National Wildlife Refuge’s Kanaryarmiut Field Station, Yukon-Kuskokwim River Delta, Alaska (2003). Habitat in white areas was not quantified.
In our study, we provide statistical support that Western Sandpipers exhibit aggregated breeding behavior. We then evaluate three hypotheses commonly invoked to explain aggregated breeding in territorial animals: (1) The social mate choice hypothesis, which predicts that aggregated males have improved success at attracting social partners compared to solitary individuals; (2) The predation hypothesis, which predicts that aggregated breeding reduces predation via antipredator strategies; and (3) The material resources hypothesis, which predicts that individuals aggregate in response to patchily distributed resources (vegetation and/or food). We tested the social mate choice hypothesis by comparing clutch initiation dates and female age between aggregated and dispersed nesting birds, the predation hypothesis by comparing nest success between aggregated and dispersed nesting birds, and the material resources hypothesis by comparing vegetation associated with aggregated and dispersed nesting birds.
1 Materials and Methods
1.1 Study site
We studied Western Sandpiper breeding behavior at the Yukon Delta National Wildlife Refuge’s Kanaryarmiut Field Station, Yukon-Kuskokwim River Delta, Alaska (61°22′N, 165°07′W). Vegetation surrounding Kanaryarmiut Field Station is a complex of lakes, sloughs, wetlands, and upland tundra corresponding to the “lowland moist low scrub” community described by Jorgenson & Ely (2001). Upland tundra vegetation is dominated by lichens, Sphagnum spp., Betula nana, Salix fuscescens, Ledum decumbens, Empetrum nigrum, Rubus chamaemorus, Eriophorum spp., and Poa eminens, and wetland and lakeshore margin vegetation is predominately characterized by sedges (Carex mackenziei, C. rariflora), and grasses (Poa eminens, Calamagrostis spp., Eriophorum spp.; Ely & Raveling, 1984). The upland tundra vegetation community is a mosaic of patches that can be classified into three basic types (Johnson & McCaffery, 2004, Johnson et al, 2009). First is upland tundra that contains graminoid species (hereafter tundragrass). The second type is upland tundra that lacks a graminoid component (hereafter tundra). The third is undulating-tundra, characterized by greater vertical relief that results in retention of water for longer periods after spring thaw and a sedge and grass component.
1.2 Field surveys
The breeding population of Western Sandpipers at Kanaryarmiut Field Station was continuously monitored for eight years (1998−2005) as part of a long-term demographic study; however, effort varied across years. In 1998 and 2002, demographic data were primarily gathered on a 16 ha plot (1998: 43 nests monitored, 53 adults banded; 2002: 58 nests monitored, 28 adults banded). During the other six years of study at this site (1999−2001 and 2003−2005), data were collected on an additional 20 ha surrounding the original plot “36 ha total; mean ± SD number of nests monitored per yr = (113 ± 25), mean ± SD number of adults banded per yr = (89 ± 16)”. Further, individual behavioral data were recorded on the 36 ha plot during the last three years of study (2003−2005). We only used data gathered during those years when the larger study plot was surveyed because of temporal variation in effort and to maintain consistency in analyses across years. Two to four observers surveyed the 36 ha study plot daily from early May through late July for banded birds, nests, and broods. Adults and chicks were marked with a U.S. Geological Survey identification band as well as with unique UV-stable color band combinations at the nest. The location and behavior of banded birds was recorded daily (2003−2005). The locations of nests and banded individuals were mapped using ArcMAP (ESRI GIS and mapping software) and nests were monitored through hatch, predation, or abandonment. We produced vegetation maps in the field by manually delineating vegetation patches (tundra, tundra-grass, undulatingtundra) on aerial photographs. Polygons were then digitized and georeferenced using ArcMAP.
1.3 Measures of aggregation
Any classification of random, aggregated, and even distributions in nature comprises arbitrary distinction made along a continuum of three spatial patterns. However, the homogeneous Poisson process is the only point process that is the equivalent of complete spatial randomness (Poole, 1974, Pielou, 1977). Testing for complete spatial randomness relies on comparing an observed spatial pattern with patterns expected for a homogeneous Poisson process. Measures of dispersion may be calculated from the distribution of individuals among sample plots or distances between individuals within a population (nearest neighbor distances; Diggle, 1983). For example, we may calculate nearest neighbor distances for initial nesting attempts on a study plot, then simulate a random distribution with the same number of points within that area, and compare the observed nearest neighbor distances with those expected from a completely random process (i.e., homogeneous Poisson). We plot observed nearest neighbor distances (empirical distribution function, solid line) against hypothetical nearest neighbor distances under complete spatial randomness (cumulative distribution function, straight dashed line) to evaluate whether an observed spatial pattern may have been generated by a completely random process (Fig 2; Dingle, 1983). If a spatial distribution is random there is a straight-line relationship between observed nearest neighbor distances and a completely random distribution (Fig. 2). This straightline relationship is the probability that empirical nearest neighbor distances take on a value equal to or less than the nearest neighbor distances expected under complete spatial randomness. If our plot of observed nearest neighbor distances falls to the left of the straight line, this indicates there is a greater probability of having nearest neighbor distances less than that under complete spatial randomness, a spatially aggregated distribution (Fig. 2). In contrast, if our plot of empirical data falls to the right of the straight line, this indicates fewer short distances than expected under complete spatial randomness, a spatially even distribution (Fig. 2).
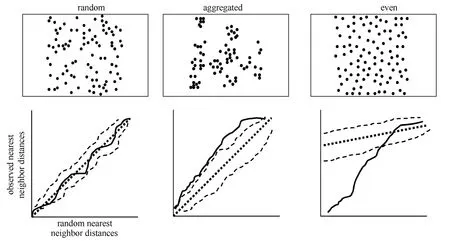
Fig. 2 Three hypothetical spatial distributions (random, aggregated, and even) with corresponding plots of observed nearest neighbor distances along the y-axes (empirical distribution functions, solid line) and nearest neighbor distances expected under complete spatial randomness along the x-axes (cumulative distribution function, straight dashed line). Irregular dashed lines in each plot provide upper and lower simulation envelopes for nearest neighbor distances under complete spatial randomness and represent sample averages.
We used the SAS macro collection for nearest neighbor analysis of a spatial point pattern (NNASPP, Schabenberger & Pierce. 2002) to determine whether Western Sandpiper initial nesting attempts were spatially aggregated on our study plot annually. We modified two macros within this collection to account for the shape of our study plot. We altered the %unitco macro so that it did not scale nest coordinate data to a unit square; instead, this macro plotted nest locations within the specified domain of our 36 ha study plot. We also updated the %hpp macro to simulate a homogenous Poisson processes within the domain of our 36 ha study plot. This macro collection computed nearest neighbor distances for initial nesting attempts on the 36 ha plot each year, simulated 1000 datasets for each year with the same number of nests randomly distributed across the plot to provide an estimate of complete spatial randomness, calculated sample averages for estimates of complete spatial randomness (upper and lower simulation envelopes), and compared observed nearest neighbor distances with estimates of complete spatial randomness using Monte-Carlo significance tests. We also used the SAS macro collection NNASPP to determine if displaying males were spatially aggregated on our study plot on a daily basis during 2003−2005. These data were gathered by two observers simultaneously surveying from the middle of the plot towards its periphery. Care was given to avoid double counting of individuals while surveying the plot. We only recorded the initial location where displaying males were observed. For spatial analysis of displaying males, we selected all days between 10 May and 10 June for which we observed at least 20 displaying males on the plot “average number of days per year ± SD = (17 ± 2), mean number of displaying males per day ± SD = (27 ± 3)”. We did not observe ≥20 males displaying on the plot in a single day outside of this period.
1.4 Nearest neighbor distance and individual male behavior
We examined individual male behavior and their spatial distribution prior to being paired with a fertile female during 2003−2005. We identified males that were not yet paired with fertile females using nest initiation data (Lanctot et al, 2000). From those, we selected males with a minimum of 10 display flight observations for analyses (minimum of four hours between consecutive observations). This process resulted in the selection of 32 males over a three-year period with a mean of 18 observations/individual. Using these data, we estimated relative display area size for each male by drawing minimum convex polygons around the location of display flights. We also computed the proportion of observations in which males exhibited behavior in five behavioral classes (display flight, chase, fight, solicit, and self-maintenance). We considered a male to have performed a display flight if he vocalized at a height of at least 5 m for a minimum of 10 s, chasing behavior entailed a male flying after one or more conspecifics, physical contact with a conspecific denoted fighting behavior, the tail-up courtship stance described by Holmes (1973) was used to quantify solicitation, and self-maintenance behaviors included loafing, sleeping, and preening. As a measure of spatial dispersion, we calculated the distance from each initial nesting attempt on the plot to its two nearest neighbors using ArcMAP. We then examined the relationship between male behaviors prior to being paired with a fertile female and the sum of the distances from each male’s initial nesting attempt to the two nearest neighboring nests using Spearman rank correlation (Zar, 1999).
1.5 Testing the Material Resources hypothesis
1.5.1 Habitat use in relation to availability
To examine the relationship between spatial dispersion and habitat patches (tundra, tundra-grass, undulating-tundra), we delineated aggregated and dispersed nesting birds by separating nearest neighbor distances (sum of the distance from each nest to its first two nearest neighbors) into quartiles annually. This resulted in nearly a three-fold difference in nearest neighbor distances between the first and fourth quartiles or aggregated and dispersed nesting birds (Tab. 1). We then overlaid initial nesting attempts on our vegetation map (Fig. 1), and calculated the number of nests within each habitat class to determine whether aggregated (1stnearest neighbor distance quartile) and dispersed (4thnearest neighbor distance quartile) nesting birds differentially nested in specific habitat patches. We compared the number of aggregated and dispersed nesting birds in each habitat type annually to the number of nests expected in each habitat type if birds utilized habitat in relation to availability using chi-square goodness of fit tests (Zar, 1999). Similarly, we evaluated the locations where the earliest arriving males (first five days males were observed displaying each year) were observed performing display flights. We compared the number of displaying males in each habitat patch type to the number of males expected in each habitat type if birds utilized habitat in relation to availability using chisquare goodness of fit tests. We also examined male and female age in relation to initial nest placement among thethree habitat patch types (tundra, tundra-grass, undulating-tundra). We grouped birds into three age classes for this analysis (minimum age, number of years observed breeding at the site = 1, 2, ≥3). We randomly selected a single nesting observation for birds observed in multiple years for this analysis to avoid pseudoreplication, and used chi-square goodness of fit tests to determine if habitat patch use among age classes varied from that expected based on availability.
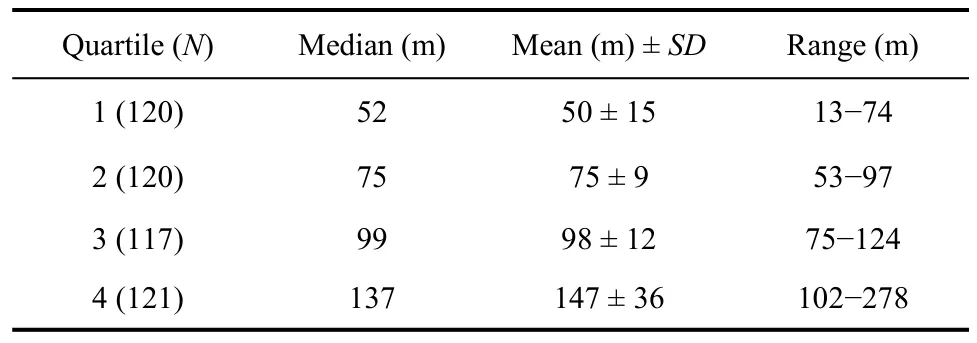
Tab. 1 Sum of distances between initial Western Sandpiper nesting attempts and two nearest neighbor nests on a 36ha plot at Kanaryarmiut Field Station, Yukon-Kuskokwim Delta, Alaska (1999−2001, 2003−2005).
1.5.2 Microhabitat associated with nests
During 2004, we examined microhabitat associated with Western Sandpiper nests (N = 128) by comparing the proportion of five vegetation types (birch, grass, herb, moss, lichen) and the amount of vertical relief within a 1 m2frame centered on each nest and a random point within 40 m of each nest. We used matched-pairs logistic regression to examine microhabitat variation between nest sites and associated random points (Johnson & Oring, 2002). We compared potential models beginning with a model containing all six predictor variables and compared this model’s fit with simpler models to achieve the most parsimonious regression model that accurately represented the data. Akaike information criteria (AIC) were computed for each model to compare model ranks and weights in determining the likelihood of each model given the data (Burnham & Anderson, 1998; Anderson et al, 2000).
1.6 Testing the social mate choice hypothesis
1.6.1 Minimum age in relation to nest dispersion
We used contingency tables to examine the relationship between Western Sandpiper minimum age and nest dispersion (Zar, 1999). We constructed a 2 x 3 contingency table for each sex with aggregated (1stnearest neighbor distance quartile) and dispersed (4thnearest neighbor distance quartile) nesting birds as rows and minimum age (number of years observed breeding at the site = 1, 2, ≥3) as columns to test whether Western Sandpiper age was independent of nest dispersion.
1.6.2 Clutch initiation date in relation to nest dispersion and habitat
We used SAS PROC MIXED to compare mean clutch initiation date, for initial nesting attempts between aggregated and dispersed nesting birds using analysis of variance (ANOVA, Littell et al, 2002). Initiation date was the dependent variable in the model, and nest dispersion was a two-level fixed factor independent variable (aggregated = 1stnearest neighbor distance quartile, dispersed = 4thnearest neighbor distance quartile). We also included year as a random factor in the model to control for annual variation. Residuals were normally distributed (Shapiro-Wilk tests P > 0.10) and had homogeneous variance after a square root transformation. We compared mean initiation date using Least Square Means (α = 0.05). Based on habitat analyses, we also performed an a posteriori analysis comparing mean clutch initiation date between birds that nested in or out of undulating-tundra habitat while controlling for year effects. This analysis was similar to that described above except the independent variable was a two-level fixed factor (nests in undulating-tundra habitat, nests not in undulating-tundra habitat).
1.7 Testing the predation hypothesis
We compared nest success between aggregated and dispersed nesting birds using logistic regression. For this model, the dependent variable, nest success (at least one egg hatched in a clutch), was a binomial response (1 = successful, 0 = unsuccessful). Nest dispersion was a categorical variable with two levels (aggregated = 1stnearest neighbor distance quartile, dispersed = 4thnearest neighbor distance quartile), and we included year (categorical) and initiation date (continuous) as covariates in the model as these factors are known to influence nest success in many avian species (Lack, 1954; Martin, 1987). Based on habitat analyses, we also performed an a posteriori analysis examining nest success between habitat types. As described above, we used logistic regression to model the probability of nest success based on whether birds nested in or out of undulating-tundra habitat while controlling for initiation date and year effects. In this model, habitat type was a categorical variable with two levels (undulating-tundra, not undulating-tundra).
2 Results
During six years of study (1999−2001 and 2003−2005), we individually color banded 453 adult Western Sandpipers and located and monitored 680 nests. Four hundred and thirty-three of these nests were initial nesting attempts on the 36 ha plot (mean number of initial nesting attempts per year ± SD = (72 ± 10).
2.1 Aggregation patterns
Displaying males exhibited an aggregated spatial distribution, and subsequent initial nesting attempts attended by those males also were aggregated. Displaying males exhibited an aggregated spatial distribution on the study plot during >80% of observation days when we observed ≥20 displaying males (2003, 83% of observation days, N = 18d, MC significance tests P <0.01 = 10d, P < 0.05 = 5d, P > 0.05 = 3d, 1000 simulations/d; 2004, 82% of observation days, N = 17d, MC significance tests P < 0.01 = 11d, P < 0.05 = 4d, P >0.05 = 3d, 1000 simulations/d; 2005, 87% of observation days, N = 15 d, MC significance tests P < 0.01 = 10d, P< 0.05 = 3d, P > 0.05 = 2d, 1000 simulations/d). Western Sandpiper initial nesting attempts were spatially aggregated on the 36ha plot throughout the course of this study (1999, χ2= 31.0, P < 0.001, N = 49; 2000, χ2= 36.2, P < 0.001, N = 84; 2001, χ2= 35.2, P < 0.001, N = 85; 2003, χ2= 41.8, P < 0.001, N = 69; 2004, χ2= 38.0, P < 0.001, N = 83; 2005, χ2= 39.0, P < 0.001, N = 63; 1000 simulations/yr). The observed distribution of nearest neighbor distances for initial nesting attempts in 2003 (Fig. 1) indicated a spatially aggregated distribution (Fig. 3). The plot of observed nearest neighbor distances (solid line, Fig. 3) falls to the left of the straight line relationship expected under complete spatial randomness (straight dashed line, Fig. 3) and is outside the simulation envelope for complete spatial randomness (irregular dashed lines, Fig. 3) indicating significant spatial aggregation. For brevity, we present the map of initial nesting attempts and plot of nearest neighbor distribution against complete spatial randomness for a single year (2003; Fig. 1,3); the comparable results for the remaining five years of study were similar.
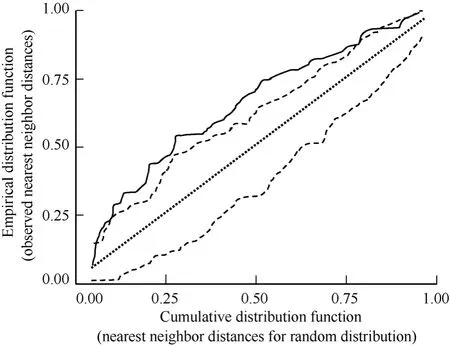
Fig. 3 Plot of the empirical distribution function of observed nearest neighbor distances for Western Sandpiper initial nesting attempts on the study plot in 2003 (solid line) versus the cumulative distribution function of a hypothetical distribution of nearest neighbor distances under complete spatial randomness (straight dashed line). Irregular dashed lines provide upper and lower simulation envelopes for the cumulative distribution function based on 1000 Monte Carlo simulations.
2.2 Nearest neighbor distance and individual male behavior
Dispersed nesting males performed song-flight displays over a relatively larger area compared to aggregated nesting males prior to being paired with a fertile female (Fig. 4). Dispersed nesting males also were observed chasing conspecifics and soliciting females more often compared to aggregated nesting males (Fig. 4). There was no correlation between nearest neighbor distances and the number of song-flight displays, amount of fighting, or self-maintenance behavior observed (all r≤ 0.2, all P > 0.25, N = 32).
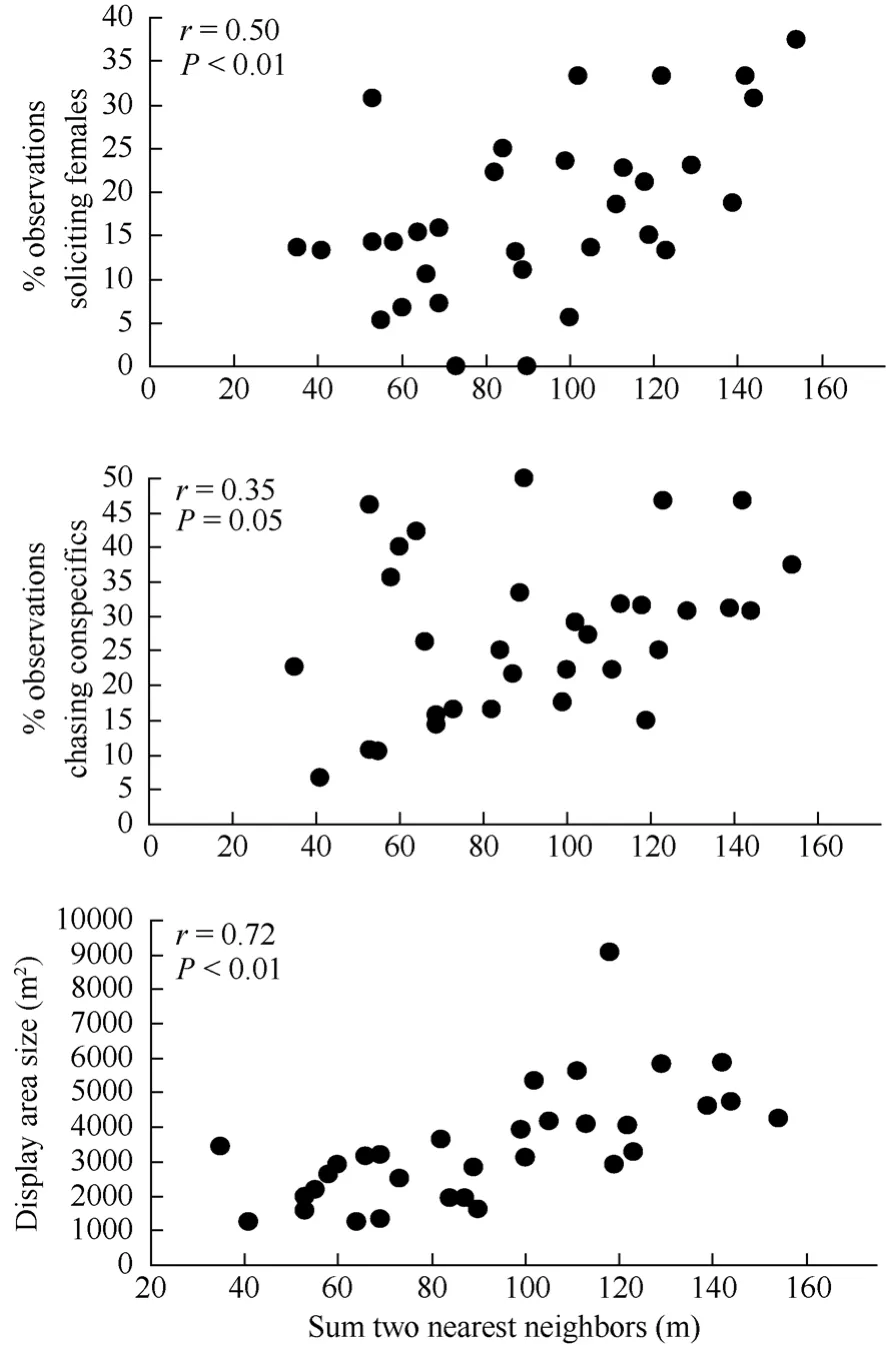
Fig. 4 Spearman rank correlations between individual male (N = 32) behaviors (proportion of observations observed soliciting females and chasing conspecifics, and display area size) prior to being paired with a fertile female and the sum of the distances from subsequent initial nesting attempts to the two nearest neighbor nests (2003−2005).
2.3 Material resources hypothesis
2.3.1 Habitat use in relation to availability
During 2003−2005, the earliest arriving males displayed more often over tundra habitat and less often over undulating-tundra habitat than expected if birds utilized habitat patches in relation to availability (Fig. 5). Among initial nesting attempts, dispersed nests were more often in tundra habitat patches, less often in tundragrass, and occurred in relative proportion to availability of undulating-tundra (Fig. 6). Whereas, aggregated initial nesting attempts were observed more often in undulating-tundra habitat patches, less often in tundra, and in relative proportion to availability in tundra-grass (Fig. 6). Younger males were more often associated with nests in undulating-tundra habitat patches, less often in tundra, and in relative proportion to availability in tundra-grass (Fig. 7). In contrast, older males were more often associated with nests in tundra habitat patches, less often in tundra-grass, and were never observed nesting in undulating-tundra (Fig. 7). Regardless of age, initial nesting attempts in the three habitat patches did not vary from that expected if females utilized habitat patches in relation to availability (1yr χ20.05,2= 2.1, P > 0.25, N = 89, 2yr χ20.05,2= 1.1, P > 0.50, N = 27, ≥3yrs χ20.05,2= 0.6, P > 0.50, N = 13).
2.3.2 Microhabitat associated with nests
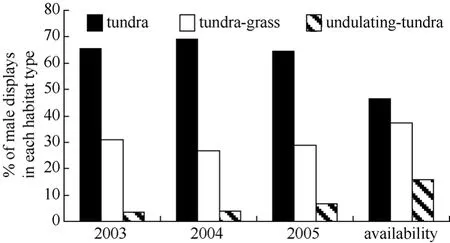
Fig. 5 Proportion of male Western Sandpiper display-flights observed over three habitat patch types during the first five days males were observed displaying on the study plot annually (2003−2005)
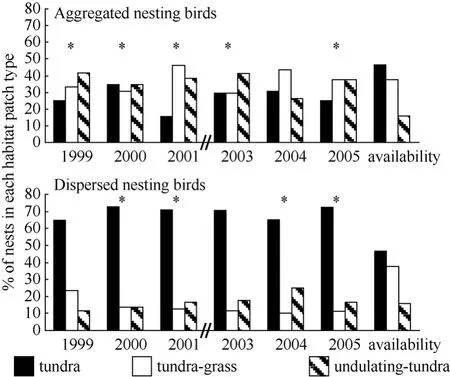
Fig. 6 Proportion of initial nesting attempts by aggregated and dispersed nesting birds in three habitat patch types on a 36 ha plot annually (1999−2001, 2003−2005)
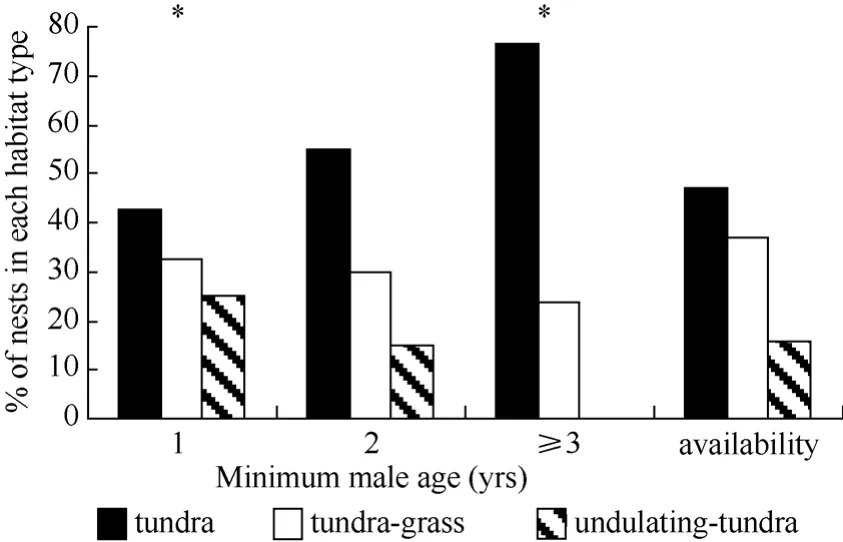
Fig. 7 Proportion of initial nesting attempts in three habitat patch types in relation to minimum male age (# yrs observed breeding at the site)
Matched-pairs logistic regression revealed the proportion of birch (all models, χ21≥11.1, P < 0.001) and graminoids (four top-performing models, χ21≥7.4, P < 0.01) within 1 m2(all other predictor variables, χ21≤1.0, P > 0.5, Tab. 2) were the dominant microhabitat predictors of nest presence. The top-performing model contained only birch and graminoids and this model had> 2 times the support of the next best performing candidate model (Tab. 2). There was a consistent positive association of birch and a negative associationof graminoids with nest sites compared to random points in the four top-performing models (Tab. 2; range of odds ratios, birch = 1.08−1.09, graminoids = 0.95−0.96).
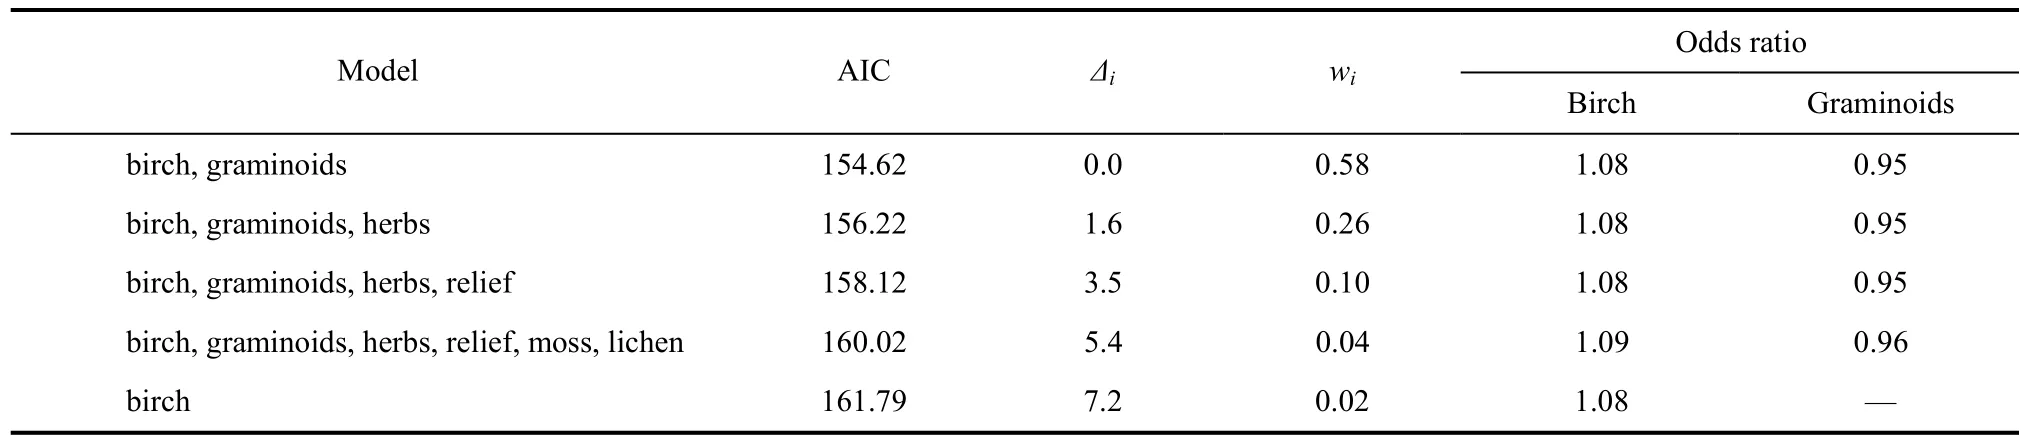
Tab. 2 Multi-model inference based on results from matched-pair logistic regression of Western Sandpiper nest sites and matched random points
2.4 Social mate choice hypothesis
2.4.1 Minimum age in relation to nest dispersion
Results did not indicate a difference in male or female age between aggregated and dispersed nests (males χ20.05,2= 3.10, P > 0.10, N = 238, females χ20.05,2= 1.59, P > 0.25, N = 129).
2.4.2 Clutch initiation date in relation to nest dispersion and habitat
Mean clutch initiation date was June 1st“mean Julian date ± SE all years combined = (152 ± 2)”.
There was no difference in mean clutch initiation dates between aggregated and dispersed nests (t213=−1.50, P = 0.14), or between nests located in or out of undulating-tundra habitat (t426=−0.91, P = 0.36).
2.5 Predation hypothesis
Logistic regression did not indicate that nest success significantly varied between aggregated and dispersed nesting birds (χ21= 0.02, P = 0.90, N = 220); however, there was significant annual variation in nest success during the course of study (χ25= 11.76, P = 0.04, N = 220). The annual percentage of aggregated nests that hatched ranged between 1%−36% and the percentage of dispersed nests that hatched annually ranged between 11%−43%. The logistic regression model examining nest success between habitat types indicated that nest success varied between nests located in and out of undulatingtundra habitat (Fig. 8, χ21= 4.2, P = 0.04, N = 433). Nests that were not in undulating-tundra patches were 63% more likely to hatch compared to nests within undulating-tundra patches (odds ratio = 1.63, 95% Wald confidence limits 1.02−2.61).
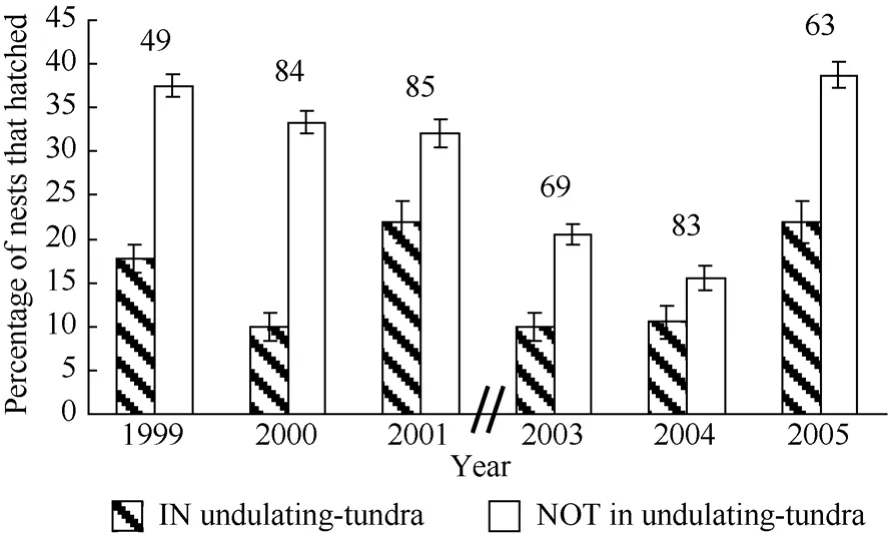
Fig. 8 Percentage of Western Sandpiper initial nesting attempts to hatch (± SD) in two habitat categories annually on a 36ha study plot at Kanaryarmiut Field Station, Yukon-Kuskokwim River Delta, Alaska
3 Discussion
Western Sandpipers exhibited aggregated breeding behavior at a relatively small spatial scale (36 ha). Prior to clutch initiation, male song flight displays were spatially aggregated and subsequent initial nesting attempts on the plot also were. Although many taxa of non-colonial birds have been reported to aggregate breeding territories (Stamps, 1988; Reed & Dobson, 1993; Cade & Woods, 1997; Danchin & Wagner, 1997; Reed, 1999; Etterson, 2003;Tarof et al, 2004), to our knowledge, this is the first study to quantify aggregated breeding behavior in a non-colonial monogamous shorebird species prior to hatch.
3.1 Social mate choice hypothesis
If sexual selection favors male aggregation because it facilitates social mate choice (Allee, 1951; Darling, 1952), then breeding aggregations of Western Sandpipers may represent an adaptive male strategy. Facilitation of mate choice would be especially important among birds in which female choice is constrained temporally because of a compressed breeding season (Veen et al, 2001) or when male parental care is important (Gowaty, 1996), such as in the Western Sandpiper.
We would expect aggregated males to acquire a mate (and subsequent clutch) earlier than more dispersed individuals if aggregated males are more attractive than solitary males, or if unpaired females more easily detect aggregated males (Real, 1990). We failed to find support for the social mate choice hypothesis in Western Sandpipers as mean clutch initiation date did not vary between aggregated and dispersed nesting birds. Because of the time constraints associated with arctic breeding, it is possible that there is little-to-no opportunity for substantial variation in clutch initiation date for Western Sandpipers (Johnson & Walters, 2008; Johnson et al, 2010). Regardless of potential temporal constraints on clutch initiation date, male aggregations could still facilitate social mate choice if aggregated males were able to attract higher quality females compared to dispersed individuals. However, we found no evidence that more experienced females were associated with aggregated nests compared to dispersed nests.
3.2 Predation hypothesis
We failed to find support for the predation hypothesis as an explanation for aggregated breeding in Western Sandpipers. The predation hypothesis (Hamilton, 1971; Pulliam, 1973) predicts that bird’s aggregate because clustering of individuals reduces predation via proximate antipredator mechanisms. However, results from six years of data revealed no consistent variation in nest success between aggregated and dispersed nesting birds.
3.3 Material resources hypothesis
The material resources hypothesis predicts that individuals aggregate in response to patchily distributed resources (vegetation and/or food, Kiester & Slatkin, 1974). We found support for the material resources hypothesis in that aggregated nests were more often associated with undulating-tundra habitat patches and dispersed nests were more often in tundra patches. The disproportionate use of undulating-tundra patches by aggregated birds resulted in a reduction in their use of tundra patches, but they did place nests in tundra-grass patches in relative proportion to habitat availability. In contrast, as a result of their disproportionate use of tundra patches, dispersed nesting birds used tundra-grass habitat patches less than expected, but used undulatingtundra habitat patches in relative proportion to availability.
Previous investigations have suggested that social organization, territorial behavioral, and nest dispersion have coevolved to increase a species’ ability to exploit resources (food, habitat, and mates) over both space and time (Holmes, 1966, 1972; Oring & Knudson, 1972; Graul, 1973; Pitelka et al, 1974; Safriel, 1975; Emlen & Oring; 1977). Among monogamous Arctic breeding sandpipers, such as the Western Sandpiper, it has been assumed “…that most if not all species in this group are dispersed relatively evenly over the available habitat each year.” (Pitelka et al, 1974). Although territory size, and subsequently breeding density, may vary as a result of whether food is primarily acquired on (Dunlin, C. alpina) or off (Western Sandpiper) the nesting territory (MacLean, 1969; Soikkeli, 1967; Holmes, 1970, 1971), large fluctuations in densities within a species at particular sites have not been reported (Pitelka et al, 1974). Holmes (1971) suggested that high densities of Western Sandpipers in some areas of western Alaska are related to the patchy distribution of suitable nesting habitat (upland tundra; dwarf shrub-heath tundra in Holmes (1971)). As a result, Holmes (1971) reported that the overall distribution of Western Sandpiper in western Alaska is clumped, but within suitable nesting habitat birds are regularly dispersed. Our results are contrary to this observation. Although Holmes’ study site was merely 30 km northwest of ours, it is possible that upland tundra vegetation was more homogeneous at his site compared to ours, and this could result in the discrepancy in observed breeding distribution between studies. Holmes (1971) did not delineate vegetation patches within upland tundra habitat as we did, thus we are not able to compare upland tundra vegetation community composition between the two sites.
3.4 Ideal free and ideal despotic distributions
Our results can be interpreted in terms of the theory of ideal free and ideal despotic distributions (Fretwell & Lucas, 1970; Fretwell, 1972). In situations conforming to the ideal free distribution, animals move freely among habitats and assort themselves in proportion to resource availability. However, once a critical density is attained in preferred habitats, individual fitness is reduced in preferred habitats and individuals begin to colonize less preferred habitat where competition is less. This results in individual fitness being equal over a range of habitats, resources, or other conditions. Alternately, the ideal despotic distribution model predicts that subordinate individuals are constrained in their choice of habitat by dominant individuals (Messier et al, 1990), resulting in differences in fitness among habitats. Primary assumptions of this model are that different habitats provide varying opportunities for individual fitness, and that competition will ensue where resources are limited (Leibold, 1995). Based on our observations that dispersed individuals more often nested in tundra habitat patches (Fig. 6), displayed over larger areas, chased conspecifics and solicited females more often (Fig. 4), that the earliest arriving males primarily displayed over tundra and tundra-grass habitat patches (Fig. 5), and that older males nested in tundra and tundra-grass but not in undulating-tundra patches (Fig. 7), we conclude that there is competition among males for tundra and tundragrass habitat patches.
For the breeding distribution of Western Sandpipers to conform to an ideal deposit distribution, fitness must vary among habitat patches. On our study plot, nests in tundra and tundra-grass habitat patches that males appeared to prefer were more likely to hatch compared to nests in undulating-tundra patches (Fig. 8). We can only speculated as to why nest success was lower in undulating-tundra patches, but we did observe mink (Mustela vison) regularly using these patches to move across the landscape from one lakeshore to another, and both Arctic (Alopex lagopus) and red (Vulpes vulpes) fox commonly used vertical structure, such as frost heaves, to apparently surprise prey while foraging near the study site. Greater vertical relief associated with undulatingtundra patches also may provide such concealment for foraging fox on our study plot. Regardless of the mechanism(s) underlying variation in reproduction, we conclude that Western Sandpipers exhibited a despotic breeding distribution on the study-plot, with subordinate males forced to aggregate their nests in undulatingtundra habitat patches where fitness is reduced. We typically think of breeding aggregations as being concentrated on or near a critical resource, Western Sandpiper breeding aggregations appear to result from dominant and/or older individuals excluding younger, subordinate individuals from preferred habitat.
3.5 Microhabitat associated with nests
There is one intriguing inconsistency in our interpretation of our results. Dispersed males nested in tundra habitat patches more often than expected based on availability, less often in tundra-grass than expected, but in relative proportion to availability of undulating-tundra patches. If nesting in undulating-tundra resulted in reduced fitness via lower nest success, why were older, more aggressive, males utilizing undulating-tundra at all? Why were these individuals not utilizing tundra and tundra-grass patches to the exclusion of undulatingtundra? Analysis of nest site microhabitat features revealed that Western Sandpiper nests were more often associated with areas containing a higher percentage of dwarf birch and a lower percentage of graminoid species. It is reasonable to suppose that reduced use of tundragrass patches by dispersed nesting birds, but continued use of undulating-tundra patches, is the result of birds avoiding graminoid species and preferentially placing nests near dwarf birch. However, such reasoning does not explain nest placement among aggregated nesting birds, as those birds used tundra-grass habitat patches in relative proportion to availability, but reduced their use of tundra patches. Continued use of tundra-grass and reduced use of tundra patches by aggregated individuals may be the result of aggregated individuals making the best of a bad situation. Aggregated males appeared to be subordinate to dispersed individuals, so they may have been excluded from using habitat other than tundra-grass and undulating-tundra patches.
4 Conclusions
Western Sandpipers exhibited a spatially aggregated breeding distribution on a 36 ha plot. Displaying males were aggregated on a daily basis as were initial nesting attempts on an annual basis. We found support for the material resources hypothesis, as dispersed individuals were more often associate with tundra habitat patches, and aggregated individuals nested more often in undulating-tundra patches. There also was support for an ideal despotic distribution with lower reproductive success associated with aggregated nesting birds in undulating-tundra patches. Although we may typically think of breeding aggregations as being concentrated on or near a critical resource, Western Sandpiper breeding aggregations appear to result from dominant and/or older individuals excluding younger, subordinate individuals from preferred habitat.
Acknowledgements:We thank B. McCaffery and the entire staff of the Yukon Delta National Wildlife Refuge for supporting this research, O. Schabenberger for technical assistance, and R. Greenburg, S. M. Haig, J Phillips, and two anonymous reviewers for their comments. Financial support was received from the U.S. Fish and Wildlife Service, the Harold F. Bailey Fund at Virginia Tech, and the U.S. Geological Survey Forest and Rangeland Ecosystem Science Center. We also thank T. Booms, J. Conklin, Z. Fairbanks, C. Fitzpatrick, L. Hamblin, P. Laver, B. Johnson, S. Nebel, A. Niehaus, L. Oring, D. Ruthrauff, D. Rizzolo, and M. Spies for assistance in the field.
Allee WC. 1951. The Social Life of Animals [M]. Boston: Beacon.
Anderson DR, Burnham KP, Thompson WL. 2000. Null hypothesis testing: problems, prevalence, and an alternative [J]. J Wildl Manage, 64: 912-923.
Blomqvist DB, Kempenaers B, Lanctot RB, Sandercock BK. 2002. Genetic parentage and mate guarding in the arctic-breeding western sandpiper [J]. Auk, 119: 228-233.
Bradbury JW, Gibson RM. 1983. Leks and Mate Choice [M]. Cambridge: Cambridge University Press.
Brown RGB. 1962. The aggressive and distraction behaviour of the western sandpiper Ereunetes mauri [J]. Ibis, 104: 1-12.
Brown CR, Brown MB. 2001. Avian coloniality: progress and problems [J]. Curr Ornithol, 16: 1-82.
Burnham KP, Anderson DR. 1998. Model Selection and Inference: a Practical Information-theoretic Approach [M]. New York: Springer-Verlag.
Cade TJ, Woods CP. 1997. Changes in the distribution and abundance of the Loggerhead Shrike [J]. Conserv Biol, 11: 21-31.
Cody ML. 1985. Habitat Selection in Birds [M]. Orlando: Academic Press.
Danchin E, Wagner R. 1997. The evolution of coloniality: the emergence of new perspectives [J]. Trends Ecol Evol, 12: 342-347.
Darling FF. 1952. Social behavior and survival [J]. Auk, 69: 183-191.
Diggle P. 1983. Statistical Analysis of Spatial Point Patterns [M]. London: Academic Press.
Ely CR, Raveling DG. 1984. Breeding biology of Pacific white-fronted geese [J]. J Wildl Manage, 48: 823-837.
Emlen ST, Oring LW. 1977. Ecology, sexual selection and the evolution of mating systems [J]. Science, 197: 215-223.
Etterson MA. 2003. Conspecific attraction in Loggerhead Shrikes: implications for habitat conservation and reintroduction [J]. Biol Conserv, 114: 199-205.
Fretwell SD. 1972. Populations in a seasonal environment [J] .Monogr Popul Biol, 5:1-217.
Fretwell SD, Lucas HL. 1970. On territorial behavior and other factors influencing habitat distribution in birds. I. Theoretical development [J]. Acta Biotheor, 19: 16-36.
Gowaty PA. 1996. Battles of theSexes and Origins of Monogamy [M] //Black JM. Partnerships in birds. New York: Oxford University Press. 21-52.
Graul WD. 1973. Adaptive aspects of the Mountain Plover social system. Living Bird, 12: 69-94.
Hamilton WD. 1971. Geometry for the selfish herd [J]. J Theor Biol, 31: 295-311.
Hildén O. 1965. Habitat selection in birds: A review [J]. Ann Zool Fenn, 2: 53-75.
Holmes RT. 1966. Breeding ecology and annual cycle adaptations of the red-backed sandpiper (Calidris alpina) in Northern Alaska [J]. Condor, 68: 3-46.
Holmes RT. 1970. Differences in population density, territoriality, and food supply of Dunlin on arctic and subarctic tundra [J]. Symp Br Ecol Soci, 10: 303-319.
Holmes RT. 1971. Density, habitat and the mating system of the western sandpiper (Calidris mauri) [J]. Oecologia, 7: 191-208.
Holmes RT. 1972. Ecological factors influencing the breeding season schedule of Western Sandpipers (Calidris mauri) in subarctic Alaska [J]. Am Midl Nat, 87: 472-491.
Holmes RT. 1973. Social behavior of breeding western sandpipers Calidris mauri [J]. Ibis, 115: 107-123.
Itzkowitz M. 1978. Group organization of a territorial damselfish Eupomacentrus planifrons [J]. Behavior, 65: 125-137.
Johnson M, Oring LW. 2002. Are nest exclosures an effective tool in plover conservation [J]? Waterbirds, 25: 184-190.
Johnson M, McCaffery B. 2004. Use of upland tundra habitats by Western and Rock Sandpipers during brood-rearing on the Yukon-Kuskokwim Delta, Alaska [J]. Wader Study Group Bull, 103: 36-39.
Johnson M, Walters JR. 2008. Effects of mate and site fidelity on nest survival of western sandpipers (Calidris mauri) [J]. Auk, 125: 76-86.
Johnson M, Conklin JR, Johnson BL, McCaffery BJ, Haig SM, Walters JR. 2009. Behavior and reproductive success of Rock Sandpipers breeding on the Yukon-Kuskokwim River Delta, Alaska [J]. Wilson J Ornithol, 121: 328-337.
Johnson M, Ruthrauff DR, McCaffery BJ, Haig SM, Walters JR. 2010. Apparent survival of breeding western sandpipers on the Yukon-Kuskokwim River Delta, Alaska [J]. Wilson J Ornithol, 122: 15-22.
Jorgenson T, Ely C. 2001. Topography and flooding of coastal ecosystems on the Yukon-Kuskokwim Delta, Alaska: implications for sea-level rise [J]. J Coastal Res, 17: 124-136.
Kiester AR, Slatkin M. 1974. A strategy of movement and resource utilization [J]. Theor Popul Biol, 6: 1-20.
Lack D. 1954. Natural Regulation of Animal Numbers [M]. Oxford: Clarendon Press.
Lack D. 1968. Ecological Adaptations for Breeding Birds [M]. London: Chapman and Hall.
Lanctot RB, Sandercock BK, Kempenaers B. 2000. Do male breeding displays function to attract mates or defend territories? The explanatory role of mate and site fidelity [J]. Waterbirds, 23: 155-164.
Leibold MA. 1995. The niche concept revisited: mechanistic models and community context [J]. Ecology, 76: 1371-1382.
Littell RC, Milliken GA, Stroup WW, Wolfinger RD. 2002. SAS System for Mixed Models [M]. Cary: SAS Institute Inc.
MacLean SF, Jr. 1969. Ecological determinants of Species Diversity of Arctic Sandpipers Near Barrow, Alaska [M]. Dissertation. Berkely: University of California.
Martin TE. 1987. Food as a limit on breeding birds: a life history perspective [J]. Annu Rev Ecol Syst, 18: 453-487.
Messier F, Virgl JA, Marinelli L. 1990. Density-dependent habitat selection in muskrats: a test of the ideal free distribution model [J]. Oecologia, 84: 380-385.
Miller EH. 1979. Functions of display flights by males of the least sandpiper, Calidris minutilla (Vieill.) on Sable Island, Nova Scotia [J]. Can J Zool, 57: 876-893.
Miller EH. 1985. Parental behavior in the least sandpiper (Calidris minutilla) [J]. Can J Zool, 63: 1593-1601.
Morse DH. 1989. American Warblers [M]. Cambridge: Harvard University Press.
Muller KL, Stamp JA, Krishnan VW, Willits NH. 1997. The effects of conspecific attraction and habitat quality on habitat selection in territorial birds (Troglodytes aedon) [J]. Am Nat, 150: 650-661.
Muller KL. 1998. The role of conspecifics in habitat settlement in a territorial grasshopper [J]. Anim Behav, 56: 479-485.
Oring LW, Knudson ML. 1972. Monogamy and polyandry in the Spotted Sandpiper [J]. Living Bird, 11: 59-72.
Oring LW. 1982. Avian mating systems [J]. Avian Biol, 6: 1-91.
Oring LW, Lank DB. 1985. Breeding Area Fidelity, Natal Philopatry, and the Social Systems of Sandpipers [M]//Burger J, Olla BL. Behavior of Marine Animals: vol. 5. Shorebirds: Breeding behavior and populations. New York: Plenum Press. 125-145
Pielou EC. 1977. Mathematical Ecology [M]. New York: Wiley.
Pitelka FA, Holmes RT, MacLean SF Jr. 1974. Ecology and evolution of social organization in arctic sandpipers [J]. Am Zool, 14: 185-204.
Poole RW. 1974. An Introduction to Quantitative Ecology [M]. New York: McGraw-Hill.
Pulliam HR. 1973. On the advantages of flocking [J]. J Theor Biol, 38: 419-422.
Real L. 1990. Search theory and mate choice, I: models of single-sex discriminations [J]. Am Nat, 136: 376-405.
Reed J. 1999. The role of behavior in recent avian extinctions and endangerment [J]. Conserv Biol, 13: 232-241.
Reed JM, Dobson A. 1993. Behavioral constraints and conservation biology: Conspecific attraction and recruitment [J]. Trends Ecol Evol, 8: 253-256.
Safriel UN. 1975. On the significance of clutch size in nidifugous birds [J]. Ecology, 56: 703-708.
Schabenberger O, Pierce F. 2002. Contemporary Statistical Models for the Plant and Soil Sciences [M]. Boca Raton: CRC Press LLC.
Soikkeli M. 1967. Breeding cycle and population dynamics in the Dunlin (Calidris alpina) [J]. Ann Zool Fenn, 4: 158-198.
Stamps JA. 1988. Consepecific attraction and aggregation in territorial species [J]. Am Nat, 131: 329-347.
Sumpter DJT, Broomhead DS. 2000. Shape and dynamics of thermoregulating honey bee clusters [J]. J Theor Biol, 204: 1-14.
Tarof SA, Ratcliffe LM. 2004. Habitat characteristics and nest predation do not explain clustered breeding in least flycatchers [J]. Auk, 121: 877-893.
Tarof SA, Ratcliffe LM, Kasumovic MM, Boag PT. 2005. Are Least Flycatcher (Empidonax minimus) clusters hidden leks [J]? Behav Ecol, 16: 207-217.
Treves A. 2000. Theory and method in studies of vigilance and aggregation [J]. Anim Behav, 60: 711-722.
Veen T, Borge T, Griffith SC, Saetre G, Bures S, Gustafsson L, Sheldon BC. 2001. Hybridization and adaptive mate choice in flycatchers [J]. Nature, 411: 45-50.
Wagner RH. 1997. Hidden leks: Sexual selection and the clustering of avian territories [J]. Ornithol Monogr, 49: 123-146.
Wittenburger JF, Hunt GL. 1985. The adaptive significance of coloniality in birds [J]. Avian Biol, 8: 1-78.
Zar JH. 1999. Biostatistical Analysis [M]. New Jersey: Prentice Hall.
导致西滨鹬集群繁殖的直接因子和最终因子
Matthew Johnson*, Jeffrey R Walters
(Department of Biological Sciences, Virginia Polytechnic Institute and State University, Blacksburg, VA 24061, USA)
该文报道了西滨鹬 (Calidris mauri) 在美国阿拉斯加州育空-卡斯科奎姆河三角洲相对较小的空间尺度上所表现的集群繁殖行为。在开始产卵之前, 西滨鹬雄鸟聚集在一处36 hm2的区域鸣唱飞行, 进行求偶炫耀。随后在该区域营巢时, 西滨鹬也保持着集群状态。检验了三个常用于解释具领域行为的物种的集群繁殖的假说:社会成员选择假说、捕食假说和物质资源限制假说。结果表明, 与斑块可利用性相比, 分散的个体常栖息于地势平坦的苔原栖息地斑块, 而集群个体常筑巢于地势起伏的苔原栖息地斑块, 因此, 该研究支持物质资源限制假说。在地势起伏的苔原栖息地斑块集群营巢的西滨鹬繁殖成功率较低, 这表明西滨鹬的这种栖息地占有模式符合理想的等级分布。在研究样地中, 年长且更具攻击性的雄鸟向雌鸟求偶的次数更多, 并且保卫位于地势平坦的苔原栖息地斑块上更大的领域; 相比之下, 年幼且攻击性较弱的雄鸟则聚集在地势起伏的苔原栖息地斑块。通常情况下, 繁殖期的集群多集中于某种关键资源的分布区内或分布区附近, 但西滨鹬繁殖集群的出现是由于年长和处于优势地位的个体将年幼和处于从属地位的个体排斥出高质量的栖息地。虽然, 繁殖领域的集群现象在很多非群居的鸟类中都曾有报道, 但该文是首次对非群居的单配制鸻鹬类物种在孵卵之前的集群繁殖行为进行了定量研究。
西滨鹬; 空间利用; 繁殖; 等级分布; 物质资源限制假说
Q958.155; Q959.722
A
0254-5853-(2011)02-0128-13
2010-11-25;接受日期:2011-02-25
10.3724/SP.J.1141.2011.02128
date: 2010-11-25; Accepted date: 2011-02-25
*Corresponding author (通信作者), Email: matthew_johnson@usgs.gov;current address: U.S. Geological Survey, Forest and Rangeland Ecosystem Science Center, Corvallis OR 97331, USA
猜你喜欢
疯狂英语·新读写(2021年2期)2021-02-25
幼儿100(2020年29期)2020-10-21
旅游纵览(2019年2期)2019-01-31
中学课程辅导·教师教育(中)(2018年9期)2018-12-24
汉语世界(The World of Chinese)(2018年3期)2018-10-22
厦门航空(2018年4期)2018-04-25
小猕猴智力画刊(2016年6期)2016-05-14
地球科学与环境学报(2013年3期)2013-02-18
西南学林(2011年0期)2011-11-12