
Distribution of driving trajectory of passenger car in highway horizontal curves
2012-06-21 01:58RENYuanyuan任园园LIXiansheng李显生GUOWeiwei郭伟伟WANGJiliang王吉亮
REN Yuan-yuan(任园园), LI Xian-sheng(李显生), GUO Wei-wei(郭伟伟),WANG Ji-liang(王吉亮)
(1.College of Traffic,Jilin University,Changchun 130022,China;2.School of Mechanical Engineering,Beijing Institute of Technology,Beijing 100081,China)
Highway horizontal curves,particularly on two-lane rural highways,have been recognized as a significant safety issue for many years[1-2].It has been estimated that crash rates on curves are 2to 4.5times higher than on straight highway sections[2-3].Therefore,it is important to collect data of driving behavior and study factors that influence accident occurrence.
Usually,the driving behavior in highway horizontal curves is approached through the speed behavior,since speeds are fundamental parameters for the design of road alignment.But analysis on accidents and driving attempts shows that,for some forms of curves,steering parallel to the axis of the highway is difficult.That probably leads to uncertainties and steering corrections,which entail for their part increased centrifugal acceleration values.For most curve accidents,such driving errors are the real cause and not the so-called inappropriately high speed alone[4].As early as the 1970s,therefore,researchers tried to identify possible relationships between drivers’track behavior and highway geometric design[5].Some scholars studied transverse distances of the vehicles from the edge of the pavement of small radius curved sections[4,6]and came to the conclusion that vehicle paths along curves coming from up direction deviate inwardly in the sharp-curved section in the cases without detecting vehicles from opposite direction,especially in the section driving in or out.And the vehicle paths from down direction always along the road center line in curves,but an obviously outward deviation when driving out curved section[7-8].However,there are few studies on the distribution of vehicle track in different road cross sections in horizontal curves.
In this paper,the deviation characteristics of vehicle transverse distance from inner edge of road and the distribution law of vehicles under free flow condition were studied,and the proposed conclusion can provide theoretical support for the reasonable optimization of widen curve,design of alignment and the management of counter flow conflicts.
1 Concept and definition of vehicle trajectory
1.1 Concept of the vehicle trajectory
The vehicle trajectories (paths or tracks)could be classified into two types:the expected trajectory and driving trajectory.
Under given road traffic conditions,the expected track ofa vehicle can be considered as a psychological anticipation,which is influenced by the current speed and the risk-taking ability.The optical structure of the road space to drivers changes with the transition from section to section along the curves.According to the perception to road alignment front and basing on the road lane centerline,drivers predict the future vehicle trajectory and make the vehicle trajectory decision.
Correspondingly,the driving trajectory along the curve(driving trajectory for short.)is a result of expected trajectory with numerous adjustments by drivers based on the current road traffic condition,which is usually subjected to road factors,velocity factors,drivers factors themselves and vehicle factors.Therefore,the mechanism of vehicle trajectory formation is very complicated.
In this paper,the vehicle trajectory related to the design of highway alignment and driving safety has the following characteristics:①It was investigated in free flow;②It was the observation trajectory;③It was the real trajectory operated by drivers;④It was related to the vehicle type selected.Therefore,it can indicate the adaptability of drivers to road traffic condition,and its deviation can indicate the inconsistent between expectation of drivers and highway alignment design.
1.2 Definition of objects
To avoid ambiguous statements,involved key objects in this paper(Fig.1)were defined as follows:
①Curved section:mainly refer to curved sections of two-way highway road,especially in rural,without physical separation in the middle,namely,mainly curved sections of roads of secondary level or below.
② Vehicle trajectory:when the vehicle runs into the curved section,the route passed by the left front wheel is defined as vehicle path or trajectory.
③ Driving direction:the direction driving along the outer side of curved section is defined as up direction,while that driving along the inner side of curved section is defined as down direction,which can be seen in Fig.1.
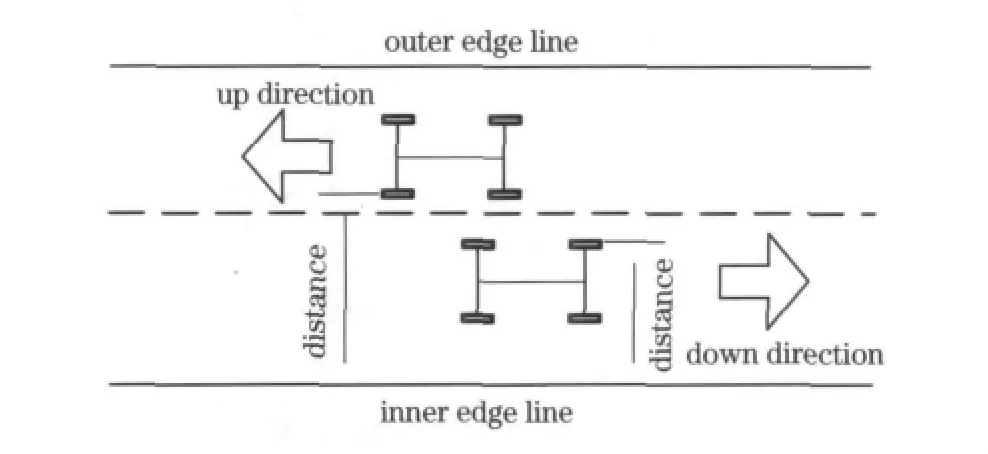
Fig.1 Measurement schematic diagram of vehicle trajectory
2 Experimental designs and data processing
2.1 Selection of experimental curved section and data sample
The selected curved section is two-lane highway,in which the road level is secondary.The radius is 310m,the width is 9m,and the road passing condition is sound,while the traffic engineering facilities is criteria.Totally 400vehicles in both directions in the view of the limitation of twolane roads of secondary level or below were measured in the field during daytime.
2.2 Division of crucial points
Apparently,more observation points can help to achieve better results.However,for the limitation of costs and personnel,the least but satisfied observation points must be selected at first.According to the feature of highway alignment,three points can meet the research requirements very well,which respectively are QZ point,HY point and YH point.In order to obtain a smooth vehicle track path,another two points between HY and QZ,QZ and YH also are indispensable.So,at least 5observation points were set up in this paper,i.e.the curve is divided into five crucial sections(Fig.2),namely,ZH,HY,QZ,YH and HZ as reference points in analysis of vehicle track mutability.
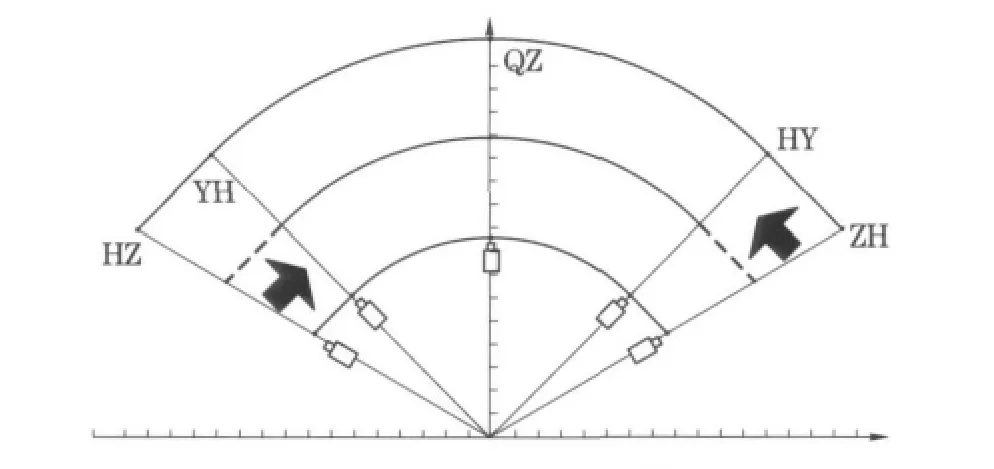
Fig.2 Schematic diagram of coordinate system of vehicle trajectory
2.3 Coordinate system and curve fitting method
Because of the limitation of only 5detecting points,in order to get the whole driving track path in curved section,cubic spline interpolation is adopted to fit the 5detecting data of one vehicle.The interpolation method can increase data of vehicles driving track path but decrease experimental cost of adding observation points.
The inner edge of highway horizontal curves should be expressed firstly to ensure the accurate expression of vehicle track along the curves.It can be approximately viewed as continuous curve which is composed of multi-round curves with the same centre but different radius.Taking the complexity of interpolation and coordinate expression,rectangular coordinate system into account is the selection in this paper.To reduce the complexity,the center of round curves on inner edge is taken as the center of the rectangular coordinate system (Fig.2).
Therefore,in the coordinate system,every point on inner and outer edge of horizontal curves and on vehicle track can be quantized as a 2-dimensional coordinate in the right angle coordinates,as shown in Fig.3.At last,the whole vehicle track path in curved section will be calculated.
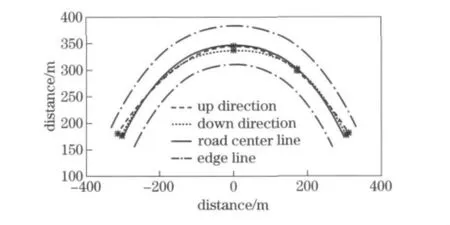
Fig.3 Fitting graph of vehicle trajectory in different driving direction in curve
3 Analysis of trajectory deviation
3.1 Track types
According to the observation data,several vehicle track types were classified.The types are different between up direction and down direction,which are shown as follows.
①Track types in up direction.
Type 1(Ua):the track path formed by vehicle left wheel is always kept in the lane throughout driving.
Type 2(Ub):the track path formed by vehicle left wheel is kept in the opposite lane throughout driving.
Type 3(Uc):the track path formed by vehicle left wheel is strongly cut the road centerline in the middle of road curved section throughout driving.
Type 4(Ud):the track path formed by vehicle left wheel has a pronounced tendency to drive on the down direction at the beginning of the curve and an increasing drift to the up direction at the end of the curve.
Type 5(Ue):the track path formed by vehi-cle left wheel has a pronounced tendency to drive on the up direction at the beginning of the curve and an increasing drift to the down direction at the end of the curve.
Type 6(Uf):the track path formed by vehicle left wheel sometimes increases drifting towards inside or outside of the curve in the first half or second half of curve.
②Track types in down direction.
The track types in down direction are basically the same as the types in up directions except the vehicle track driving along the curve on the opposite lane all the time,which can be seen from Fig.4.The influencing factors may reduce the difference,such as the lane widths,the sight distance,and the obstacles in roadside.
3.2 Analysis of transverse distances of vehicles from road edge
Generally,the drivers operate their vehicles at a clearly larger distance from the road edge than from the centerline both in up direction and in down direction.
In up driving direction,the maximum transverse deviation appears on the section of turning out the curve,section 4,and the maximum value comes up to 1.01m,as shown in Tab.1.In down driving direction,the maximum transverse deviation appears on the section of turning into the curve,section 5,and the maximum value comes up to 1.09m.
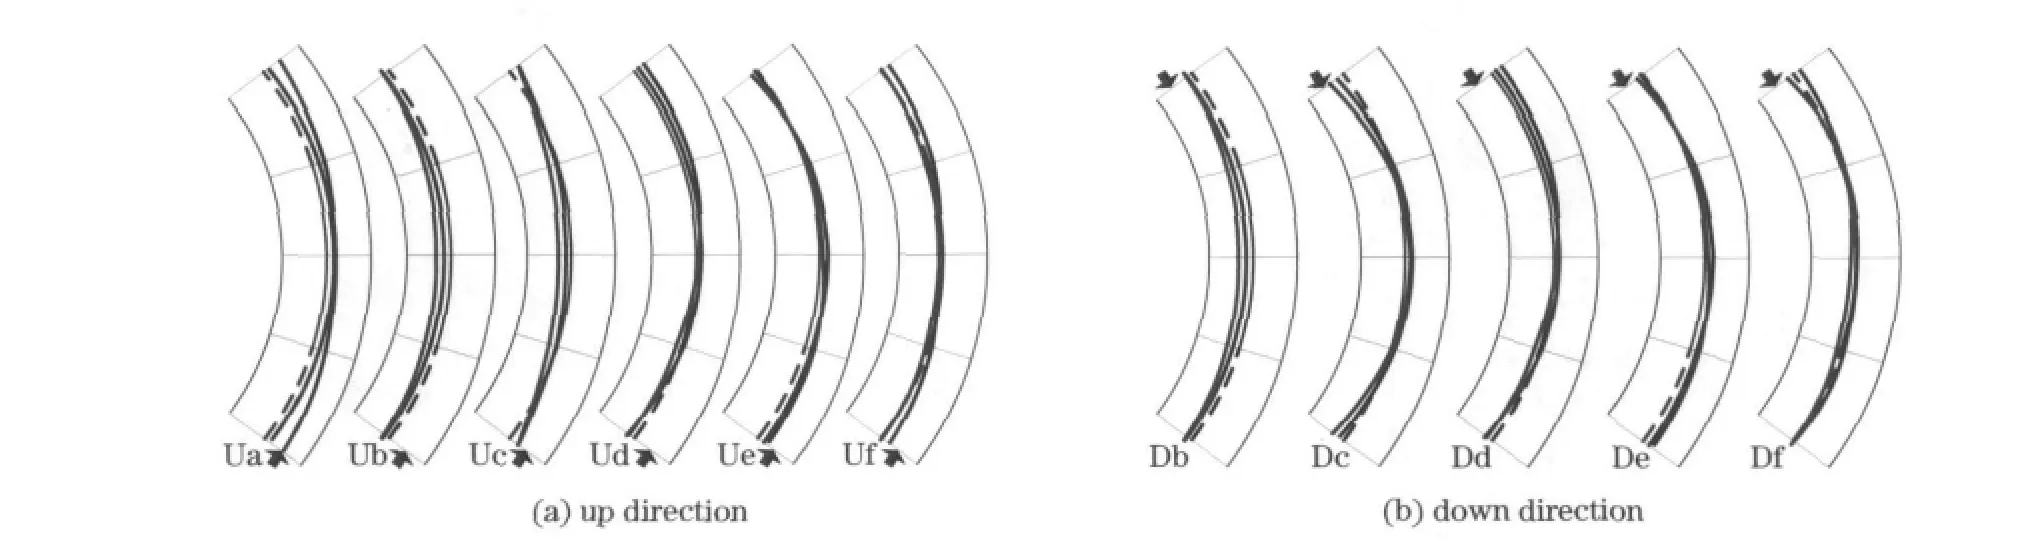
Fig.4 Sketch of track types of in different driving directions
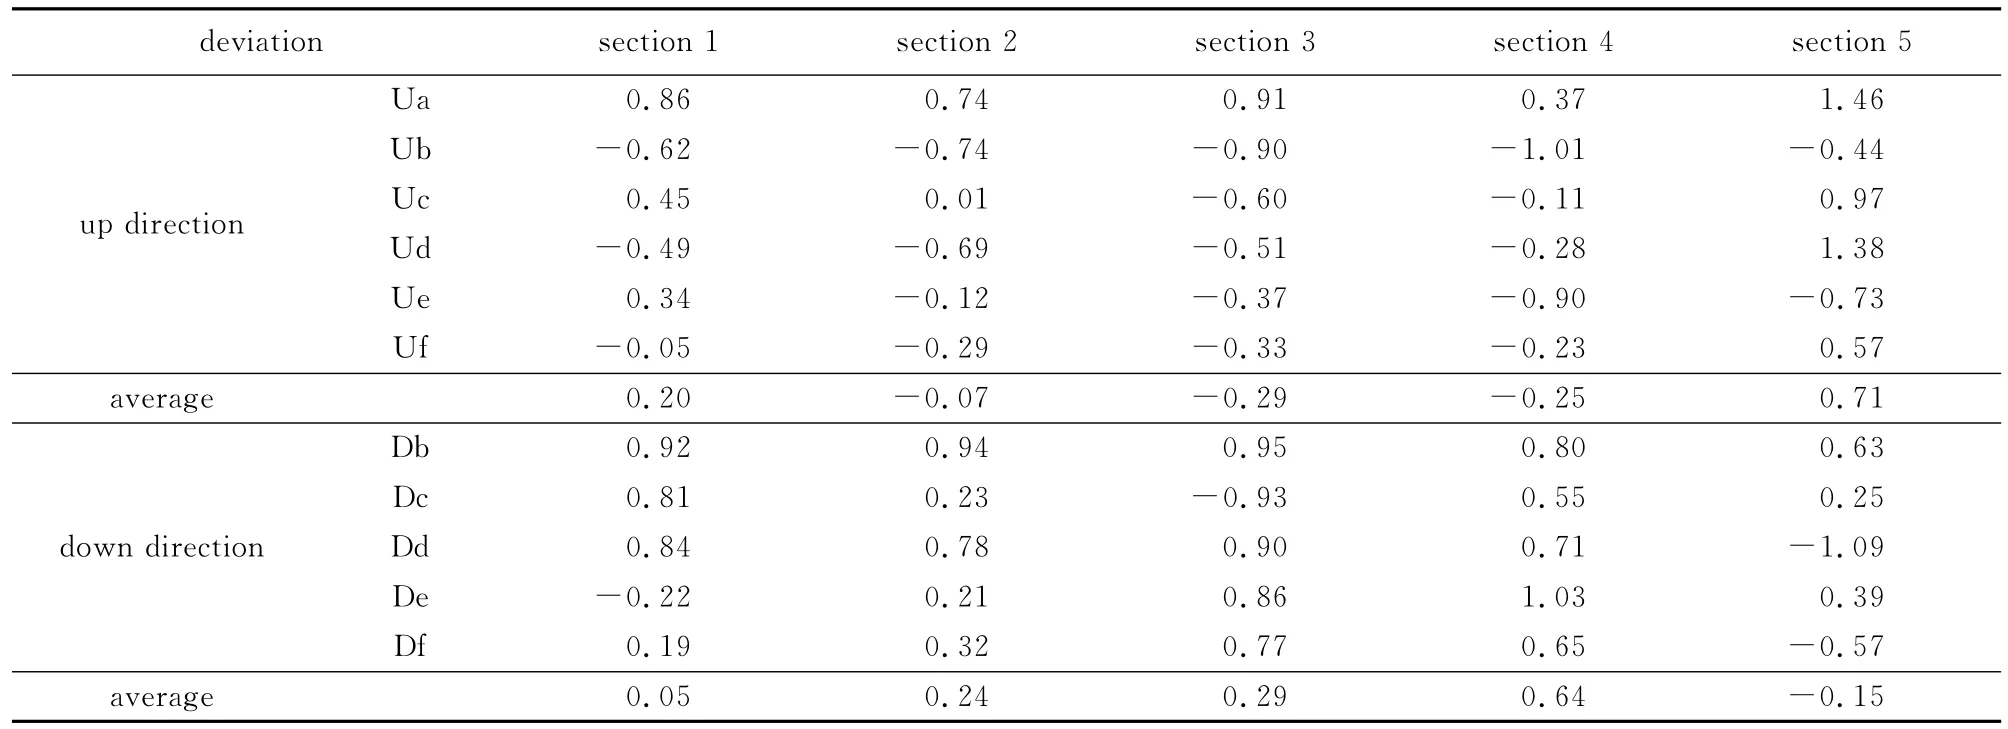
Tab.1 Transverse distances of vehicles from the inner edge of highway
4 Distribution of driving track on highway horizontal curve
4.1 Trajectory distribution form
The trajectory statistic parameters of passen-ger cars in different road cross sections in different driving directions can be obtained by using SPSS,the cumulative frequency curves,the frequency distribution diagram and the probability density curve are also shown in Figs.5-7.
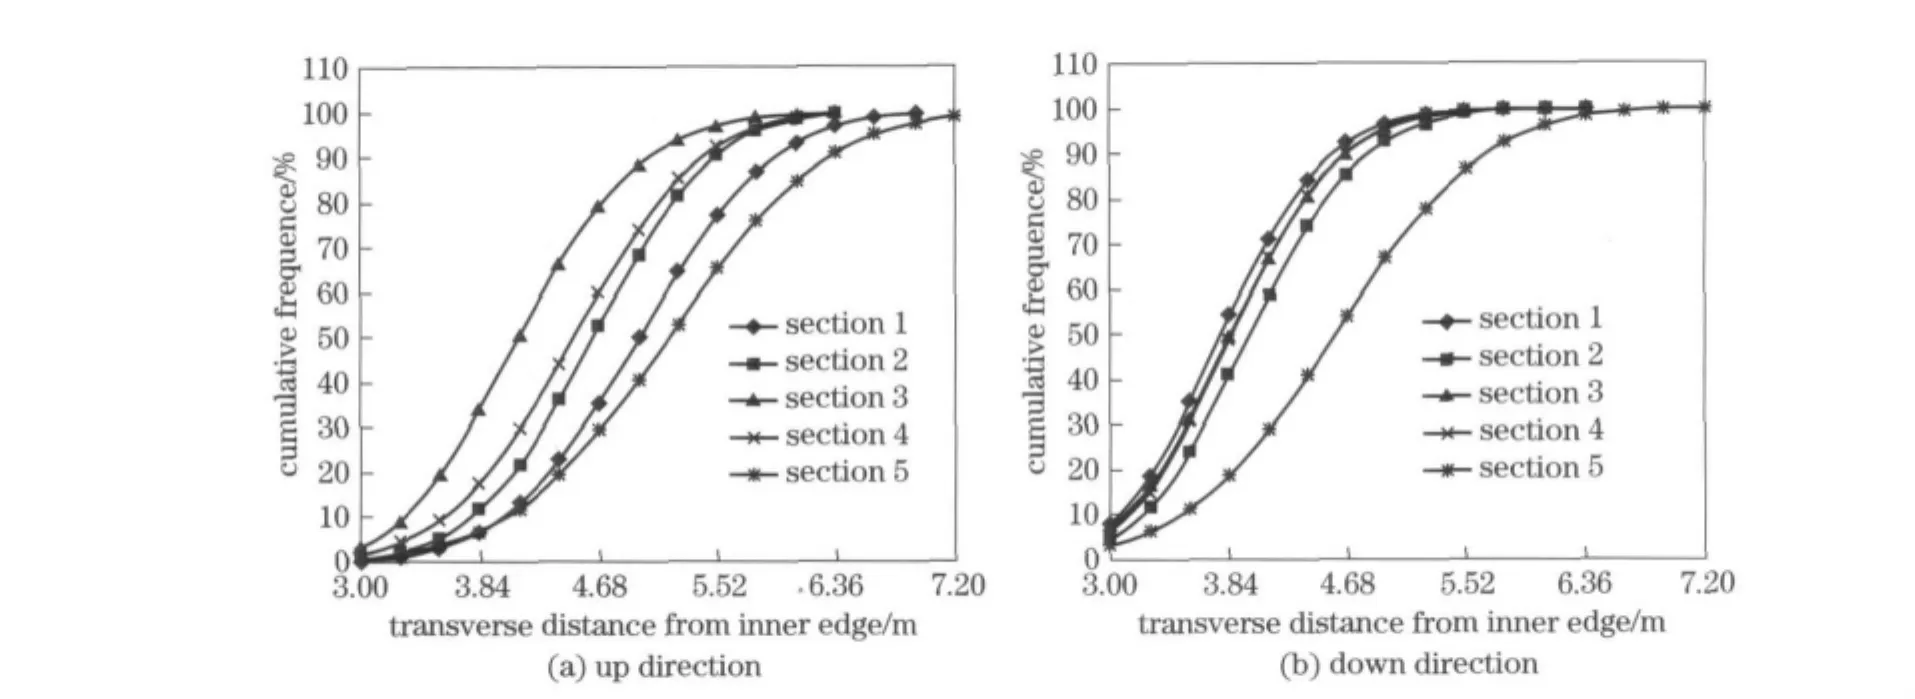
Fig.5 Cumulative frequency curves in up and down driving directions
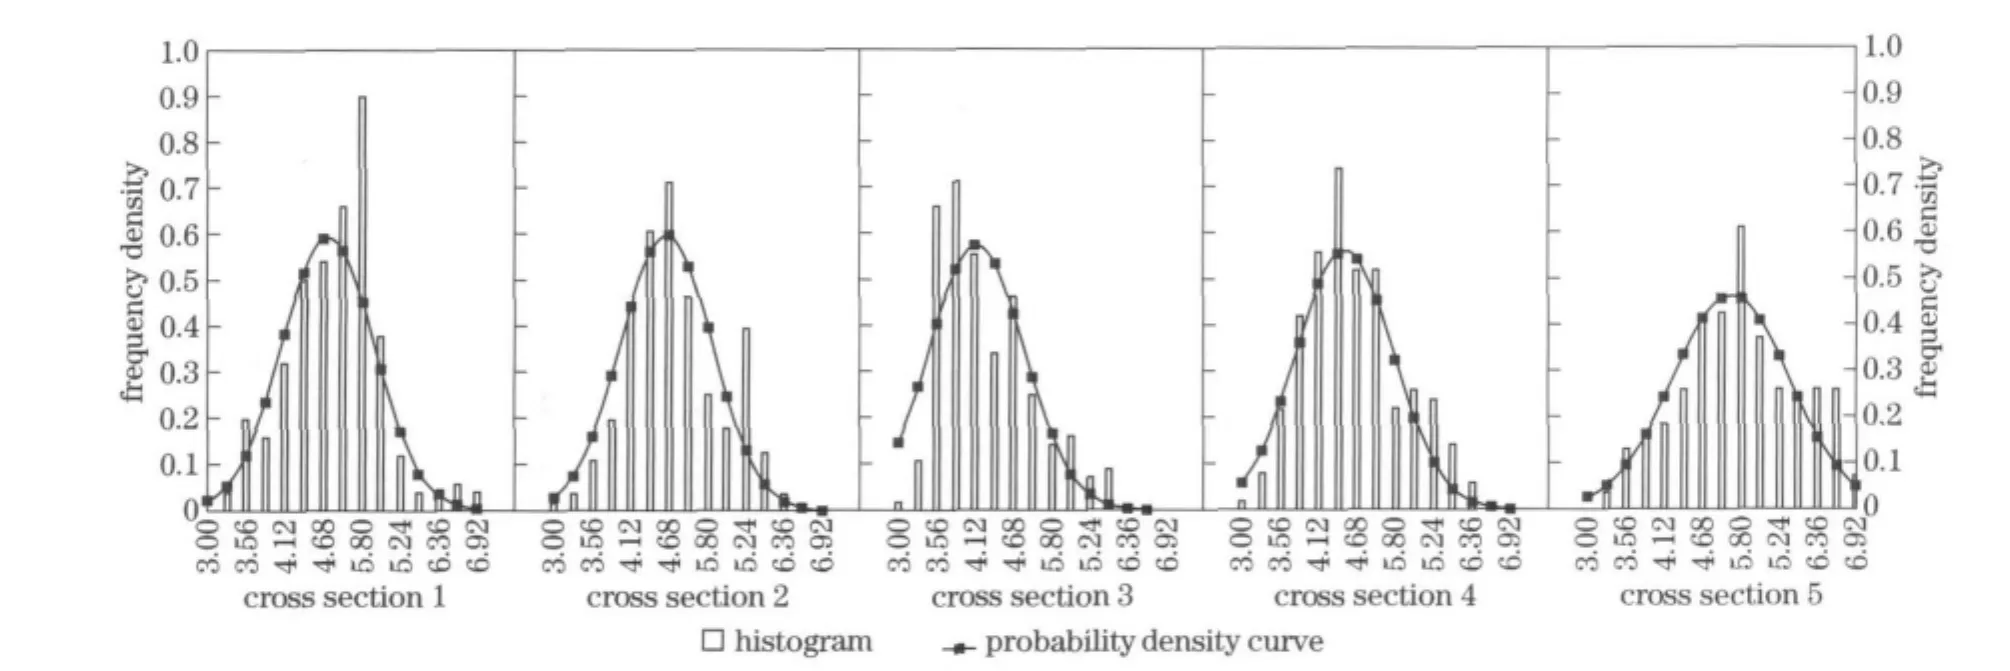
Fig.6 Trajectory distribution of vehicle in different road cross sections of up direction
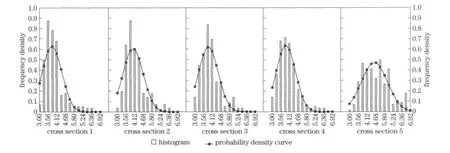
Fig.7 Trajectory distribution of vehicle in different road cross sections of down direction
4.2 Probability density functions
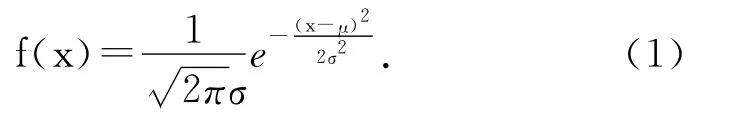
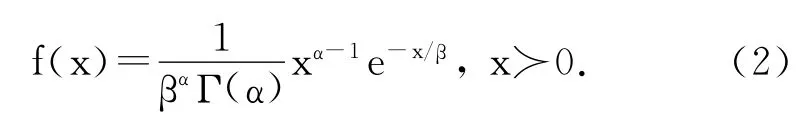
K-S test and chi-square test were used to test normal distribution and gamma distribution for collected trajectory sample data,and the test results show that the vehicle transverse distances from the inner edge of the pavement in section 1,section 2,section 4and section 5in up driving direction and Section 5in down direction show statistically the normal distribution.And section 3in up direction and section 1,section 2,section 3and section 4are show statistically the gamma distribution.The probability density function is respectly shown as function 1and function 2.The function parameters are shown in Tab.2.
The trajectory distribution in up driving direction is obviously different from that in down direc-tion.The most vehicle transverse distance from the inner edge of the pavement in up driving direction is a normal distribution,which means the number of vehicles driving across the centerline is more than those driving in their own lanes.And the most transverse distance of vehicles from the inner edge of the pavement in down driving direction is a gamma distribution,which means that the number of vehicles driving across the centerline is less than those driving in their own lanes.
Normal distribution:
Gamma distribution:
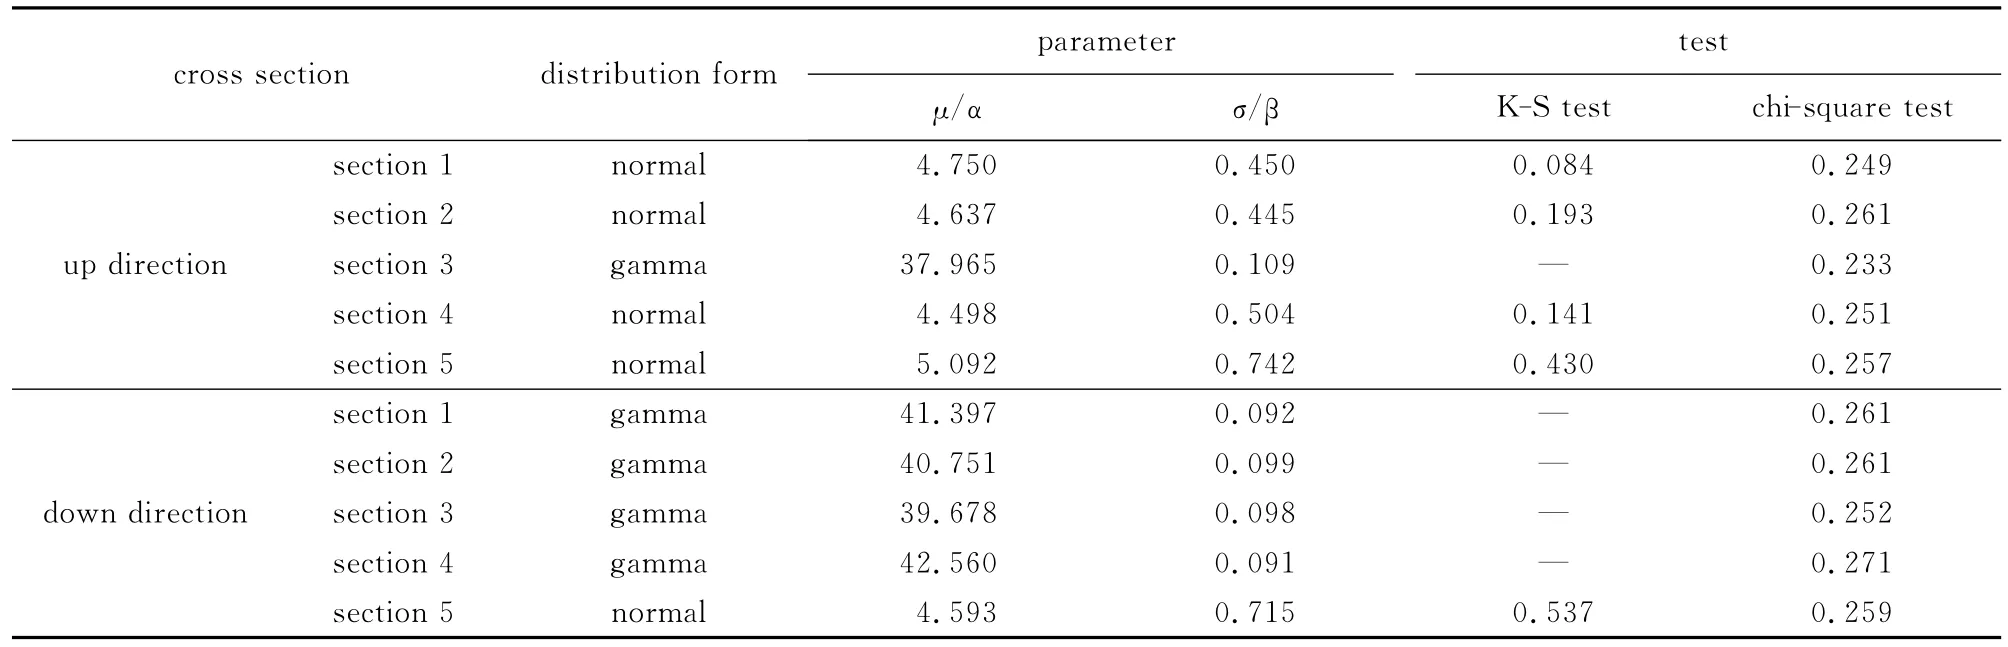
Tab.2 Distribution law of passenger car trajectory in different cross sections
5 Discrete degree of vehicle trajectory
The concept of deviation is introduced to describe the discrete degree of each point on cumulative frequency curves quantitatively,in order to obtain the key point of vehicle trajectory distribution curves.The concentration degree between random variable and its mean value can be expressed by the deviation which can also show the gap between estimate value and actual value.The deviation can be expressed by

whereDiis random trajectory variable,andE(D)is expectation of the transverse distance value with the range ofD50,D60,…,D80and so on.The variation of vehicle trajectory in different cross sections in different driving directions of horizontal curves was respectively calculated as shown in Fig.8.
From Fig.8,the discrete degree of vehicle trajectory increases gradually when the value ofE(D)changes fromD50toD95,and the growth shows a regular variation.There is an obvious inflexion point when the value ofE(D)isD85.Therefore,the value ofD85can be considered as a characteristic parameter in order to analyze the safety of vehicle operation in highway horizontal curves,likeV85in speed.
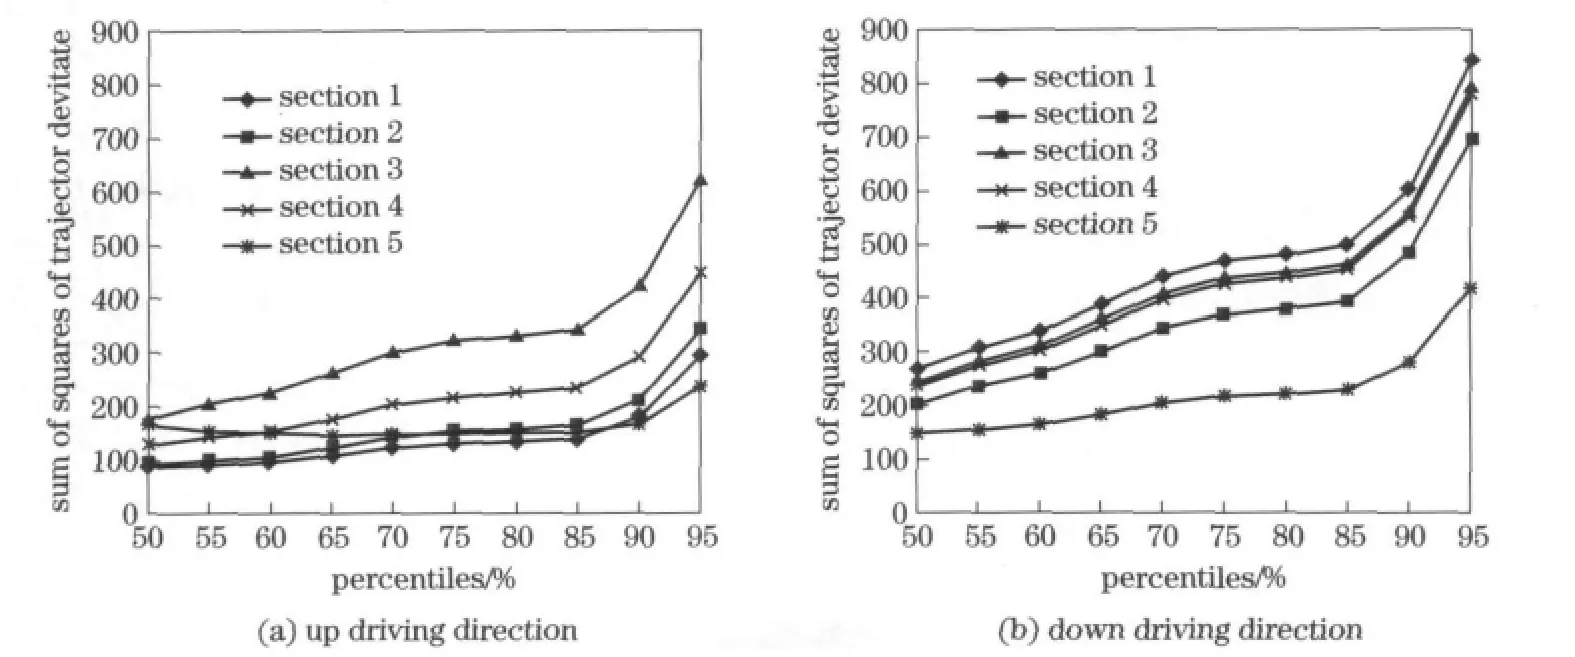
Fig.8 Discrete degree of vehicle trajectory in up and down driving directions
6 Conclusions
①A smooth vehicle trajectory curve has been fitted according to 5detecting data through adopting cubic spline interpolation,and the trajectory types have been classified.It shows that there are 6types of vehicle track in up driving direction and 5types in down direction.
②The experiments and analyses show obvious differences between the designed and actual track of passenger cars,and the differences also exist in vehicles in the same horizontal curve but different driving directions.
③In the same driving direction,the vehicle transverse distances from the innner edge of the pavement in section 1,section 2,section 4,section 5in up driving direction and section 5in down direction show a normal distribution,and section 3 in up direction and section 1,section 2,section 3,section 4show a gamma distribution.
④The cumulative frequency curve of vehicle trajectory shows that,there is an obvious inflexion point when the value ofE(D)isD85.Therefore,the value ofD85can be considered as a characteristic parameter in order to analyze the safety of vehicle operation in highway horizontal curves likeV85in speed.
In the further research,the vehicle path or trajectory at different speeds will be investigated and studied,so that the results would provide theoretical support for the reasonable optimization of widen curve,design of alignment and the management of counter flow conflicts.
[1]Bhatnagar Y S.Observations on the use of chevron alignment markers[J].Proceedings of 17th Australian Road Research Board Ltd(ARRB)Conference,1994,17(5):65-81.
[2]Johnston I R.Modifying driver behavior on rural road curves:a review of recent research[J].Proceedings of 11th Australian Road Research Board(ARRB)Conference,1982,11(4):115-24.
[3]Leonard II J D,Bilse D P,Recker W W.Superelevation Rates at rural highway intersections.Final Report:UCI-ITS-RR-94-1,RTA-53P434[R].Irvine:California University,1994.
[4]Spacek P.Track Behavior in curve areas:attempt at typology[J].Journal of Transportation Engineering.2005,131(9):669-676.
[5]Glennon J C,Weaver G D.The relationship of vehicle paths to highway curve design.Project No 2-8-68-134,No 134-5[R].Texas:Texas Transportation Institute,1971.
[6]Sun Xiaoduan.Impact of edge lines on safety of rural two-lane highways.LTRC Project Number:03-6P,State Project Number:736-99-1163[R].Lafayette:Civil Engineering Department University of Louisiana,2005.
[7]Spacek P.Track Behavior and accident occurrence in curves on two-lane highways in rural areas.FGSV 002/67[R].German:Transportation Research Board,2000.
[8]Zhao Liang.Thevehicle driving behavior theory and the study of the risk sensitivity computer simulation system based on the 3DMAX[D].Xi’an:Chang’an University,2005.05.(in Chinese)
(Edited byCai Jianying)
 Journal of Beijing Institute of Technology2012年2期
- Journal of Beijing Institute of Technology的其它文章
- Artificial neural network modeling of mechanical properties of armor steel under complex loading conditions
- Optimization of the carrier tracking loop for GPS high dynamic receivers
- Vibration test of micro machined gyroscope based on high speed photography and SURF
- Experimental validation method of elastic thin rod model for simulating the motional cable harness
- Calculation methods of lubricant film pressure distribution of radial grooved thrust bearings
- Development of an occupant restraint system model and parametric study on equivalent crash pulse in vehicle frontal offset crash